SteadyOptions is an options trading forum where you can find solutions from top options traders. Join Us!

We’ve all been there… researching options strategies and unable to find the answers we’re looking for. SteadyOptions has your solution.

SPX Calendar Spreads: Historical P&L Levels


We decided to investigate SPX calendar spreads from 2007 to present. More specifically, we wanted to know how frequently unmanaged SPX calendar spreads reached specific profit and loss levels relative to the initial debit paid. The results can be used for practical use of the calendar spread strategy. 

Study Methodology


Here are the specifics of the test:


Time Period: January 2007 to Present


Trade Setup: On each trading day, locate the standard expiration cycle with 30-45 days to expiration. If the front-month standard expiration cycle did not fall within that time frame, we simply did nothing and proceeded to the next trading day.


When the front-month expiration cycle fell between 30-45 days to expiration, we “sold” the at-the-money put in that cycle. In the following standard expiration cycle, we purchased the put at the same strike price to complete the calendar spread.


Position Tracking: Each position’s profit/loss as a percentage of the debit paid was tracked on each trading day until the day before settlement. We did this to avoid any unwanted outcomes as a result of the SPX settlement process.


Overall, 1,200 SPX calendars were tracked.


Once all of the profit/loss metrics were gathered, we filtered the trades into four buckets based on the VIX Index level at the time of entering the trade:

  • VIX Below 15
  • VIX Between 15 to 20
  • VIX Between 20 and 25
  • VIX Above 25


Each bucket had a similar number of occurrences.


The Results: Profit/Loss Frequencies for 30-45 DTE SPX Calendar Spreads


Let’s take a look at the data! We’ll start with the percentage of calendar spreads that reached profit levels between 10-100% of the initial debit paid:


SteadyOptions_SPXCalendar_Win_Plot.png


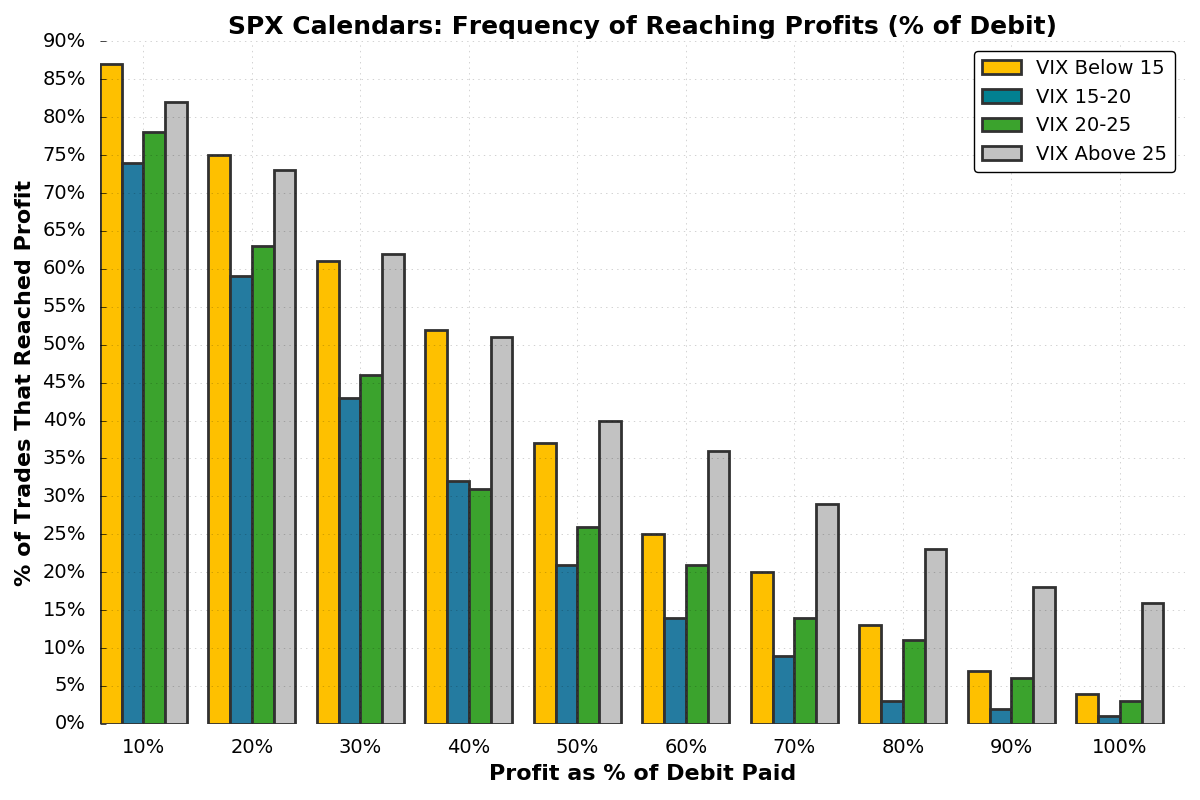
There are some key findings from these results:

  1. Over 50% of the trades reached returns of 40% or more on the initial debit paid, with 75% of the positions reaching 10-20% returns on the debit paid.
  2. The low IV (VIX below 15) and high IV (VIX above 25) had the highest percentage of trades that reached each profit level.


High IV calendar spreads in second place? How can that be?


In super high IV environments, the VIX term structure (SPX volatility) goes into backwardation. As a result, the near-term expiration cycles trade with significantly higher implied volatility than longer-term expiration cycles. When volatility comes back down, the front-month implied volatility will fall with greater magnitude than the back-month implied volatility, which can lead to quick profits on a calendar spread if the underlying hasn’t moved too much. The only problem is that in high implied volatility environments, realized volatility tends to be high, which is not ideal for delta-neutral calendar spreads.


So, in high IV, long calendar spreads become more of a term structure reversion trade, and less of a time decay trade.


Let’s move on to the loss frequencies:


SteadyOptions_SPXCalendar_Loss_Plot.png


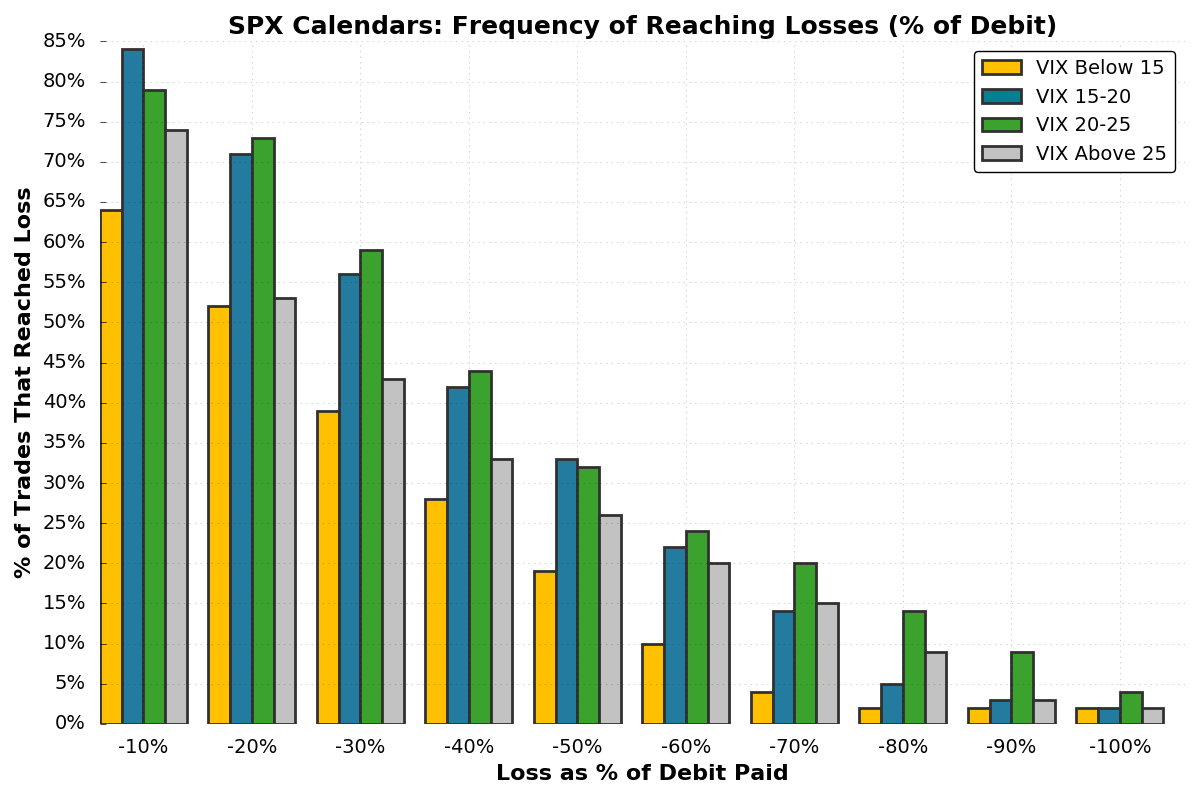
In low IV environments, the SPX calendar spreads reached each loss level less frequently than in higher IV environments. Again, this is most likely due to the fact that realized volatility tends to be more significant in times of high implied volatility.


When you compare the calendar spread profit frequencies to the loss frequencies, we can see that the biggest gap (profit frequency – loss frequency) is typically in the low IV (VIX below 15) trades. For example, in the low IV bucket, over 85% of positions reached a 10% profit, while 65% reached a 10% loss.


In the 15-20 VIX trades, 75% of trades reached a 10% profit, while 85% reached a 10% loss.


Of course, you’d like to see a large gap between the percentage of trades that hit each profit and loss level (more trades reach the profit level as opposed to the loss level).


To visualize this, we simply subtracted the loss frequency from the profit frequency at each level:


SteadyOptions_SPXCalendar_Win_Loss_Difference.png


As we can see, the calendars entered when the VIX was between 15 and 25 reached the loss levels more frequently than the same profit level (resulting in a negative value).


In the low (VIX below 15) and high (VIX above 25) volatility environments, the SPX calendar spreads reached the profit levels more often than the same loss level.


Summary


What can we learn from this calendar spread profit and loss data? First and foremost, calendar spreads typically perform very well in extremely low implied volatility environments, but they also have potential when front-month IV is inflated at a significant premium to the back-month IV. However, there are strategies that may be more suitable for time when implied volatility is high.


Second, based on a positive spread between profit and loss frequencies, calendar spreads have historically had positive expectancy at each profit/loss level, as profits have occurred more often than losses of the same magnitude.


On a final note, it’s important to keep in mind that this is a backtest based on closing values. As a result, it’s likely that there were trades that hit profit or loss levels intraday, but ended the day less than those levels.


Additionally, these positions were not managed, which is the key to success when trading calendar spreads. At the very least, the data discussed in this post can help to guide management levels, and expectations for achieving certain profit/loss levels when trading SPX calendars.


About the Author


Chris Butler is the founder of projectoption, an options trading education and research website. Chris primarily trades non-directional options strategies in equity indices (SPX, RUT, /ES Options), but is also active in volatility-related ETNs (VIX Options, VXX, XIV).

What Is SteadyOptions?

Full Trading Plan

Complete Portfolio Approach

Diversified Options Strategies

Exclusive Community Forum

Steady And Consistent Gains

High Quality Education

Risk Management, Portfolio Size

Performance based on real fills

Subscribe

Non-directional Options Strategies

10-15 trade Ideas Per Month

Targets 5-7% Monthly Net Return

Visit our Education Center

Recent Articles

Articles

  • Long Straddle Options Strategy: The Ultimate Guide

    A long straddle is an options spread that involves the simultaneous purchase of a put and a call at the same strike price and expiration date. It’s a long-options, market-neutral strategy with limited risk and unlimited profit potential.

    By Pat Crawley,

    • 0 comments
    • 225 views
  • Ready to Invest? Here's How to Get Started with Online Trading

    I am struggling with making the decision to get started.  How much money do I need to be efficient and effective following your instructions?  What software and where to find it?  I could really benefit from extra income but I am also in a position where I can't really afford to lose much so there is some doubt/fear.  But, your information and attitude felt right to me so I reached out.

    By Karl Domm,

    • 0 comments
    • 191 views
  • The Importance  of Proactive Hedging in Options Trading

    Investing in the stock market can be a daunting task for even the most experienced investors. With the constant fluctuations and volatility of the market, it can be difficult to predict the future direction of the market. This is where options trading comes into play.

    By Karl Domm,

    • 0 comments
    • 295 views
  • The Silent Bank Run

    Long before Silicon Valley Bank failed, the banking sector was experiencing a silent bank run. Unlike the Great Depression, where lines of people clamoring for their money were blocks long, this silent bank run, as its name portends, has been out of sight until recently. There are a couple of reasons for this. 

    By Michael Lebowitz,

    • 0 comments
    • 225 views
  • High Probability Strategy: A Holy Grail of Options Trading?

    A lot of options traders consider a 90% probability strategy a Holy Grail of trading. After all, if you can win 90% of the time, you should be able to grow your account very quickly, right? Well, not only this is not necessarily true, but in fact, a Winning Ratio alone tells you nothing about your chances to be profitable.

    By Kim,

    • 0 comments
    • 233 views
  • The 10 Best Options Trading Books

    Options trading can be challenging. I look at it as a journey, a long term investment, which is no different that graduating from University. And like University, you need to do a lot of reading, along with a lot of practicing. Fortunately, there are a lot of books out there that can be of tremendous help in this journey.

    By Kim,

    • 0 comments
    • 350 views
  • OptionNET Explorer (ONE) Software

    OptionNET Explorer (ONE) is a complete options trading and analysis software platform that enables the user to backtest complex options trading strategies, analyze their results and monitor them in real-time, all from within a single, user friendly environment. 

    By Kim,

    • 0 comments
    • 336 views
  • Delta Hedging Your Options Strategies

    All traders begin with an introduction to call and put options.  However, it's rare (apart from short puts) that an experienced trader would use these contracts by themselves. Instead, we primarily trade options spreads. There are many benefits to spreads. The variety of spreads are targeted to various market criteria and market environments.

    By Drew Hilleshiem,

    • 0 comments
    • 9,283 views
  • What Happened to SFO Magazine (SFOMag)? Stocks, Options and Futures Magazine

    Remember SFO Magazine? Traders like Jack Schwager and Brett Steenbarger used to write for the publication before its swift shutdown in 2012. What happened. SFO (Stocks, Futures, and Options) magazine was a monthly financial magazine focused on trading and investing in stocks, futures, and options markets.

    By Pat Crawley,

    • 0 comments
    • 1,149 views
  • How to Use the Finest Covered Call Strategy

    Investing in the stock market can be a great way to grow your wealth over time. However, it can also be a volatile and unpredictable place, with sudden swings in stock prices causing anxiety for even the most experienced investors. This is where the covered call strategy comes in - a popular options trading strategy that can help manage portfolio volatility.

    By Kim,

    • 0 comments
    • 857 views

  Report Article

We want to hear from you!


Guest Chris Butler

Posted

Just to be clear, the trades were tracked until the day before the front-month option's settlement date.

Share this comment


Link to comment
Share on other sites

Good insights, thanks for sharing.

If nothing else, it may speak to ideas on position sizing when VIX is in different ranges.  VIX at 17 and jumping around is not the best time for a full position, but VIX at 12 might have more potential.

Share this comment


Link to comment
Share on other sites
Guest Chris Butler

Posted

1 hour ago, Guest RobS said:

Good insights, thanks for sharing.

If nothing else, it may speak to ideas on position sizing when VIX is in different ranges.  VIX at 17 and jumping around is not the best time for a full position, but VIX at 12 might have more potential.


Thanks, Rob!

Agreed. When the VIX is really low, realized volatility typically is as well, resulting in a higher probability of the underlying remaining near your calendar strike. When the VIX is really high, historically calendars have actually performed well due to the inflation of front-month volatility. However, if the play is to sell inflated front-month vol and buy back-month vol, a "cleaner" trade can be made by utilizing VIX futures calendar spreads (sell near-term VX, buy next-term VX).

-Chris

Share this comment


Link to comment
Share on other sites
Guest hashworm

Posted

Hello Chris, thank you so much for this content. Would you mind elaborating more on this statement, "Additionally, these positions were not managed, which is the key to success when trading calendar spreads."?  This is because of the data shown on the loss frequency chart?

Share this comment


Link to comment
Share on other sites

Thank you for the interesting article.

Were there years in which the the calendar spreads have performed particularly worse than the average?

Share this comment


Link to comment
Share on other sites


Create an account or sign in to comment

You need to be a member in order to leave a comment

Create an account

Sign up for a new account. It's easy and free!


Register a new account

Sign in

Already have an account? Sign in here.


Sign In Now

Options Trading Blogs Expertido