SteadyOptions is an options trading forum where you can find solutions from top options traders. Join Us!

We’ve all been there… researching options strategies and unable to find the answers we’re looking for. SteadyOptions has your solution.

Selling Short Strangles and Straddles - Does it Work?


I have seen a lot of discussions on Twitter lately about the issue if selling naked strangles or straddles is a great strategy or a recipe for disaster. If you have read my books or if you are following my sample portfolio, you know that I'm a huge fan of selling short strangles and straddles.

But with undefined risk strategies comes theoretical unlimited risk. Therefore it is crucial that you follow the rules I pointed out in my books and which are mentioned about almost every day on tastytrade

Rules:

  • do not use more than 40 - 50% of your available capital on your overall portfolio
  • do not use more leverage than 3x notional of your net liq (if you have a $100k account, don't go over $300k notional)
  • manage at 21 DTE to avoid gamma risk
  • manage your strangles at 50% of max profit and your straddles at 25% of max profit.
  • spread your risk among lots of uncorrelated underlyings
  • commit capital based on IVR or the VIX (high VIX risk up to 50% on your overall portfolio, if VIX is low, risk less)

Now let's have a look at what you can expect in profit if you sell different type of strangles/straddles:


16 Delta Short Strangles:

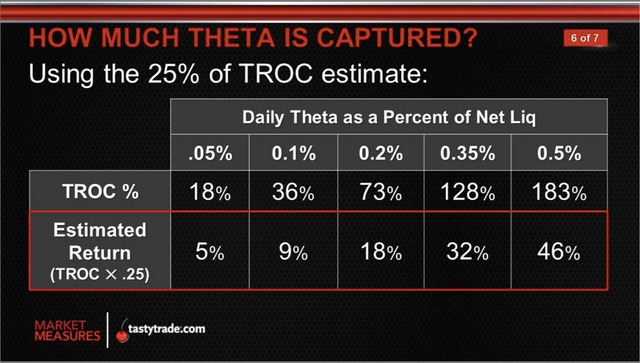
tastytrade has shown in a study that you can expect to keep 25% of the daily theta if you sell 16 delta short strangles in SPY, IWM and TLT.
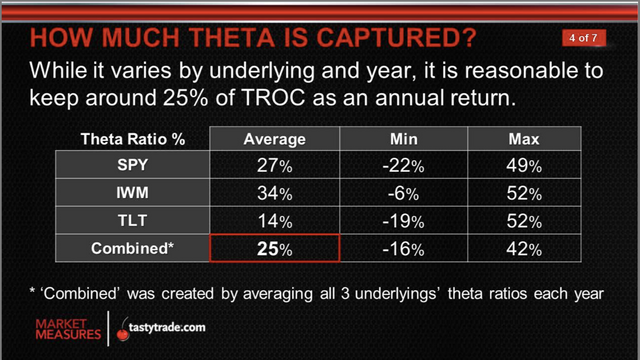

Screen Shot 2019-08-14 at 5.08.28 PM.png
Screen Shot 2019-08-14 at 5.09.37 PM.png

Image source: tastytrade


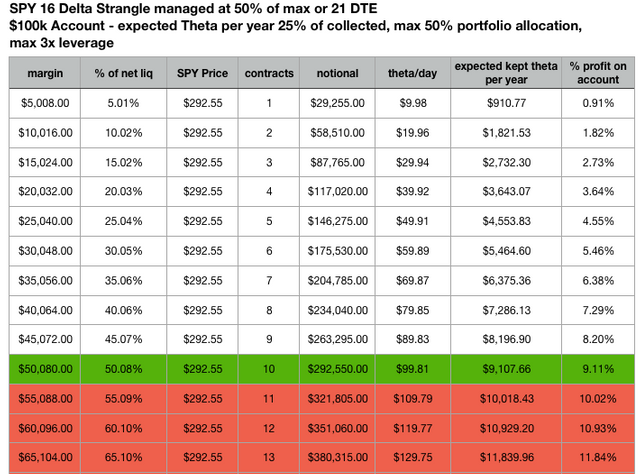
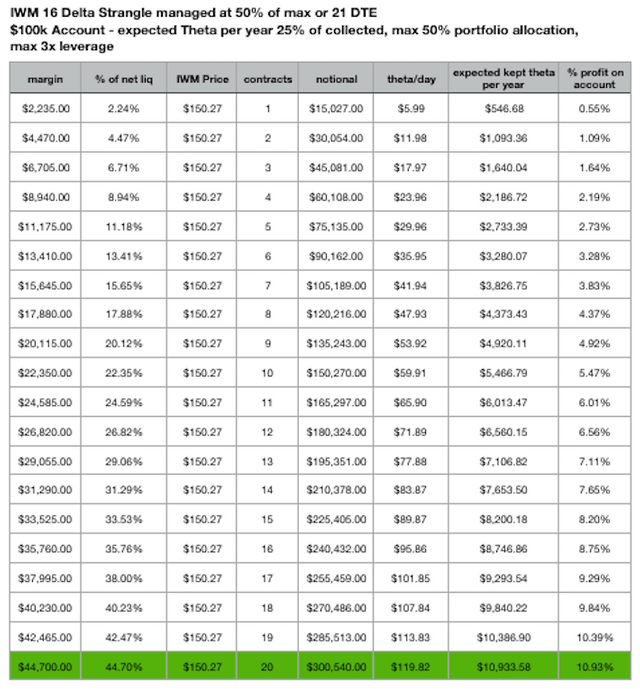
Let's have a look at how much contracts you could sell, until you exceed 50% of your capital in margin requirement and/or 3x notional leverage and how much money you would make in a full year.

For the study I was using August 13th 2019 closing prices. Although the percentage of theta you can expect to keep is higher than 25% in SPY and IWM, I was using the 25% number, to be more conservative.
 

SPY 16 Delta Strangles
SPY 16 Delta Strangle - Theta and Leverage.png


As you can see, if you just sell 16 delta short strangles in SPY, you can expect to make 9.11% in profit, if you go up to 3x notional leverage.


IWM 16 Delta Short Strangles
IWM 16 Delta Strangle - Theta and Leverage.png


As you can see, if you just sell 16 delta short strangles in IWM, you can expect to make 10.93% in profit, if you commit 50% of your buying power.
 

Now let's have a look at short straddles. 

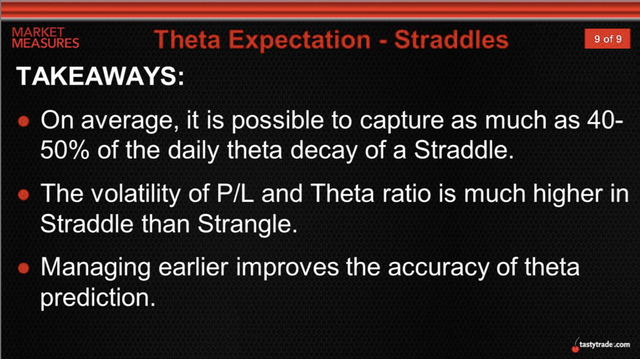
tastytrade has shown in a study that you can expect to keep 40-50 % of the daily theta if you sell atm short straddles in SPY.
 

Screen Shot 2019-08-14 at 5.28.27 PM.png

Image source: tastytrade


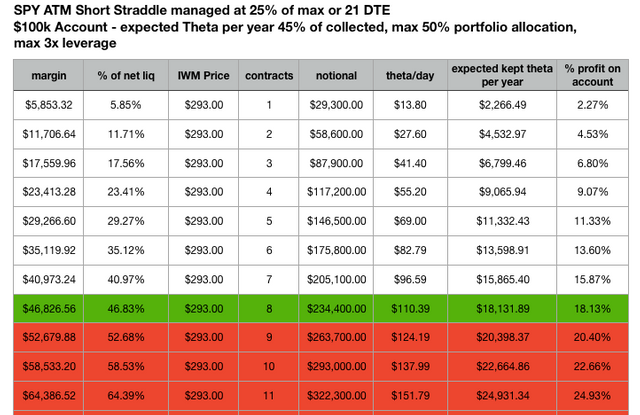
Let's have a look at how much contracts you could sell, until you exceed 50% of your capital in margin requirement and/or 3x notional leverage and how much money you would make in a full year.

For the study I was using August 13th 2019 closing prices.
For the daily theta you can expect to keep, I was using 45% as the tastytrade suggested.
 

SPY Short Straddles
SPY Short Straddle - Theta and Leverage.png


As you can see, if you just sell atm short straddles in SPY, you can expect to make 18.13% in profit, if you commit 46.83% of your buying power.


IWM Short Straddles
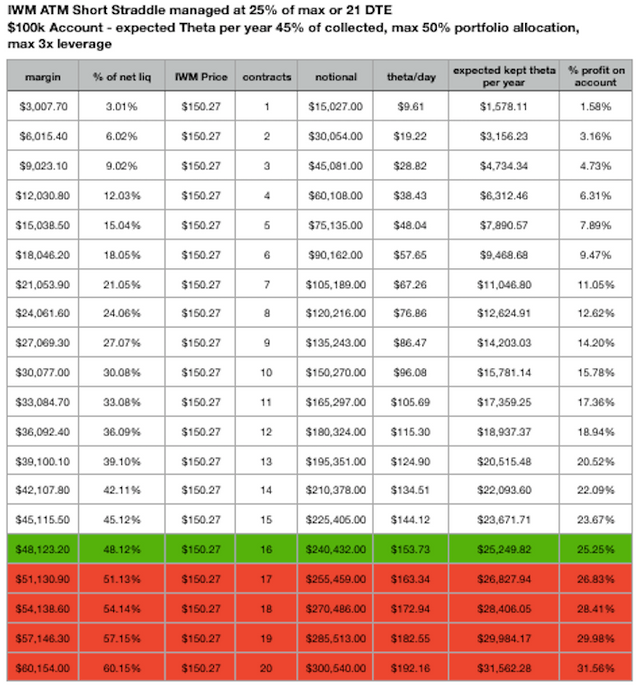
IWM Short Straddle - Theta and Leverage.png


As you can see, if you just sell atm short straddles in SPY, you can expect to make 25.25% in profit, if you commit 48.12% of your buying power.


Since we want to diversify our portfolio, let's have a look at the 5 most uncorrelated underlyings, which I showed in my first book.


For these examples I was using today's (August 14 2019) prices right at the open.


GLD Short Straddles
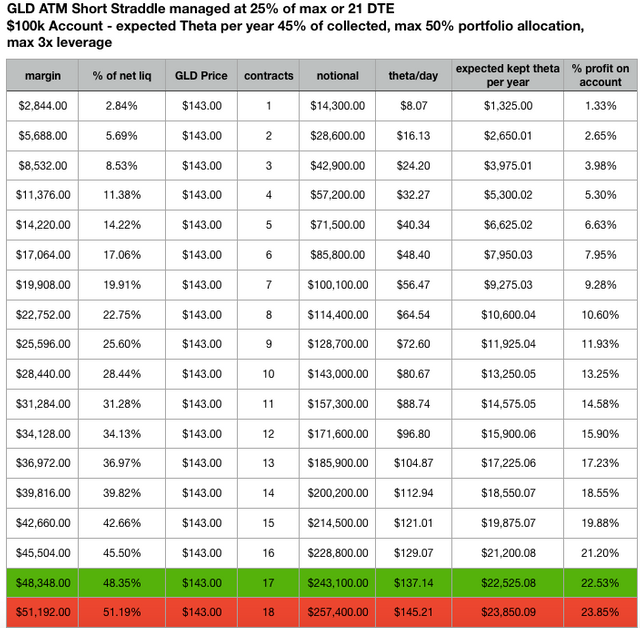
GLD.png


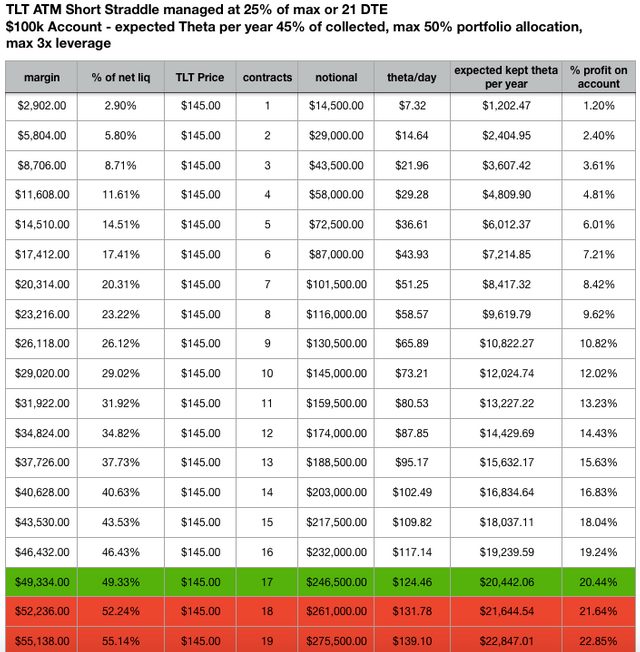
TLT Short Straddles

TLT.png


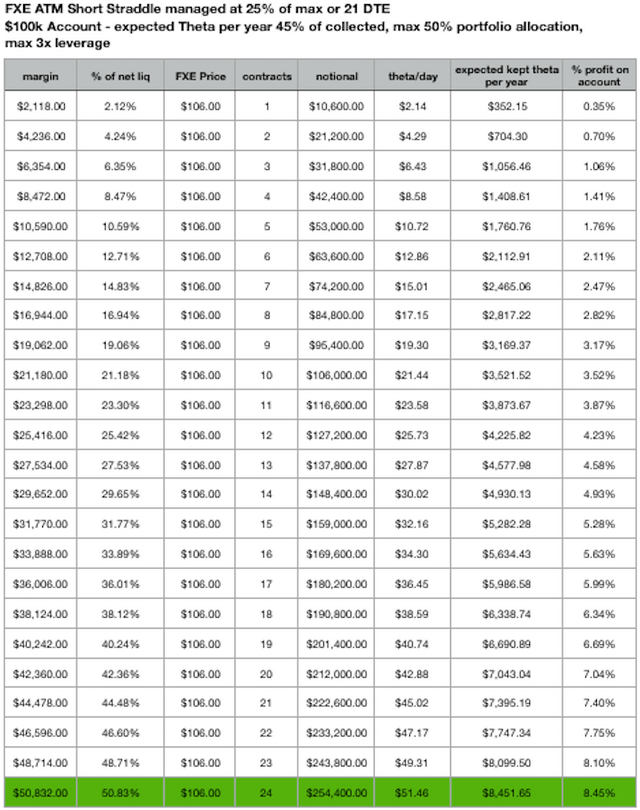
FXE Short Straddles

FXE.png


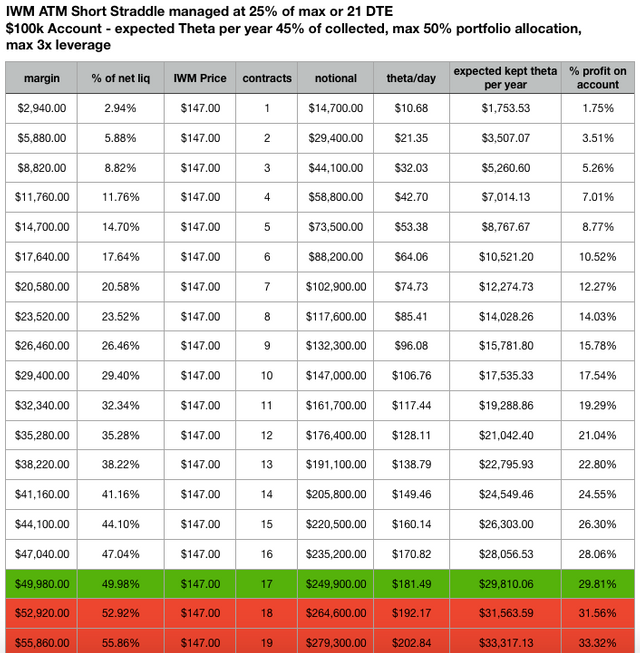
IWM Short Straddles

IWM.png


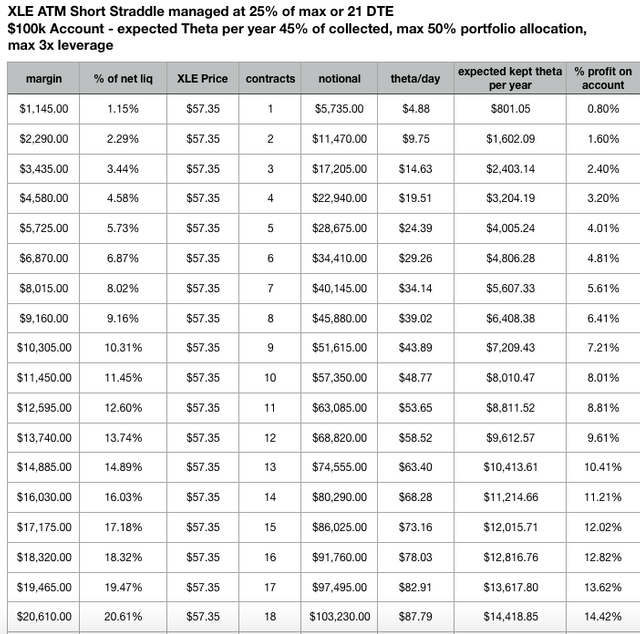
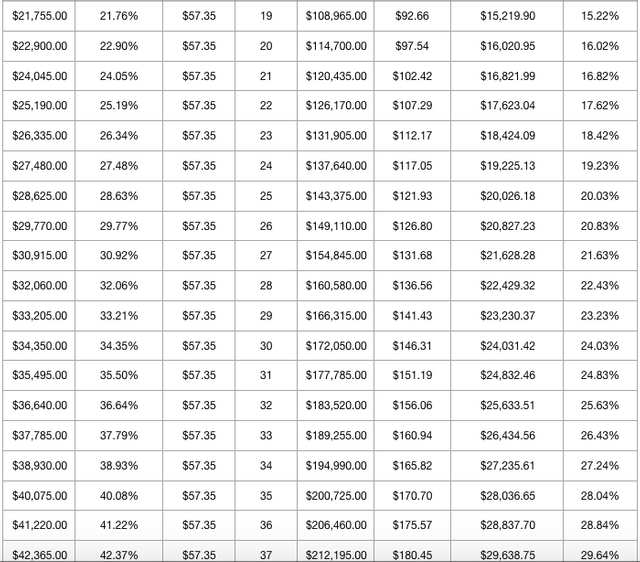
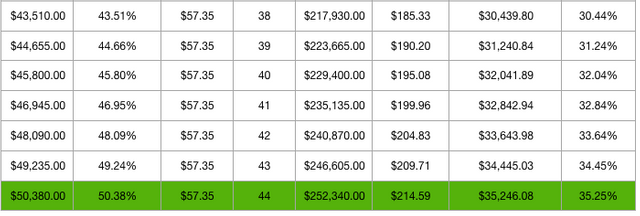
XLE Short Straddles

XLE 1.png
XLE 2.png
XLE 3.png


In the next article I will show you how to build a portfolio with these five underlyings and how to commit your capital based on the VIX, so that you don't get wiped out in a move we experience at the moment.

Stephan Haller is an author, teacher, options trader and public speaker with over 20 years of experience in the financial markets. Check out his trilogy on options trading here. This article is used here with permission and originally appeared here.

Image


What Is SteadyOptions?

12 Years CAGR of 127.5%

Full Trading Plan

Complete Portfolio Approach

Real-time trade sharing: entry, exit, and adjustments

Diversified Options Strategies

Exclusive Community Forum

Steady And Consistent Gains

High Quality Education

Risk Management, Portfolio Size

Performance based on real fills

Subscribe to SteadyOptions now and experience the full power of options trading!
Subscribe

Non-directional Options Strategies

10-15 trade Ideas Per Month

Targets 5-7% Monthly Net Return

Visit our Education Center

Recent Articles

Articles

  • Harnessing Monte Carlo Simulations for Options Trading: A Strategic Approach

    In the world of options trading, one of the greatest challenges is determining future price ranges with enough accuracy to structure profitable trades. One method traders can leverage to enhance these predictions is Monte Carlo simulations, a powerful statistical tool that allows for the projection of a stock or ETF's future price distribution based on historical data.

    By Romuald,

    • 1 comment
    • 4,562 views
  • Is There Such A Thing As Risk-Management Within Crypto Trading?

    Any trader looking to build reliable long-term wealth is best off avoiding cryptocurrency. At least, this is a message that the experts have been touting since crypto entered the trading sphere and, in many ways, they aren’t wrong. The volatile nature of cryptocurrencies alone places them very much in the red danger zone of high-risk investments.

    By Kim,

    • 0 comments
    • 1,371 views
  • Is There A ‘Free Lunch’ In Options?

    In olden times, alchemists would search for the philosopher’s stone, the material that would turn other materials into gold. Option traders likewise sometimes overtly, sometimes secretly hope to find that most elusive of all option positions: the risk free trade with guaranteed positive outcome:

    By TrustyJules,

    • 1 comment
    • 17,388 views
  • What Are Covered Calls And How Do They Work?

    A covered call is an options trading strategy where an investor holds a long position in an asset (most usually an equity) and sells call options on that same asset. This strategy can generate additional income from the premium received for selling the call options.

    By Kim,

    • 0 comments
    • 2,843 views
  • SPX Options vs. SPY Options: Which Should I Trade?

    Trading options on the S&P 500 is a popular way to make money on the index. There are several ways traders use this index, but two of the most popular are to trade options on SPX or SPY. One key difference between the two is that SPX options are based on the index, while SPY options are based on an exchange-traded fund (ETF) that tracks the index.

    By Mark Wolfinger,

    • 0 comments
    • 6,874 views
  • Yes, We Are Playing Not to Lose!

    There are many trading quotes from different traders/investors, but this one is one of my favorites: “In trading/investing it's not about how much you make, but how much you don't lose" - Bernard Baruch. At SteadyOptions, this has been one of our major goals in the last 12 years.

    By Kim,

    • 0 comments
    • 4,186 views
  • The Impact of Implied Volatility (IV) on Popular Options Trades

    You’ll often read that a given option trade is either vega positive (meaning that IV rising will help it and IV falling will hurt it) or vega negative (meaning IV falling will help and IV rising will hurt).   However, in fact many popular options spreads can be either vega positive or vega negative depending where where the stock price is relative to the spread strikes.  

    By Yowster,

    • 0 comments
    • 6,536 views
  • Please Follow Me Inside The Insiders

    The greatest joy in investing in options is when you are right on direction. It’s really hard to beat any return that is based on a correct options bet on the direction of a stock, which is why we spend much of our time poring over charts, historical analysis, Elliot waves, RSI and what not.

    By TrustyJules,

    • 0 comments
    • 3,802 views
  • Trading Earnings With Ratio Spread

    A 1x2 ratio spread with call options is created by selling one lower-strike call and buying two higher-strike calls. This strategy can be established for either a net credit or for a net debit, depending on the time to expiration, the percentage distance between the strike prices and the level of volatility.

    By TrustyJules,

    • 0 comments
    • 4,919 views
  • SteadyOptions 2023 - Year In Review

    2023 marks our 12th year as a public trading service. We closed 192 winners out of 282 trades (68.1% winning ratio). Our model portfolio produced 112.2% compounded gain on the whole account based on 10% allocation per trade. We had only one losing month and one essentially breakeven in 2023. 

    By Kim,

    • 0 comments
    • 9,439 views

  Report Article

We want to hear from you!


Thank you Stephan for the permission to re post the article.

I have few questions, but before I start the discussion, I would like to give our readers some background.

Stephan posted a response on Twitter to one of my tweets, and while we disagreed about the issue, I enjoyed having an intelligent and constructive discussion with him. I asked him to contribute to our blog so our readers can be exposed to different strategies, and we can also have a productive dialogue that can benefit everyone.

To clarify my general position: I'm not against options selling per se. I believe it can be a good strategy, and should be part of any well diversified options portfolio. My objection is to using options selling as an exclusive strategy, and to the claim by Tom Sosnoff that "selling premium is the only way to make money in the stock market". In addition, I warned few times against dangers of leverage when selling naked options. As I mentioned many times, strategy doesn't kill accounts. Leverage does.

Share this comment


Link to comment
Share on other sites

Now when we clarified this, I have few questions to @Stephan Haller

  1. In one of my previous articles, I calculated the expected annual return of selling 10 delta SPY puts and calls as 5-6%, using ~115% notional exposure (4 contracts per 100k portfolio). In your table, you show 3.64% annual return for the same exposure. So I guess my "non scientific" guess was actually a bit high, but in the same ballpark. Am I comparing apples to apples?
  2. The expected return for SPY straddles is almost triple. Is there any tradeoff to use straddles and get higher return? I assume the risk would be higher as well?
  3. What is your rationale for using maximum 3x notional? What would you say is the average leverage you use?
  4. Between 16 strangles and straddles, or anything in between, what would you say is the optimal deltas, in terms of risk/reward?

As a side note, I believe that notional is the best measure of portfolio exposure. Margin and buying power might differ from broker to broker, and also depends on what kind of account you have (portfolio margin will have much higher buying power). notional is based on the stock price, and therefore is fixed and easy to calculate.

Share this comment


Link to comment
Share on other sites

@Lazlo For the tastytrade study they were using 45 DTE.

My own data is not a study, it just shows how much theta the different strangles would give you per day on the day the article was written.
I was using August 13th 2019 closing prices.

Share this comment


Link to comment
Share on other sites

@Kim Tom Sosnoff is not saying that "selling premium is the only way to make money in the stock market.

They also do lot's of debit strategies.
But there is definitely a statistical edge in premium selling, which absolutely makes sense, since you are taking theoretical unlimited risk, but only get paid a defined premium. So in an efficient you have to have a statistical edge, otherwise nobody would sell options.
That does not mean, everyone will make money selling options, but in general and in the long term all the options sellers combined will make money, just like in general the casinos make money and the gamblers lose.
But of course there are numerous premium sellers who blow up and numerous option buyers who make lots of money.

I totally agree and everyone on tastytrade will agree, too, that it is too much leverage which kills.
That's why they always stress to trade small.


1. My theta numbers just show August 13 closing prices, so depending on IV and DTE you can get higher theta numbers or lower theta numbers.

2. You will make more money selling straddles in the long term, but you will have much higher portfolio volatility and lower break evens.
When you have to defend your straddles, you have to go inverted, which lots of people don't like.
The max loss if the market makes a big move will be a little bit bigger, but the difference is usually not too big.

3. If you trade equities or ETFs in a regular margin account using 50% of your buying power on strangles or 3x leverage is pretty much the same. I did a lot of backtesting for my books and came to the conclusion that 3x is the most reasonable number (as long as you are well diversified). Only looking at buying power reduction can be dangerous if you are trading wide credit spreads, iron condors or strangles on futures, since the buying power reduction is much lower than short strangles or stocks or ETFs.
Too much leverage kills, I learned it the hard way...
Besides that, my uncle was the manager of a small local bank. He always told me:
"Whatever you do business wise regarding using loans to create leverage, never go above 3x!"
He stuck to this rule during all his years. If you wanted a loan for a home, you had to put 1/3 of the home price down.
His bank always did well through all the decades stickig to this rule.

4. As I show in my first book, the 30 delta strangle is best from a risk reward perspective and has pretty much the same outcome as an atm straddle, but with less buying power reduction, when managed at 50% of max profit or 21 DTE, whatever happens first.
In my second book I introduced another profit target:
Close when your profit for 30 delta strangles or short straddles equals the 16 delta strangle credit at trade entry or 21 DTE.
Your win rate will be higher and your portfolio volatility lower.
So I'm using this dynamic profit target, instead of a static 50% profit target.

Share this comment


Link to comment
Share on other sites

Thank you.

So 3x leverage would be the maximum when IV is high. What would you say is the average? And with that average what would you expect the annual return to be for let's say SPY 30 delta strangles? Would diversifying to 5 underlyings change the expected return or just the expected volatility? 

Share this comment


Link to comment
Share on other sites

what about black swan events? when the diversifications doesnt work..event wich cause big-big moves the most of markets? I worry when I see unlimited risk..I know leverage is the key in those strategies but black swan events happened sometimes..and we cant predict when it will happen and the market moves how big will be..

Share this comment


Link to comment
Share on other sites

If he thinks that selling premium is the only way to make money, why would they bother buying calendar spreads or diagonals and do lots of studies on these strategies?
But I definitely agree with him, that premium selling should be your core strategy.


The average leverage would be around 1.5-2x.
Expected return around 16-18%.
Diversifying among 5 or more uncorrelated ETFs will reduce portfolio volatility, but won't change returns much.

Share this comment


Link to comment
Share on other sites
Just now, Stephan Haller said:

@Tamas in my other article I show how a well diversified short premium portfolio would have done during the recent sell off and vol expansion.

We will post it shortly. 

How would it perform during more severe market meltdowns, like September 2011 or February 2012, not to mention 2008?

Share this comment


Link to comment
Share on other sites
11 minutes ago, Stephan Haller said:

If he thinks that selling premium is the only way to make money, why would they bother buying calendar spreads or diagonals and do lots of studies on these strategies?
But I definitely agree with him, that premium selling should be your core strategy.


The average leverage would be around 1.5-2x.
Expected return around 16-18%.
Diversifying among 5 or more uncorrelated ETFs will reduce portfolio volatility, but won't change returns much.

You probably should listen to the podcast I linked. They also recommend holding naked strangles through earnings. And btw, calendars and diagonals are also considered options selling strategies. They have positive theta and negative gamma. 

Now in the tables you posted SPY return for 2x leverage was about 6% for 16 delta strangles and 15% for straddles. 30 delta strangles should be somewhere in between. So how do you expect 16-18% for 1.5-2x leverage? Something doesn't add up.

Share this comment


Link to comment
Share on other sites

Does he think positive theta strategies are in general the only option strategies which make money in the long term?
I think he does and so do I.

I know they sell strangles into earnings.
Nothing wrong with that, but they also say, that earnings plays don't have an edge.
It is just an engagement tool for them.
Personally I don't trade earnings or individual stocks.


Theta changes. Some times it is much higher than in the examples above, some times lower.All depending on IV.
The tables I posted are just an example (August 13 closing prices).
But with the leverage I told you and if you add put calendar spreads and/or classic put diagonals in low IV, like I show in my book, you will be able to create 0.1% of theta decay per day, of which you can keep 40-50% in short straddles or 30 delta short strangles.

Share this comment


Link to comment
Share on other sites

Usually IV goes up before something bad happens.
During these times I add short premium/short delta strategies like the aggressive short delta strangle.

They protected me well during August 2015.

They have numerous studies on tastytrade which show how short strangles performed in 2008.
Of course they lose money during these times, but so does any other strategy except trading directional and picking the right direction.

Share this comment


Link to comment
Share on other sites
25 minutes ago, Stephan Haller said:

Does he think positive theta strategies are in general the only option strategies which make money in the long term?
I think he does and so do I.

I know they sell strangles into earnings.
Nothing wrong with that, but they also say, that earnings plays don't have an edge.
It is just an engagement tool for them.
Personally I don't trade earnings or individual stocks.

Well, I think this is where we have the biggest disagreement.

In our SteadyOptions model portfolio, we sell premium too, but we balance our portfolio with different strategies, including long pre earnings straddles (buy premium, theta negative). Our pre earnings straddles delivered average return of 5-6%, with very short holding period (usually 5-10 days). We traded hundreds of them since inception, and yet tastytrade tried to prove again and again that this strategy doesn't work. Here is one example:

https://steadyoptions.com/articles/buying-premium-prior-to-earnings-does-it-work-r89/

Take a look and let me know how can we trust any of tastytrade studies after seeing this one.

Nothing wrong with selling strangles into earnings? I would disagree. Here is one example:

https://steadyoptions.com/articles/lessons-from-facebook-earnings-disaster-r398/

FB post earnings move in July 2018 wiped out a year of gains.

Does it have a statistical edge in the long term? Yes. But many traders might not survive into the long term if they get few big moves in a row.

Share this comment


Link to comment
Share on other sites

So in your opinion, what was the biggest issue with Karen (except for cheating on her clients and collecting millions in fees while they were losing money)? The way I see, three main issues:

  1. Not diversified enough (she traded SPX only if I remember?)
  2. Trading deltas too low (5-7 if I'm not mistaken) and collecting too little premium.
  3. THE ISSUE: Leverage. In my opinion, to get to 25-30% annual return as she advertised, she implemented at least 4-5x notional exposure. 

Share this comment


Link to comment
Share on other sites

Did you talk to them about their study?

Here is a very big study about buying atm straddles prior to earnings and closing them before the earnings announcement:
https://www.tastytrade.com/tt/shows/market-measures/episodes/buying-premium-before-earnings-04-26-2016

The study you mentioned I can't find at the moment.

They even have big winners in the study (AMZN, GOOGL, AAPL) but in general it was a losing strategy.
If you pick the right stock, you can absolutely make money, but to me picking the right stock is kind of a lottery.
There are people who won the lottery jackpot several times in their life.
There are people who win a coin toss 10 times in a row.
Are these people experts?
No, they are outliers.

If buying earnings straddles works for you and your customers, great.
Like I said before, I am not trading earnings.

If you have a very big account, there is nothing wrong with selling premium into earnings, if you stay very small.
For probably 99% of the people an iron condor would be the better option.
Since tastytrade has shown, that there is no edge in selling premium into earnings and since they are just using it as an engagement tool, I stay away from earnings trades.

If you don't trust the tastytrade studies, you don't have to follow these studies.
I did a lot of backtesting for myself (short strangles, short straddles, put calendars, naked calls, aggressive short delta strangles) before I wrote my books and came to the same results as tastytrade.
So I trust their studies.

Share this comment


Link to comment
Share on other sites

The study I mentioned, there is a link in my article. Here it is - https://www.youtube.com/watch?v=vuyDeFZEfdU

Yes, you definitely have to pick the right stocks. And you have to pick the right timing. And the right price. Some stocks work most of the cycles, but straddles become too expensive in certain cycle, so we don't trade them at that cycle. And you need to manage the trade.

You cannot just say "we buy straddles on ALL stocks 10 days before earnings and exit 0 days before earnings". It doesn't work that way, but this is exactly what they do. Time after time.

You can win lottery once or twice. I'm talking about hundreds live trades. This is as far as it gets from lottery.

And yes, I tried to contact them and post comments on those studies. No response, and all comments have been deleted. 

But maybe it's for better. Someone needs to be on the other side of our trades. This is why markets exist.


Share this comment


Link to comment
Share on other sites

@kim I don't know how much money Karen lost or if she blew up or not.
There is no public record.

But the studies I quote in my second book clearly show that your portfolio volatility is much lower when you sell 1 contract of a 32 delta strangle compared to 2 contracts of a 16 delta strangle.
If you do 2.5 delta strangles like Karen, you'd need 12 contracts. Your portfolio volatility can become pretty big with 12 contracts.
In a very big move your 2.5 delta pretty quick becomes a 50 delta or even worse and your margin requirement grows, maybe you even get a margin call. That's probably the reason why she readjusted when one of her deltas became bigger than 30.
But sometimes you get a big overnight move and can't readjust quickly enough.
So you always have to hedge with long /VX or short /ES, which in the long term eats a huge part of your profits.
I don't know if she did hedge.

In one of the interviews she told that her standard trade size is 500 contracts in SPX.
If I remember correctly, she had always strangles on in the back month and in the front month, so 1,000 contracts.

If she really blew up, it must have been because of excessive leverage.

But I really don't know what she traded and how she traded in her fund and what her leverage was.
She tried and failed. That happens all the time.
Most businesses fail, too.
It is not the end of the world.
Get back up and try again and learn from your mistakes.

If she cheated on her customers, that's another story.

But I don't know enough about the whole story and I honestly don't care.

Share this comment


Link to comment
Share on other sites

@kim if you want to do a scientific study, you have to pick a wide variety of stocks.
In efficient markets, there is no right stock and no right timing.
If you believe markets are random, you have to do it this way.
Otherwise it would be cherry picking.

Of course you can go back and pick the stocks which worked in the past, but it doesn't mean, that it'll work in the future.
Premium selling gives you an edge since fear in general is overpriced.


I don't doubt that you had success with this strategy in the past.
If it works for you, stick to it.

Did you write Tom or Tony?
Usually they respond to every email.

Tony even told you to call into the show.
Would be a great discussion...

Share this comment


Link to comment
Share on other sites


Okay. I guess we will have to disagree regarding Karen, our pre earnings straddles and tastytrade studies about those straddles.

Going back to your article, this is how I would summarize it:

  1. Selling SPY 16 delta strangles and ~1.15 (4 contracts) notional exposure would produce 3.64% annual return, August 13th 2019 closing prices. In the long term, the return is probably closer to 5-6%.
  2. Selling higher deltas would increase the return, but also the volatility of the portfolio. You can go to 50 deltas (straddles) and get around 9%, with the same exposure, but also much higher volatility. 30 deltas is the sweet spot, where you would probably get around 6-7%.

I suspect that most traders would not be very happy with those returns, so the way to increase them is to apply leverage. The big question is: how much? I believe that you can go as high as 3x, I think it's way too high. But even with 1.5x, and portfolio diversified beyond one underlying, it seems like a solid strategy.

Share this comment


Link to comment
Share on other sites
5 minutes ago, Stephan Haller said:

@kim if you want to do a scientific study, you have to pick a wide variety of stocks.
In efficient markets, there is no right stock and no right timing.
If you believe markets are random, you have to do it this way.
Otherwise it would be cherry picking.

Of course you can go back and pick the stocks which worked in the past, but it doesn't mean, that it'll work in the future.
Premium selling gives you an edge since fear in general is overpriced.


I don't doubt that you had success with this strategy in the past.
If it works for you, stick to it.

Did you write Tom or Tony?
Usually they respond to every email.

Tony even told you to call into the show.
Would be a great discussion...

Well, I guess we will let tastytrade to do their "scientific studies", and we will continue with live trading, proving those studies wrong time after time. Do you really believe in efficient markets? 

Just to put things in perspective: we do on average around 70 those straddles per year. Even if you did no other trades we do, and allocate 10% per trade, with 5% average return, your portfolio would be up 35% per year. Since they are such low risk, you could probably allocate even 12-15%.

Yes, premium selling gives you an edge, but it's also exposes you to big moves. Personally, I don't believe that you should have only gamma negative trades in your portfolio.

You mentioned "Of course they lose money during these times (2008), but so does any other strategy except trading directional and picking the right direction." - actually, those straddles would make a LOT of money during these times.

Share this comment


Link to comment
Share on other sites

@kim I don't think we disagree on Karen. Like I and you said, excessive leverage kills.

But since I don't know what and how she was trading in her fund, there is not much to say about it.

If you look at the numbers, you will see, that a short straddle in SPY with 1.46x leverage produces 11.33% if you take August 13 closing prices.
The 30 delta short strangle would give you the same numbers, since when you manage the 30 delta short strangle at 50% and the short straddle at 25% you get basically the same results, as I show in my first book.

The short straddle in IWM would give you 15.78% with 1.5x leverage (again August 13 closing prices).
At this rate you'd double your account every 4.5 years.
Which is not too bad.
You even can invest the rest of your portfolio in short term treasuries (and use them as collateral) and get some extra return.

Share this comment


Link to comment
Share on other sites

Yes, I do believe in efficient markets.

Of course in times when short straddles lose, long straddles win, but the question is, would you buy long straddles in times when premium is so rich as in 2008?

Unfortunately I don't have access to 2007/08 data to backtest it.

Hey, it's getting late over here in Germany.
Heading to bed now.

Share this comment


Link to comment
Share on other sites
9 minutes ago, Stephan Haller said:


The short straddle in IWM would give you 15.78% with 1.5x leverage (again August 13 closing prices).
At this rate you'd double your account every 4.5 years.
Which is not too bad.
You even can invest the rest of your portfolio in short term treasuries (and use them as collateral) and get some extra return.

Yes, IWM would provide higher return than SPY since it is more volatile and as a result, provides higher options premiums. I assume you would not put your whole portfolio into IWM, so the question is what is the expected return for your 5 non correlated instruments portfolio?

But let's leave it for the next article.

Share this comment


Link to comment
Share on other sites

Everything you guys are discussing can easily be backtested using ORATS wheel. Just tell me exactly what you want to see and I can easily put together a combined portfolio backtest from 2007-current. Or sign up for the free trial and do it yourself.


1. Symbols

2. Weighting in each product (can add up to more than 100% if you want to assume leverage)

3. Deltas of the short strikes

4. DTE

5. Exit DTE or profit percentage


The output will show just about every performance stat you could care to know. It's extremely well done and worth the money IMO.  


Share this comment


Link to comment
Share on other sites

I would like to see backtest for SPY and IWM, based on the rules in the article:

  1. Enter 45 DTE
  2. Exit on 50% of the credit or 21 DTE.
  3. Use 100% notional and 200% notional.

I know that the actual rules are a bit more complex, but lets keep it simple for now.

Share this comment


Link to comment
Share on other sites

I'm just working on a study:

IWM Short Straddles, 25% of max profit or 21 DTE.

2007 and 2008.

2007 is already finished:
- 92.3% win rate
- $117.85 average win per trade
- $1,532 profit per one lot
- only one loser $59.50 loss per one lot

Share this comment


Link to comment
Share on other sites
10 minutes ago, Stephan Haller said:

I'm just working on a study:

IWM Short Straddles, 25% of max profit or 21 DTE.

2007 and 2008.

2007 is already finished:
- 92.3% win rate
- $117.85 average win per trade
- $1,532 profit per one lot
- only one loser $59.50 loss per one lot

One lot meaning how much notional exposure?

I must say this is a REALLY surprising result. @Jessecan you please confirm it with ORATS? 

Share this comment


Link to comment
Share on other sites

IWM short straddle, 2007-current. 45 DTE entry, exit at 25% of max profit or 21 DTE...whichever happens first. 1x notional exposure, excess returns (no collateral yield included). Entries every 7 days to increase sample size and minimize skewed results from good/bad luck.


Stats:

Annual return: 6.69%

Annual volatility: 7.62%

Sharpe: 0.88

Best Year: 15.93%

Worst Year: -7.06%

Max drawdown: -18.58%

Win Rate: 71.8%

Average DIT: 21

Total trades: 656


I've done plenty of other backtests for both straddles and strangles, and this is in the ballpark of what I'd have expected.

Share this comment


Link to comment
Share on other sites
44 minutes ago, Stephan Haller said:

I'm just working on a study:

IWM Short Straddles, 25% of max profit or 21 DTE.

2007 and 2008.

2007 is already finished:
- 92.3% win rate
- $117.85 average win per trade
- $1,532 profit per one lot
- only one loser $59.50 loss per one lot

$117 average win and $1532 total profit means only 13 trades for the whole year. We can enter this trade every week nowadays. I guess it is because of the different in expiration availability? 

Share this comment


Link to comment
Share on other sites

@Kim @Jesse 2008 is finished:

- Win rate 84.6%
- average P/L per trade $47.31
- total profit per one lot $615
- biggest loss $959.50 per one lot

But I did this study manually.
I just started a trade in the first trading day of 2007 and then closed when 25% of max profit was reached or at 21 DTE.
I immediately put on a new one after closing.
Always 45-60 DTE.
I was only using regular expiration.

Share this comment


Link to comment
Share on other sites
3 minutes ago, Stephan Haller said:

@Sam Chen I never trade weekly options. Just regular expirations around 45 DTE.

@Stephan Haller I see. I am just a bit surprised that the total number of trade is so small within a year. In case I am wrong, what is the number of trade that is taken in your backtest?

I believe in the year of 2007 and 2008 this strategy beats the SPY return. I am curious to see if this is still the case when SPY has a very good return. For example, SPY has 29.6% return for the year of 2013.

Share this comment


Link to comment
Share on other sites

@Sam Chen

Well, when you start out 45 - 60 DTE and close at 21 DTE, there aren't more trades possible.

If have done studies from 2012 - 2017 for my books.
GLD, IWM, TLT, XLE.

In IWM short straddles in 2013 you would have made $746.50 per one lot.

In GLD you would have lost $1,285 per one lot.

In TLT you would have made $567 per one lot.

In XLE you would have made $465.50 per one lot.

But if you adjust every underlying for buying power reduction/notional you would have made $3,767 combined.

Share this comment


Link to comment
Share on other sites

It looks good for the year 2008 but just checked for the last 12 months it does not look very good just selling shorts


image.png

Share this comment


Link to comment
Share on other sites
46 minutes ago, Stephan Haller said:

@Sam Chen

Well, when you start out 45 - 60 DTE and close at 21 DTE, there aren't more trades possible.

If have done studies from 2012 - 2017 for my books.
GLD, IWM, TLT, XLE.

In IWM short straddles in 2013 you would have made $746.50 per one lot.

In GLD you would have lost $1,285 per one lot.

In TLT you would have made $567 per one lot.

In XLE you would have made $465.50 per one lot.

But if you adjust every underlying for buying power reduction/notional you would have made $3,767 combined.

$3,767 total for 2012-2017? When you say "Adjust for buying power", that means equal notional per underlying? What is the total notional?

Share this comment


Link to comment
Share on other sites
2 hours ago, Jesse said:

IWM short straddle, 2007-current. 45 DTE entry, exit at 25% of max profit or 21 DTE...whichever happens first. 1x notional exposure, excess returns (no collateral yield included). Entries every 7 days to increase sample size and minimize skewed results from good/bad luck.


Stats:

Annual return: 6.69%

Annual volatility: 7.62%

Sharpe: 0.88

Best Year: 15.93%

Worst Year: -7.06%

Max drawdown: -18.58%

Win Rate: 71.8%

Average DIT: 21

Total trades: 656


I've done plenty of other backtests for both straddles and strangles, and this is in the ballpark of what I'd have expected.

Thank you @Jesse

What would happen to annual volatility and max drawdown if you increase the leverage to 2x? 3x? And what was the result for 2018? Can you confirm it was positive?

Share this comment


Link to comment
Share on other sites

@Kim I adjusted for buying power, when I did the study.

3 contracts IWM, 1 and later in the year 2 contracts in GLD, 2 contracts in TLT, 3 contracts in XLE.

Share this comment


Link to comment
Share on other sites
7 minutes ago, Jesse said:

Here's the results of the IWM backtest I did using ORATS Wheel:


IWM.thumb.png.455080bafaec6f029cde69fe552d917b.png


1x leverage? 

Share this comment


Link to comment
Share on other sites
1 hour ago, Jesse said:

Here's the results of the IWM backtest I did using ORATS Wheel:


IWM.thumb.png.455080bafaec6f029cde69fe552d917b.png


Very good output of the return output. What are the other benefits of ORATS vs. CMLViz. CMLViz looks like to be quite fast but no so real customizable. Am I right? What is the pricing of ORATs?

Share this comment


Link to comment
Share on other sites
26 minutes ago, Jesse said:

Yes

What happens when you increase leverage to 2x, in terms of Annual return, volatility, Max drawdown etc.?


Share this comment


Link to comment
Share on other sites
1 hour ago, Kim said:

What happens when you increase leverage to 2x, in terms of Annual return, volatility, Max drawdown etc.?


All the stats simply double since the backtest is excess returns only where no collateral yield is included.


The same backtest on SPY:


1844222879_SPYstraddlestats.thumb.png.d0b6629548e7e41bf0ea90960331f1d7.png


2026949466_SPYstraddlemonthly.thumb.png.13c17e55e5fb5fbce145a00a90c21b0e.png


Again, anyone can knock themselves out performing these backtests themselves with ORATS Wheel on just about any ticker that exists as well as combined portfolio backtests. I can't imagine why anyone would perform manual backtests anymore when this tool is available at a reasonable cost. I have no affiliation with ORATS, just believe it's a great tool. Free trial: https://info.orats.com/free-trial


It should be noted that there is nothing magical about these specific parameters (45 dte entry, 21 dte exits). If you run a bunch of your own backtests with the wheel, you'll find that sometimes these parameters help performance, sometimes it hurts (vs. a more standard 30 dte trade that is held until or close to expiration). Less days in trade and exits farther away from expiration without a doubt reduce gamma, but that's not a free lunch...At times, this creates whipsaws and can significantly underperform other parameters. Diversifying not only underlying products, but also parameters, is wise IMO. Backtests are useful to draw broad conclusions, but it's dangerous to overinterpret the results. Plenty of academics and practitioners have shown how optimization of past parameters has minimal, if any at all, forward looking predictive value.


Share this comment


Link to comment
Share on other sites

I know this article.

Why should tastytrade promote strategies that don't work?

I never traded 16 delta strangles, but I know that 30 delta and short straddles work.

Check out the free trial of the software and backtest it for yourself.

Share this comment


Link to comment
Share on other sites
1 hour ago, Stephan Haller said:

@Jesse I will definitely try this software.
 

Do you use the basic or the pro version?


Basic does everything I need to do. You can test any symbol you want, just about any strategy you can think of, and can combine backtests into a portfolio. 

Share this comment


Link to comment
Share on other sites
On 8/20/2019 at 7:31 PM, Jesse said:

Here's the results of the IWM backtest I did using ORATS Wheel:


IWM.thumb.png.455080bafaec6f029cde69fe552d917b.png


Can you please do a combined testing, too. E.g. 60% SPY 40% TLT. From their announcement orats added that feature this year for pro only.

thank you.

Share this comment


Link to comment
Share on other sites
On 8/19/2019 at 4:49 PM, Jesse said:

Everything you guys are discussing can easily be backtested using ORATS wheel. Just tell me exactly what you want to see and I can easily put together a combined portfolio backtest from 2007-current. Or sign up for the free trial and do it yourself.


1. Symbols

2. Weighting in each product (can add up to more than 100% if you want to assume leverage)

3. Deltas of the short strikes

4. DTE

5. Exit DTE or profit percentage


The output will show just about every performance stat you could care to know. It's extremely well done and worth the money IMO.  


Hi Jesse

Thank you for your backtesting on orats. Orats does offer the portfolio testing only with the pro version as i experienced on the trial.

The posted link below on the studies shines new light on the iron condors in my humble opinion.

Could you please do a backtesting  with a mixed portfolio result for spx, gld and tlt (60, 20, 20 %) on

- strangles with the 30 delta 45 dte exit at 35% or 21 dte

and compare it with

- iron condor 66 dte, 20 delta, 20 point wide, exit on 60% loss, 90% gain or 8 dte

thank you


Share this comment


Link to comment
Share on other sites
3 hours ago, urfiend said:


Hi Jesse

Thank you for your backtesting on orats. Orats does offer the portfolio testing only with the pro version as i experienced on the trial.

The posted link below on the studies shines new light on the iron condors in my humble opinion.

Could you please do a backtesting  with a mixed portfolio result for spx, gld and tlt (60, 20, 20 %) on

- strangles with the 30 delta 45 dte exit at 35% or 21 dte

and compare it with

- iron condor 66 dte, 20 delta, 20 point wide, exit on 60% loss, 90% gain or 8 dte

thank you


What did you learn from the link that shines new light on iron condors?

Share this comment


Link to comment
Share on other sites
On 8/21/2019 at 12:22 PM, Jesse said:


All the stats simply double since the backtest is excess returns only where no collateral yield is included.


The same backtest on SPY:


1844222879_SPYstraddlestats.thumb.png.d0b6629548e7e41bf0ea90960331f1d7.png


So basically when applying 2x leverage, the drawdown increases to ~35-36%. If you follow @Stephan Hallerrules and go up to 3x leverage at high volatility environment, the drawdown becomes around 55%. 

Now, remember that the backtesting is based on mid prices. With increased volatility, spreads become very wide - good luck to be filled anywhere close to the mid. Realistically speaking, I think with 3x leverage you will be lucky with 60-70% drawdown. If you don't get a margin call before.

Things always look very easy on paper - till you actually live through one of those 2008 like periods. Then people learn the hard way.

Share this comment


Link to comment
Share on other sites

I traded through the August 2015 crash.

When Monday 24 2015 happened I was pretty much 3x leveraged, but since IVR went above 50 the week before, I added short delta/short premium positions, as I always do.

Markets were almost untradeable on Monday 24th, but my losses weren’t bad at all and my short deltas protected me pretty well. No margin issues at all, not even close.

It was one of my best months ever and 2015 was by far the best year of my trading career.

Share this comment


Link to comment
Share on other sites
1 hour ago, Stephan Haller said:

I traded through the August 2015 crash.

When Monday 24 2015 happened I was pretty much 3x leveraged, but since IVR went above 50 the week before, I added short delta/short premium positions, as I always do.

Markets were almost untradeable on Monday 24th, but my losses weren’t bad at all and my short deltas protected me pretty well. No margin issues at all, not even close.

It was one of my best months ever and 2015 was by far the best year of my trading career.

Accidentally 2015 was our best year too.

But I don't think it's fair to compare 2015 brief 10% correct with 2017-2019 crisis that lasted around 18 months and had a 50% drawdown. really not apples to apples comparison.

Share this comment


Link to comment
Share on other sites
On 8/23/2019 at 2:46 PM, Kim said:

What did you learn from the link that shines new light on iron condors?

From 2007 to 2014 he showed impressive results with 20 delta 20 point wide ic on the rut.

std meaning equal wide, equal contracts on both sides.

0.6/0.9 meaning exit on 60% loss of initial credit and 90% profit of initial credit.

From my testing one should be able to reduce losses and increase win rates by rolling the untested side up/down.

Furthermore I would like to know if there is an earlier exit window on dte e.g. around 30-40 dte where we could earn more per day with less days in the trade.

https://dtr-trading.blogspot.com/2015/05/which-iron-condor-options-strategy-is.html#comment-form

https://1.bp.blogspot.com/-6RL9uONuJW0/VU_T5A-ZSjI/AAAAAAAACBY/SD2LHAqQsfk/s1600/TopReturns.pngTopReturns.png

Share this comment


Link to comment
Share on other sites

Generally speaking, it's a well known fact that IV on indexes is inflated on average and higher than HV, so selling options on indexes is historically a winning proposition. This is why iron condors or short straddles/strangles will win in a long term. We covered it many times on our blog.

There is also nothing new about the fact the lower deltas means higher winning ratio, but also lower return per trade and high drawdowns. Again, we mentioned it many times on the forum and the blog.

As for "rolling", "adjusting" or whatever fancy name you want to call it - this is nothing else than closing the existing trade and opening a new one. Nothing magical about it. I believe that @Jessedid a lot of backtesting and came to conclusion that in many cases, a "no touch" trade with pre defined exit criteria is better most of the time than starting messing with the trade.

Also, hey mention 90% profit of initial credit, compared to 50% that tastytrade recommends. Again, nothing magical about 50% or 90% - as long as you exit early to reduce the gamma risk, the results will be very similar.

Share this comment


Link to comment
Share on other sites

What if one applies a volatility filter and only sells strangles when IV is > 89th percentile.  I realize the number of trades will go way down, but do the returns on margin improve?  Also, what about holding until expiration as opposed to closing early to avoid gamma risk?  Just wonder if the accelerated theta decay could offset the gamma risk and besides as long as the option remains OTM the gamma risk shouldn't be an issue as long as excessive leverage isn't in play.  

Share this comment


Link to comment
Share on other sites


Create an account or sign in to comment

You need to be a member in order to leave a comment

Create an account

Sign up for a new account. It's easy and free!


Register a new account

Sign in

Already have an account? Sign in here.


Sign In Now

Options Trading Blogs