SteadyOptions is an options trading forum where you can find solutions from top options traders. Join Us!

We’ve all been there… researching options strategies and unable to find the answers we’re looking for. SteadyOptions has your solution.

Powerful Channel Signal – Combining Bollinger and T-line


Technicians tend to focus on single indicators, such as Bollinger Bands or the t-line. These are used to attempt to perfect a timing system. Individually, each signal has merit. Combined, the reversal signal is exceptionally strong.

To review: Bollinger Bands has three averages. The middle band is a 20-period simple moving average. The upper band and lower band are the second and third parts. Each are two standard deviations away from the middle band. This is a visual summary of historical volatility. Price generally is not likely to trade above the upper band or below the lower band for very long. When price does move outside of these ranges, it retreats back into range very quickly. So BB is like a “probability matrix” for timing entry and exit.


The T-line is an 8-day exponential moving average of price that yields surprisingly reliable signals for changes in price direction. The rule is that when price is above the t-line, it remains bullish until it crosses below and closes for at least two sessions. This sets up a bearish reversal. When price is below the t-line, the prevailing bearish trend continues until price crosses above and closes above for at least two consecutive sessions.


Taken apart, BB and the t-line are powerful on their own. However, when used in combination, you set up a very powerful dynamic trading range, making it easy to spot when a trend ends. As price advance, the BB upper band represents resistance and the t-line is support. When prices are moving down, the t-line is resistance and the BB lower band is support.


The chart for Cummins (CMI) shows the reversal signals this combination highlights.


image.png


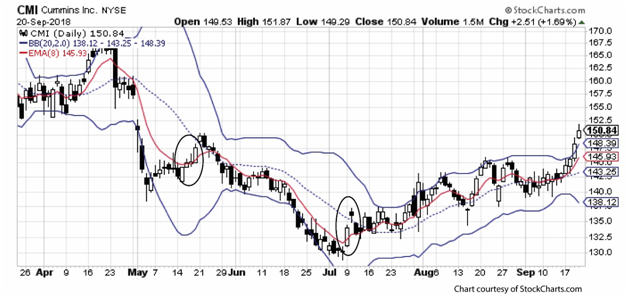
The combined signal sets up the narrow channel based on whether price trend is bullish or bearish. In a bullish trend, the upper Bollinger Band is rising resistance and the t-line (red on the chart) is rising support. The bullish trend continues until price crosses below the t-line and closes there for two consecutive sessions.


In a bearish trend, the t-line represents declining resistance and the lower Bollinger Band is declining support. The bearish trend continues until price crosses above the t-line and closes above for two consecutive sessions.


The CMI chart shows how this works. In May, price had been declining down to as low as $140 per share. But at mid-month, price crossed above the t-line (the red line), demonstrating that the downtrend, for the moment at least, was ending.


At the beginning of July, a further decline ended when price again moved across the t-line and marked the beginning of a gradual advance.


The combination of Bollinger Bands and t-line is so reliable that it can be used effectively in two ways. First, it distinguishes between retracement (not moving across the t-line) and reversal. Second, actual crossover is the signal point for leaving a current trade and taking profits, or for entering a new trend based on the newly revised price direction.


This solves the most disturbing aspect of short-term options trading. When do you enter and exit a trade? Even with the lack of clear reversal signals, the combined use of BB and the t-line is a powerful and reliable system to improve timing.

Michael C. Thomsett is a widely published author with over 80 business and investing books, including the best-selling Getting Started in Options, coming out in its 10th edition later this year. He also wrote the recently released The Mathematics of Options. Thomsett is a frequent speaker at trade shows and blogs on his website at Thomsett Guide as well as on Seeking Alpha, LinkedIn, Twitter and Facebook.

What Is SteadyOptions?

Full Trading Plan

Complete Portfolio Approach

Real-time trade sharing: entry, exit, and adjustments

Diversified Options Strategies

Exclusive Community Forum

Steady And Consistent Gains

High Quality Education

Risk Management, Portfolio Size

Performance based on real fills

Subscribe to SteadyOptions now and experience the full power of options trading!
Subscribe

Non-directional Options Strategies

10-15 trade Ideas Per Month

Targets 5-7% Monthly Net Return

Visit our Education Center

Recent Articles

Articles

  • SPX Options vs. SPY Options: Which Should I Trade?

    Trading options on the S&P 500 is a popular way to make money on the index. There are several ways traders use this index, but two of the most popular are to trade options on SPX or SPY. One key difference between the two is that SPX options are based on the index, while SPY options are based on an exchange-traded fund (ETF) that tracks the index.

    By Mark Wolfinger,

    • 0 comments
    • 256 views
  • Yes, We Are Playing Not to Lose!

    There are many trading quotes from different traders/investors, but this one is one of my favorites: “In trading/investing it's not about how much you make, but how much you don't lose" - Bernard Baruch. At SteadyOptions, this has been one of our major goals in the last 12 years.

    By Kim,

    • 0 comments
    • 652 views
  • The Impact of Implied Volatility (IV) on Popular Options Trades

    You’ll often read that a given option trade is either vega positive (meaning that IV rising will help it and IV falling will hurt it) or vega negative (meaning IV falling will help and IV rising will hurt).   However, in fact many popular options spreads can be either vega positive or vega negative depending where where the stock price is relative to the spread strikes.  

    By Yowster,

    • 0 comments
    • 483 views
  • Please Follow Me Inside The Insiders

    The greatest joy in investing in options is when you are right on direction. It’s really hard to beat any return that is based on a correct options bet on the direction of a stock, which is why we spend much of our time poring over charts, historical analysis, Elliot waves, RSI and what not.

    By TrustyJules,

    • 0 comments
    • 307 views
  • Trading Earnings With Ratio Spread

    A 1x2 ratio spread with call options is created by selling one lower-strike call and buying two higher-strike calls. This strategy can be established for either a net credit or for a net debit, depending on the time to expiration, the percentage distance between the strike prices and the level of volatility.

    By TrustyJules,

    • 0 comments
    • 1,346 views
  • SteadyOptions 2023 - Year In Review

    2023 marks our 12th year as a public trading service. We closed 192 winners out of 282 trades (68.1% winning ratio). Our model portfolio produced 112.2% compounded gain on the whole account based on 10% allocation per trade. We had only one losing month and one essentially breakeven in 2023. 

    By Kim,

    • 0 comments
    • 5,713 views
  • Call And Put Backspreads Options Strategies

    A backspread is very bullish or very bearish strategy used to trade direction; ie a trader is betting that a stock will move quickly in one direction. Call Backspreads are used for trading up moves; put backspreads for down moves.

    By Chris Young,

    • 0 comments
    • 9,308 views
  • Long Put Option Strategy

    A long put option strategy is the purchase of a put option in the expectation of the underlying stock falling. It is Delta negative, Vega positive and Theta negative strategy. A long put is a single-leg, risk-defined, bearish options strategy. Buying a put option is a levered alternative to selling shares of stock short.

    By Chris Young,

    • 0 comments
    • 10,951 views
  • Long Call Option Strategy

    A long call option strategy is the purchase of a call option in the expectation of the underlying stock rising. It is Delta positive, Vega positive and Theta negative strategy. A long call is a single-leg, risk-defined, bullish options strategy. Buying a call option is a levered alternative to buying shares of stock.

    By Chris Young,

    • 0 comments
    • 11,316 views
  • What Is Delta Hedging?

    Delta hedging is an investing strategy that combines the purchase or sale of an option as well as an offsetting transaction in the underlying asset to reduce the risk of a directional move in the price of the option. When a position is delta-neutral, it will not rise or fall in value when the value of the underlying asset stays within certain bounds. 

    By Kim,

    • 0 comments
    • 9,484 views

  Report Article

We want to hear from you!


There are no comments to display.


Create an account or sign in to comment

You need to be a member in order to leave a comment

Create an account

Sign up for a new account. It's easy and free!


Register a new account

Sign in

Already have an account? Sign in here.


Sign In Now

Options Trading Blogs