SteadyOptions is an options trading forum where you can find solutions from top options traders. Join Us!

We’ve all been there… researching options strategies and unable to find the answers we’re looking for. SteadyOptions has your solution.

Microsoft Pre-earnings Momentum Trade


Microsoft has earnings due out on October 26th, 2017, after the market close, according to Wall Street Horizon. 7-days before then would be October 19th, 2017. Microsoft is the forgotten mega tech -- the third largest company in the world behind Apple and Alphabet, but it doesn't fall into any fun Acronyms, like FANG, or FAANG. 

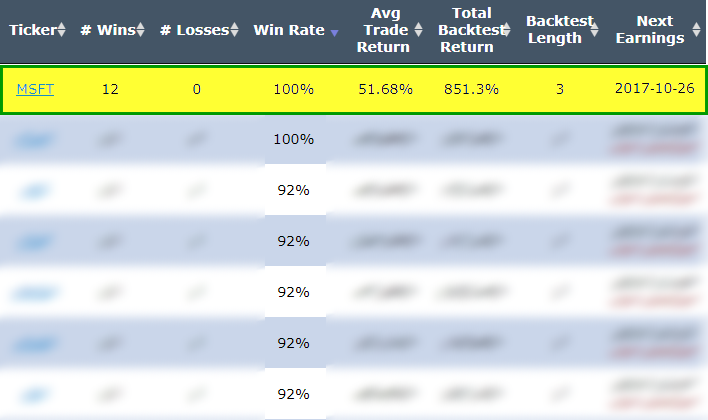
But, this pre-earnings momentum back-test is unlike any other in that it is the only one, out of more than 4,000 scans, that has never lost over the last three-years. (This does not mean it deserves extra risk capital or that it is somehow infallible, but, we are sharing a fact.) Here we go. 

PREFACE 
There is a bullish momentum trading pattern in Microsoft Corporation (NASDAQ:MSFT) stock 7 calendar days before earnings,
and we can capture that phenomenon explicitly by looking at returns in the option market. The strategy won't work forever, but for now it is a momentum play that has not only returned 851.3%, but has also shown a win-rate of 100% over the last three-years. 

LOGIC 
The logic behind the test is easy to understand -- in a bull market there can be a stock rise ahead of earnings on optimism, or upward momentum, that sets in the one-week before an earnings date. Now we can see it in Microsoft Corporation. 

The Bullish Option Trade Before Earnings in Microsoft Corporation 
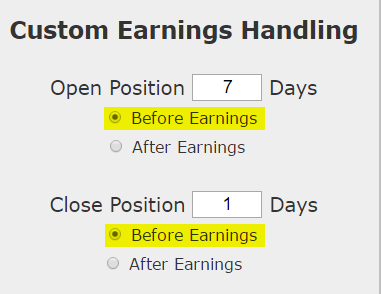
We will examine the outcome of getting long a weekly call option in Microsoft Corporation 7-days before earnings (using calendar days) and selling the call before the earnings announcement. 

Here's the set-up in great clarity; again, note that the trade closes before earnings, so this trade does not make a bet on the earnings result. 
setup_7_1_earnings.png


RISK MANAGEMENT 
We can add another layer of risk management to the back-test by instituting and 40% stop loss and a 40% limit gain. Here is that setting: 
 

setup_4040_limit.png


In English, at the close of each trading day we check to see if the long option is either up or down 40% relative to the open price. If it was, the trade was closed. 

Discovery 
We found this pattern by using the TradeMachine™ Pro scanner, searching for stocks that show bullish momentum 7-days before earnings. Here are the top results in the entire market over the last 3-years: 
 

MSFTscanres_92917.png


RESULTS 
Here are the results over the last three-years in Microsoft Corporation: 
 

MSFT: Long 40 Delta Call
 
% Wins: 100%
 
Wins: 12   Losses: 0
 
% Return:  851.3% 

Tap Here to See the Back-test


We see a 851.3% return, testing this over the last 12 earnings dates in Microsoft Corporation. That's a total of just 72 days (6-days for each earnings date, over 12 earnings dates). This has been the results of following the trend of bullish sentiment into earnings while avoiding the actual earnings result. 

This is not a magic bullet, even though it looks so good, there are no guarantees in the market. This is simply a bullish strategy. In the short-term it hasn't seen any losses, but more importantly, whether or not it loses on any given earnings run-up, the 851.3%  return in less than three-full months of trading is predicated on an idea of consistent momentum. 

The trade will lose sometimes, but over the most recent trading history, this momentum and optimism options trade has won ahead of earnings.

Setting Expectations 
While this strategy had an overall return of 851.3%, the trade details keep us in bounds with expectations: 
      ➡ The average percent return per trade was 51.68% over each six-day period. 

Back-testing More Time Periods in Microsoft Corporation 
Now we can look at just the last year as well: 
 

MSFT: Long 40 Delta Call
 
% Wins: 100%
 
Wins: 4   Losses: 0
 
% Return:  230.1% 

Tap Here to See the Back-test


We're now looking at 230.1% returns, on 4 winning trades and 0 losing trades. It's worth noting again that we are only talking about one-week of trading for each earnings release, so this is 230.1% in just 4-weeks of total trading. 
      ➡ The average percent return over the last year per trade was 53.93% over six-days, remarkably similar to the 51.68% average return over the last three-years. 

WHAT HAPPENED 
Bull markets tend to create optimism, whether it's deserved or not. To see how to test this for any stock we welcome you to watch this quick demonstration video: 

Tap Here to See the Tools at Work

Risk Disclosure 
You should read the Characteristics and Risks of Standardized Options

Past performance is not an indication of future results. 

Trading futures and options involves the risk of loss. Please consider carefully whether futures or options are appropriate to your financial situation. Only risk capital should be used when trading futures or options. Investors could lose more than their initial investment. 

Past results are not necessarily indicative of future results. The risk of loss in trading can be substantial, carefully consider the inherent risks of such an investment in light of your financial condition.

What Is SteadyOptions?

12 Years CAGR of 129.0%

Full Trading Plan

Complete Portfolio Approach

Real-time trade sharing: entry, exit, and adjustments

Diversified Options Strategies

Exclusive Community Forum

Steady And Consistent Gains

High Quality Education

Risk Management, Portfolio Size

Performance based on real fills

Subscribe to SteadyOptions now and experience the full power of options trading!
Subscribe

Non-directional Options Strategies

10-15 trade Ideas Per Month

Targets 5-7% Monthly Net Return

Visit our Education Center

Recent Articles

Articles

  • Predicting Probabilities in Options Trading: A Deep Dive into Advanced Methods

    In options trading, the focus should not be on predicting the exact closing price of a ticker on a given date - a near-impossible task given the pseudo-random nature of markets. Instead, we aim to estimate probabilities: the likelihood of a ticker being above a specific value at a certain point in time. This perspective turns trading into a probabilistic exercise, leveraging historical data to make informed decisions.

    By Romuald,

    • 0 comments
    • 1,900 views
  • SteadyOptions 2024 - Year in Review

    2024 marks our 13th year as a public trading service. We closed 136 winners out of 187 trades (72.7% winning ratio). Our model portfolio produced 116.7% compounded gain on the whole account based on 10% allocation per trade. We had only one losing month (of 0.6% loss) in 2024. 

    By Kim,

    • 0 comments
    • 527 views
  • The 7 Most Popular Cryptocurrencies Right Now

    There are thought to be 20,000 cryptocurrencies currently in existence. While a lot of these are inactive or discontinued, a lot of them are still being traded on a daily basis. But just which cryptocurrencies are most popular? This post takes a look at the top 7 most traded cryptocurrencies.

    By Kim,

    • 0 comments
    • 7,476 views
  • Harnessing Monte Carlo Simulations for Options Trading: A Strategic Approach

    In the world of options trading, one of the greatest challenges is determining future price ranges with enough accuracy to structure profitable trades. One method traders can leverage to enhance these predictions is Monte Carlo simulations, a powerful statistical tool that allows for the projection of a stock or ETF's future price distribution based on historical data.

    By Romuald,

    • 10 comments
    • 9,164 views
  • Is There Such A Thing As Risk-Management Within Crypto Trading?

    Any trader looking to build reliable long-term wealth is best off avoiding cryptocurrency. At least, this is a message that the experts have been touting since crypto entered the trading sphere and, in many ways, they aren’t wrong. The volatile nature of cryptocurrencies alone places them very much in the red danger zone of high-risk investments.

    By Kim,

    • 0 comments
    • 5,259 views
  • Is There A ‘Free Lunch’ In Options?


    In olden times, alchemists would search for the philosopher’s stone, the material that would turn other materials into gold. Option traders likewise sometimes overtly, sometimes secretly hope to find something which is even sweeter than being able to play video games for money with Moincoins, that most elusive of all option positions: the risk free trade with guaranteed positive outcome.

    By TrustyJules,

    • 1 comment
    • 18,037 views
  • What Are Covered Calls And How Do They Work?

    A covered call is an options trading strategy where an investor holds a long position in an asset (most usually an equity) and sells call options on that same asset. This strategy can generate additional income from the premium received for selling the call options.

    By Kim,

    • 0 comments
    • 3,312 views
  • SPX Options vs. SPY Options: Which Should I Trade?

    Trading options on the S&P 500 is a popular way to make money on the index. There are several ways traders use this index, but two of the most popular are to trade options on SPX or SPY. One key difference between the two is that SPX options are based on the index, while SPY options are based on an exchange-traded fund (ETF) that tracks the index.

    By Mark Wolfinger,

    • 0 comments
    • 8,593 views
  • Yes, We Are Playing Not to Lose!

    There are many trading quotes from different traders/investors, but this one is one of my favorites: “In trading/investing it's not about how much you make, but how much you don't lose" - Bernard Baruch. At SteadyOptions, this has been one of our major goals in the last 12 years.

    By Kim,

    • 0 comments
    • 4,675 views
  • The Impact of Implied Volatility (IV) on Popular Options Trades

    You’ll often read that a given option trade is either vega positive (meaning that IV rising will help it and IV falling will hurt it) or vega negative (meaning IV falling will help and IV rising will hurt).   However, in fact many popular options spreads can be either vega positive or vega negative depending where where the stock price is relative to the spread strikes.  

    By Yowster,

    • 0 comments
    • 7,116 views

  Report Article

We want to hear from you!


Thanks, Paul.  Some good info there - not all entirely new to me, but a good! refresher and it clears up the "long 40 delta" (which was what I was guessing it meant).

 Am I to infer then that the exp & strike are any that would give me 40 delta?  For example, MSFT right now has 10/20@75 and 11/3@75.5 (plus others) both around 40 delta.  Is any one preferred over the other, and if so why?

Share this comment


Link to comment
Share on other sites
10 minutes ago, skydragon said:

Thanks, Paul.  Some good info there - not all entirely new to me, but a good! refresher and it clears up the "long 40 delta" (which was what I was guessing it meant).

 Am I to infer then that the exp & strike are any that would give me 40 delta?  For example, MSFT right now has 10/20@75 and 11/3@75.5 (plus others) both around 40 delta.  Is any one preferred over the other, and if so why?

This article is referring to buying the ~40 delta call closest to, but not less than, 7 days to expiration. The article doesn't actually say, but you can click the Back-Test link and figure it out.

Edited by greenspan76

Share this comment


Link to comment
Share on other sites

Thanks, greenspan76.  I'm having trouble loading what I think would be the full backtest page.  I'm not a CMLviz client and I'm going through a proxy server at the moment.  But I think I have what I need for when the 19th rolls around, so I'm good.

Share this comment


Link to comment
Share on other sites

They normally test with 1 lots, so it would be the 'closest' call to 40 delta at the end of the trading day.  You could obviously do as you are suggesting to get it closer for your entire position, but that's what the backtester is doing.

Share this comment


Link to comment
Share on other sites

I'm still a bit of an options novice, but I have a couple observations/questions on this trade.  I invite expert critique.

This is a bullish momentum play (as is well stated).  Thus IMO many bullish trade strategies might be appropriate here.  In other words, the long 40 delta call is just one of many ways to profit.  I do like it, so don't get me wrong, but I am wondering if anyone has reviewed other strategies - for instance varying the delta, or testing another trade type (eg, bull put spread) - to squeeze more gains out of the opportunity (while still keeping risk/reward at a prudent level)?  This sort of analysis is beyond my skill level and time availability.  [This may be a rhetorical question, since the article doesn't actually stress the exclusion of other trade types.]

Secondly (and more importantly), I question the proposed expiration.  Since we are going long, theta is working against us and it accelerates as expiration approaches.  Might a couple months worth of time till exp be a better choice?  I realize that delta and gamma also kick into high gear as exp approaches, and that those factors (and lV as well) could considered such that they best work in our favor...so it becomes a balancing act. Again, it's a bit beyond my grasp to test this.  Also I'm beginning to wonder if I'm just overly 'sweating the small stuff'.

Share this comment


Link to comment
Share on other sites

1. I tried to play with deltas, 40 provides the best results, but other deltas work as well.

2. We want the maximum gamma. Yes, it comes on expense of theta working against us, but IV should keep the theta losses to minimum (similar to our earnings straddles).

Share this comment


Link to comment
Share on other sites

I got in at .95 yesterday, just got out at 1.37. 44% before commissions. It didn't take long to fill at 1.37. I suspect there is more room to run, but hit my target exit, so I exited. Interesting trade....

Share this comment


Link to comment
Share on other sites

Sold half my position for 1.40, 42.8% return. Letting the other half ride for a while longer with a stop limit to see where it goes.

Share this comment


Link to comment
Share on other sites


Create an account or sign in to comment

You need to be a member in order to leave a comment

Create an account

Sign up for a new account. It's easy and free!


Register a new account

Sign in

Already have an account? Sign in here.


Sign In Now

Options Trading Blogs