
However, today, we’ll focus on ways to take risk off your stock positions (or transfer it to other risk). This may be a stock you chose to own, or perhaps a stock you were assigned when a premium selling trade went against you. Therefore, we’ll evaluate these setups both through the lens of hedging as well as repairing a losing position that was assigned to us.
We will discuss several strategies and the tradeoffs when executing.It is important to note (and hopefully it goes without saying) that there’s no free lunch in trading.
We will also use real options examples and pricing from EWZ, the Brazilian Emerging Markets ETF with July 20, 2018 expirations for all contracts. At the time of writing, EWZ is demonstrating fairly high implied volatility rank and good liquidity.
Our game plan will be to briefly cover 3basic strategies as a fundamentals review and for sake of comparison against 2 strategies that are a little more advanced but unlock a lot of power for hedging. That is, if you can handle the tradeoffs and additional capital outlay when things go wrong.
The three basic strategies we will cover are:
- Covered Call –the sale of a call for income to reduce a stock’s cost basis.
- Protective Put –the purchase of a call as protection against a price decline; and,
- Collared Stock –the sale of a call and the purchase of a put, a combination of sorts of the covered call and protective put.
However, the focus of this article will be on these advanced strategies:
- Front Ratios–A Call Front Ratio involves either buying 1 call ATM and selling 2 calls OTMfor a net credit or slight debit (depending on the premium paid/received – see below for more). APut Front Ratio with Puts involves selling 2 puts OTM in order to finance the purchase of 1 put ATM.
- Double Front Ratio–involves the execution of a Front Ratio with Calls& Puts simultaneously against a stock position of equal shares. This setup offers a way to double your profits up to a limit (i.e. the short call in the case of a Front Ratio with Calls that creates a net credit) while also protecting against downside or upside risk.
Strategy #1: Covered Call – Used to Reduce Risk and Reduce Cost Basis
Covered Calls are the most common ‘partial hedge’ used by traders.Here is the setup:
You sell a call against an existing stock position creating a net credit.
You use the Covered Calls to create additional income and increase the overall return on the stock. This provides small ‘cushion’ against a short term drop in the price of the underlying stock.
You purchased EWZ at $38.10 and sell a $40 BHGE call for $0.85. Here’s your position:
Long 100 sh. EWZ @$38.10 = $3,810
Short 1 EWZ40 Call @$0.85 = ($ 85)
Total outlay $3,725
Max gain: Strike price ($40) – Stock price ($38.10) + premium received ($0.85) = $2.75 × 100 = $275;
Max loss: Stock price($38.10) – premium received ($0.85) = $37.25 × 100 = $3,725 (if Brazil ceases to exist in less than two months’ time.);
Breakeven: Stock price ($38.10) – premium received ($0.85) = $37.25
Risk Plot:
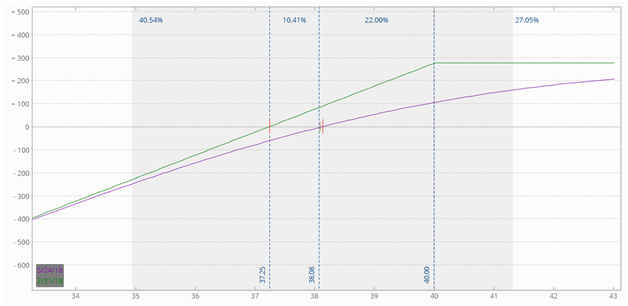
EWZ Covered Call
This options setup is popular with traders as it lowersyour cost basis, and can be repeated with time for income or to ‘repair’ a position, in the event that you were assigned stock from a short put position.
…but you’ve probably already traded this.
Strategy #2: Protective Put–Really Expensive Downside Protection
A Protective Put is a bearish hedging strategy that involves the purchase of a put against a portfolio position and fully covers you against a catastrophic loss (no Brazil in 2 months).The setup is as follows:
You buy a put against an existing stock position creating a net debit.
This options setup makes sense if the stock takes a sharp decline during the contract’s life. Honestly, I never understood this position for retail traders. If you expect a large decline, why not just sell your stock?
You purchased EWZ at $38.10 and purchase a $38.10EWZ put for $1.85. Here’s your position:
Long 100 sh. EWZ @$38.10 = $3,810
Long 1 EWZ38Put @$1.85 = $185
Total outlay $3,995
Max gain: unlimited upside (once you have passed the breakeven point below as your cost basis has increased);
Max loss: Stock price ($38.10) – Strike price ($38) – premium paid ($1.85) = $1.95× 100 = $195; Breakeven: Stock price ($38.10) + premium paid ($1.85) = $39.95 × 100 = $3,995.
The most you lose in this setup is $195for the next 2 months, because ifEWZ continues its decline toward $0, you can “put” the stock at $38 (prior to expiration), limiting your loss to the difference between your total outlay and what you receive for the sale of the stock at the put’s strike price.
All sounds nice, but no one hedges like this. If you do – please stop. $185 for insurance is paying nearly 5% per every two months for protection. Good way to go broke slowly.
Risk Plot:
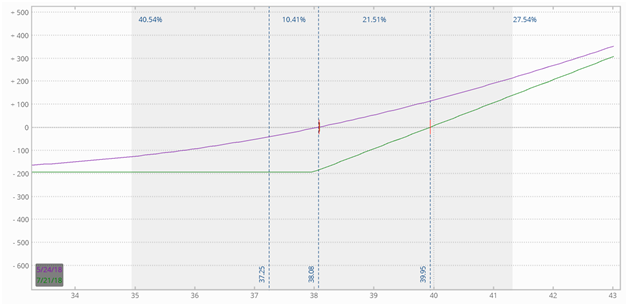
EWZ Protective Put
Strategy #3: Collared Stock– Used to Create Upside Opportunities and Limit Downside Risk
A Collared Stock hedge provides trading upside for limited downside protection. The setup for a Collared Stock hedge is:
You sell a call against an existing stock position creating a net credit and simultaneously buy a put.
You purchased EWZ at $38.10, sell a $40 BHGE call for $0.85 and purchase a $35EWZ put at $0.75. Here’s your position:
Long 100 sh. EWZ @$38.10 = $3,810
Long 1 EWZ35 Put @$0.75 = $75
Short 1 EWZ 40 Call @$0.85 = ($ 85)
Total outlay $3,800
Max gain: Strike price of Call ($40) – Stock price ($38.10) – net premium (-$0.10) = $2 × 100 = $200;
Max loss: Stock price ($38.10) – Strike price of Put ($35) + net premium (-$0.10) = $3 × 100 = $300;
Breakeven:Stock price ($38.10) + net premium (-$0.10) = $38 × 100 = $38.00.
The collar gives you a chance to gain in the above example up to $200 (up to expiration; unlimited after the options expired as the stock price climbs) on the upside and limits loss on the downside to $300. Limited gain, limited risk, a good setup for risk mitigation and certainly much smarter to finance your put protection with the premium from selling the upside call.
Risk Plot:
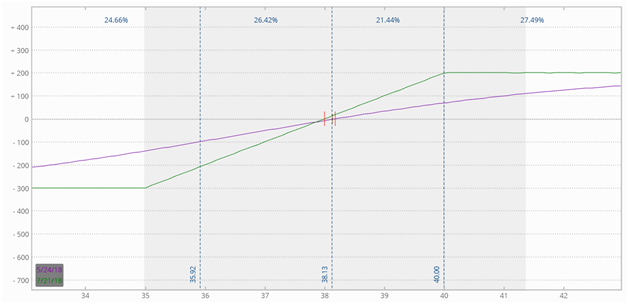
EWZ Collared Stock
Strategies 1, 2, and 3 are basic options setups that are likely familiar to you and well utilized (hence the summary review).
If you’re still with me, I promise it’s going to get more interesting. The next strategies are more advanced, but will offer clear benefits (with tradeoffs) compared to those we already looked at in our quick review.
We will now spend the bulk of our time discussing the Front Ratio and Double Front Ratio options setups. We’ll spend a little time on these (in a slightly different format than the above examples), with illustrated examples to show how they are designed.
Strategy #4: Front Ratio–Used to Protect Against Downside Risk (with Puts) or Upside Risk (for short positions with Calls)
A Front Ratio provides either downside risk protection (in the case of a Put Front Ratio) or upside risk protection (in the case of a Call Front Ratio).
How you choose to deploy this strategy depends on the setup you choose. Here are the setups for a net credit Front Ratio with a Call/Put:
You buy 1 ATM Call (first strike price) and sell 2 OTM Call (second strike or skipping strikes so long as you create a net credit).
Let’s look at the position for a Call Front Ratio and the associated risk plot to better understand the mechanics.
Long 1 EWZ38Call @$1.71 = $171
Short 2EWZ 40 Call @$0.88 = ($176)
Total CREDIT $5
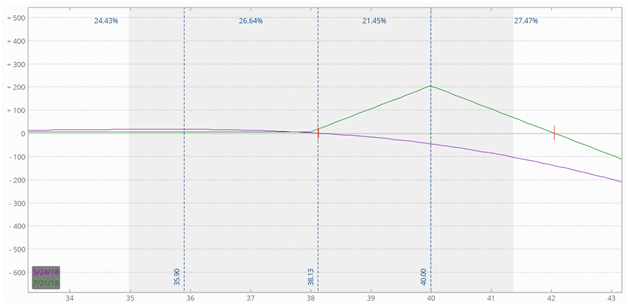
EWZ Front Call Ratio w/o Stock
The Front Ratio with Call is a moderately bullish outlook. You want the stock price to move to that of the second strike price (exactly) at expiration and collect the net premium as your profit.
The problem with this position is the naked call. Since there is no limit to what EWZ can appreciate to, there is also no limit to the potential losses. It gets interesting, however, when paired with the underlying stock.
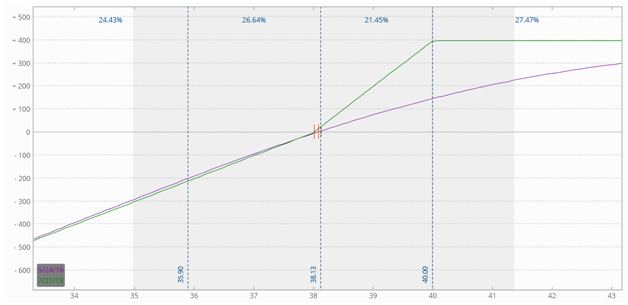
EWZ Front Call Ratio Paired with EWZ Stock
You might be thinking: “Drew, this isn’t a hedge.”. You are absolutely right; but I believe it’s worth discussing for a few reasons.
- It is a building block for the end setup, which is a great hedge.
- Many times options traders are put in the position of hedging a stock that has gone against them. We’re in essence trying to ‘repair’ the position, while limiting further directional risk.
What’s interesting about this setup is that we have 2x profits up to the short call. Imagine a scenario where we were short the $43 puts in a prior expiration cycle that we sold for $1. Our break even is now $42/share. If the stock recovers to $42/share, we have broken even on a bad trade. Great outcome, but not very probable.
Now, if we were willing to trade upside for an embedded call vertical (front call ratio) we can break even at $40/share instead of $42. Nice tradeoff.
For the Put Front Ratio, I’ll explain it backwards to ensure you understand. You sell2OTM Putsin order to finance the purchase of1ATM Putwhile still creating a net credit.
Let’s take a deeper look at our position and risk graph in this setup:
Long 1 EWZ38Put @$1.80 = $180
Short 2EWZ36Put @$1.00= ($200)
Total CREDIT $20
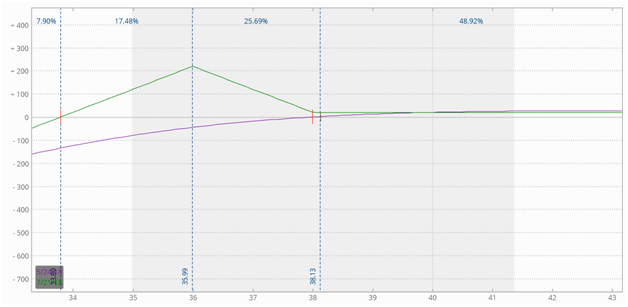
EWZ Front Put Ratio Paired w/o EWZ Stock
The Front Ratio with Put conversely is moderately bearish, where you expect a dip in the stock price. In this case, the stock price must reach the first strike price (exactly) at expiration for profit to occur. Please note that this is an advanced setup – you should have a good grasp on the greeks and trade small when trying out for the first (and every time).
However, this is a hedging article. So let’s look at this setup paired with stock.
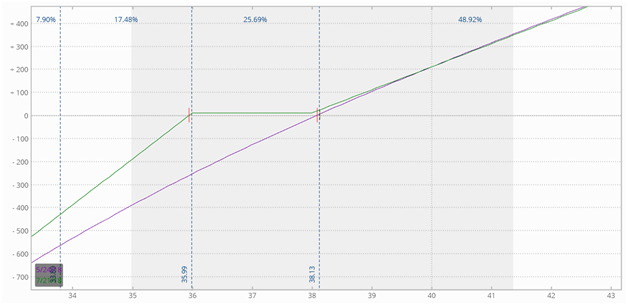
EWZ Front Put Ratio Paired with EWZ Stock
I hope the wheels are turning here. A Front Put Ratio paired with stock gives you $2 of
directional protection without paying a premium (on the contrary, we’re paid $0.20) and without sacrificing upside potential. Wait – “no free lunch”, remember?
There is a major tradeoff here. We’re promising to buy more stock if the price continues to fall. This doubles the rate of our losses. Alarm bells may be ringing, and it isn’t for everyone. In the end, I’ll give you my take on when this could work. In the meantime, and in case you drop off here, I would urge you to only consider this if you are long-term bullish on the stock. In effect, it’s a form of dollar cost averaging.
If you’re still with me, you might be thinking “why not combine the two?”. Well, good idea. Let me present Strategy #5.
Strategy #5: Double Front Ratio–Hedging and Getting Back to Even
This “hedging” or “repair” strategy involves a simultaneous Call/Put Front Ratio.
Let’s break down what we’re doing here in slightly different terms. We’re taking immediate directional risk off with a long put vertical, which is financed with another short put. This increasesour notional risk but lowers our probability of loss.
We’re also trading our ‘unlimited upside’ from the long stock by deploying a covered call. The premium from the covered call is used to finance a long vertical call spread, which doubles our profit for immediate price moves.
Instead of painstaking recycling the individual contracts from above. Let’s review the equivalent position:
· 1 Covered Call (defined risk, limited upside),
· 1 Bear Put Spread (defined risk, financed),
· 1 Short Put (a promise to buy more, but defined risk), and
· 1 Bull Call Spread (defined risk, financed)
Let’s look first at the risk plot for the options-only position, as before:
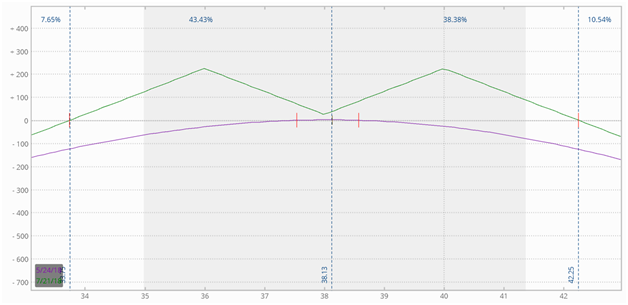
EWZ Double Front Ratio w/o EWZ Stock
A few comments on the naked stock position. The profit range is huge. We see profits so long as EWZ remains between 33.75 and 42.25. Options trading models estimate an 82% chance of that happening at current volatility. Expansions in volatility hurt the position and probabilities while contractions in volatility benefit the position.
The volatility effects are interesting in terms of repairing as we often put these structures on in high volatility environments as we see price movements beyond our anticipated levels from the failed short position.
Now, let’s look at one of the strangest risk plots you may ever see. Let’s pair the options up with the stock position.
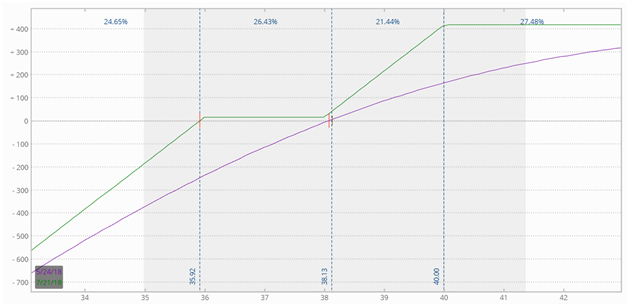
EWZ Double Front Ratio Paired with EWZ Stock
With a Double Front Ratio as a hedging or repair strategy,if the stock recovers you make $2 for every $1 move in the stock up to the short call. If you are repairing a position, this allows you to lower your break-even strike.
To the downside, you are protected dollar for dollar up to the short puts. At this point, you are committed to buy more or roll down and out if unassigned. Volatility will also likely expand, which is great for rolling so long as the stock doesn’t blow through your short strikes.
When compared against the introductory hedging options at the beginning of the article, you can see how powerful these setups are, but here’s a word of caution: it isn't for everyone. This reinforces our contention that you should always trade small (consistent small trades yield consistent small profits).
When I look at income candidates, I decide what position size I want and then divide by 4. This allows me to do such a hedge/repair twice before reaching my intended allocation. It takes discipline, patience and a lot of trades.
I understand that even introducing such an idea may be considered “controversial”to conventional trading wisdom. However, let me argue that most of the adage of "don't add to losers" is sound advice rooted in a bad habit of over-allocated positions at trade entry!
The last point is that you can also put on these setups when purchasing the stock (similar to a buy-write). If you put on a Double Front Ratio at the time of purchasing the stock, you usually have more downside protection than a covered call and you have double profits compared to a covered call.
Extra Credit:
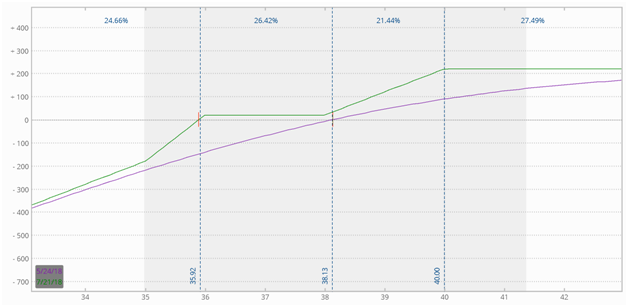
Expanding on the topic and potential fodder for a future article, can anyone describe what was done in this risk graph? Hint: it’s paired with EWZ stock and can also be used as a partial hedge.
Drew Hilleshiem is the Co-Founder and CEO of OptionAutomator, an options trading technology startup offering a free options screener that leverages Multi-Criteria Decision Making (MCDM) algorithms to force-rank relevancy of daily options opportunities against user’s individual trading criteria. He is passionate to help close the gap between Wall Street and Main Street with both technology and blogging. You can follow Drew via @OptionAutomator on Twitter.


Join the conversation
You can post now and register later. If you have an account, sign in now to post with your account.
Note: Your post will require moderator approval before it will be visible.