
More concerning is that the Fed’s approach to dampening inflation could actually stoke it. In that vein, we want to share further thoughts on the article, the identity and what it may portend from an investment perspective.
There is no investment professional under the age of 60 that has managed money in an inflationary era. For that matter, no one under 60 has managed money in an environment where stocks and bonds sell off simultaneously for a prolonged period. While we are not predicting that will occur, we do think that most investors, blinded by recency bias, are not even considering the possibility. Our aim is not to persuade you towards a stagflationary outlook, but to encourage you to consider the possibility and plan for such an event. Stagflation, like a 100-year storm, is a rare economic event and something for which very few are prepared.
Article Review
Our article explored economist Irving Fischer’s monetary equation identity which states that Prices (P) * Output (Q) equals Monetary Base (M) * Monetary Velocity (V). Algebraically rearranging the formula as follows creates what is known as the inflation identity.
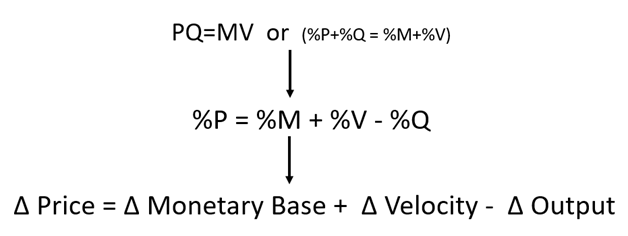
To isolate the Price (P) or inflation component, the inflation identity can then be broken down into its two components; monetary (M and V) and Output (Q). In this article,since the current monetary environment is truly unique, we focus on that aspect of the equation. Not since at least 1960 has the Fed ever attempted to decrease the monetary base while increasing interest rates as they are doing now. In light of this circumstance, we must be willing to plan and strategize for an event that is foreign to investors.
Monetary Base (M)
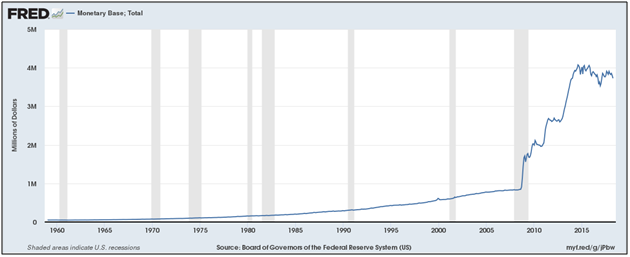
The monetary base is the sum of currency in circulation plus reserve balances held by banks. The Fed, through Quantitative Easing (QE) and other monetary actions, caused the monetary base to surge over four times during the financial crisis and for the ensuing five years. The graph below highlights the unprecedented increase.
Forecasting future changes in the monetary base is relatively easy as the Fed has provided guidance on their plans to reduce their balance sheet, aka Quantitative Tightening (QT). The following chart shows the tight correlation between QE and the monetary base and a forecast for the monetary base grounded in the Fed’s QT guidance.
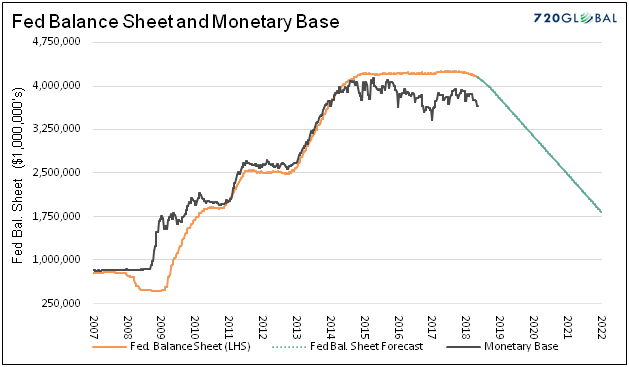
Data Courtesy: St. Louis Federal Reserve
Monetary Velocity (V)
It is customary for velocity to increase when interest rates increase as the opportunity cost of holding money rises. Conversely, velocity declines when interest rates approach zero for the opposite reason. Further, velocity can rise or fall for exogenous reasons such as the level of trust in the banking system. In the Great Depression, for example, velocity plummeted as cash was greatly preferable to deposits at banks in which the public had lost confidence.
In the article, we presented the following graph showing the relationship between the monetary base and velocity.
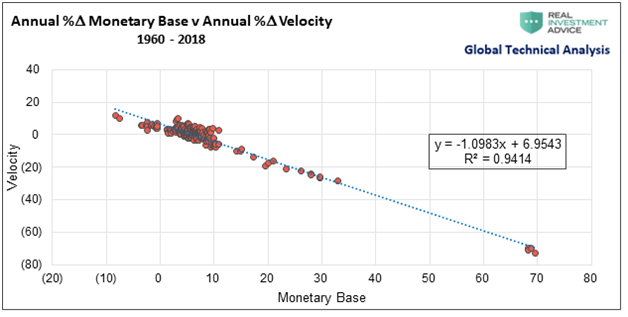
Data Courtesy: St. Louis Federal Reserve
Whether relying on the statistically significant R-squared of 0.9414 or just your eyes, it is easy to recognize the meaningful relationship between the two. It is this relationship that we have analyzed to great depths. While not evident to the naked eye, velocity and the monetary base do not move on a one-for-one basis. To emphasize this very important point, we provide the expected change in prices based on various changes to the money supply in the chart below. The chart solves for P based on changes to M and the associated regression estimates for V. Further it neutralizes output (Q) to isolate the monetary components (M and V).
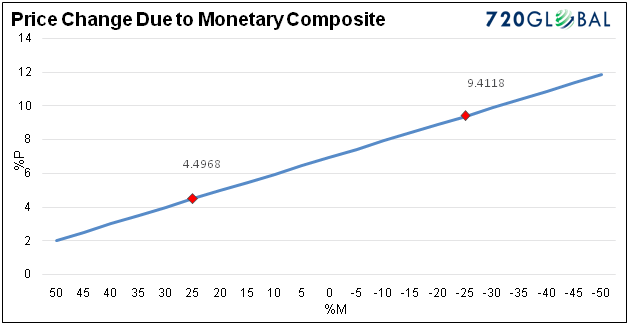
Data Courtesy: St. Louis Federal Reserve
Note the two red diamonds on the graph that show how prices are affected by a 25% increase and decrease in the monetary base. If we disregard output (Q) and assume the regression holds, then a 25% decline in the monetary base creates 5% more inflation than a 25% increase.
Intuitively, it would seem as though more money in the system should be more inflationary. The identity equation and historical data tell a different story. It also may help explain why QE did not stoke inflation as was expected by many. In fact, since 1960, there have only been four quarters in which annual CPI declined. All of those quarters occurred during the financial crisis. Further, the annual increase in the monetary base during those four quarters was consistently 68-69%. That rate of growth is more than double any other quarterly change in the base since at least 1960 and almost ten times the average.
On Our Radar
As long as the Fed is tightening monetary policy and reducing their balance sheet, the monetary base is likely to decline. Given this fact, we should then look to economic growth forecasts and the regression formula discussed above for inflation feedback. Based on the formula, lower output growth is more inflationary than higher output growth. Remember if we strip out the monetary components (M and V), P = -Q. The negative relationship is important to consider.
In our opinion, the most important indicator to watch is velocity. If velocity adheres to the regression formula, then we should expect an inflationary impulse. Stronger economic growth, if it were to occur, would to some extent offset such an event. M2 velocity as reported by the St. Louis Federal Reserve (Code M2V) is a good proxy for velocity.
Investing in the 100-year storm
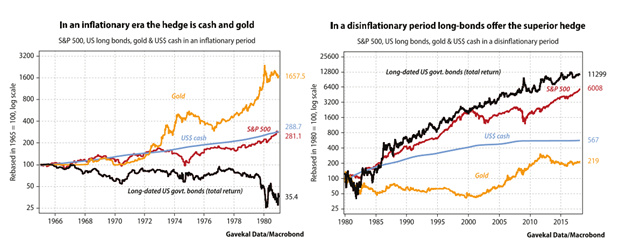
Investing in a stagflationary environment is foreign to almost every U.S. investor. The traditional 70/30 stock/bond allocation and popular risk-parity strategiesare likely to underperform risk-free investments in T-Bills. In such an environment we should consider investing in commodities, precious metals, floating rate bonds, inflation-protected securities (TIPS), short-term bonds, and foreign securities and possibly take short positions in stocks and longer-term bonds.
The graphs below, courtesy of Gavekal Data/Macrobond, provide historical evidence on why a regime change could be damaging to the popular investment strategies of the day.
Summary
Our analysis argues that a stagflationary economic environment is possible and that the risks are greater than most people appreciate. Recency bias, however, causes us to believe that the future will be like the past. While 35 years of a deflationary trend is noteworthy, the prudent investor must consider the possibility that change is in the air.
Based on their actions, most investors are not giving any real thought to a scenario that differs from the months, years and decades of the past. Our recommendation, given that the jury remains out on developing inflation dynamics is to begin the work of an alternative investment approach today. We hope that these articles offer unique insight, better tools to monitor inflation, and motivation to plan on required investment changes should an inflationary environment develop.
We end by sharing an excellent podcast by our friend Eric Cinnamond. Eric and Jesse Felder discuss the changing inflationary mindset that is on the rise among small-cap companies.
We want to extend a special thank you to Brett Freeze. Brett, who co-authored Stoking the Embers of Inflation with us, spent countless hours analyzing data and debating many aspects of the monetary equation identity. The conclusions in this article and the original would not be possible without Brett’s participation. For more information on Brett’s services, please visit his website https://www.globaltechnicalanalysis.com/.
For more information about our services, please visit us at www.realinvestmentadvice.com or contact us at 301.466.1204 or email mplebow@720global.com
Michael Lebowitz, CFA is an Investment Analyst and Portfolio Manager for Clarity Financial, LLC specializing in macroeconomic research, valuations, asset allocation, and risk management. Michael has over 25 years of financial markets experience. In this time he has managed $50 billion+ institutional portfolios as well as sub $1 million individual portfolios. Michael is a partner at Real Investment Advice and RIA Pro Contributing Editor and Research Director. Co-founder of 720 Global. You can follow Michael on Twitter.

Join the conversation
You can post now and register later. If you have an account, sign in now to post with your account.
Note: Your post will require moderator approval before it will be visible.