SteadyOptions is an options trading forum where you can find solutions from top options traders. Join Us!

We’ve all been there… researching options strategies and unable to find the answers we’re looking for. SteadyOptions has your solution.

BTC/USD Struggles To Maintain Newly Conquered Territory


The first condition to declare the market is in bullish mode has been fulfilled. Now it is Ethereum's turn to assume its part of the game. XRP/USD keeps a low profile, waiting for its chance. We begin the week of analysis celebrating the bullish behavior of Bitcoin late on Sunday.

BTC/USD has broken above the $8,250 level escaping the long-term bearish channel that had governed its movements since early 2018.
 

Its teammates on the crypto podium have followed King Bitcoin up, but with worse performances. This characteristic of the rise means that the second condition that I pointed out in a previous article is not fulfilled.


Let us review the requirements. The first was that BTC/USD exceeds $8,250. The second condition is that the ETH/BTC crypto cross goes into bullish mode, and that has not been accomplished yet. However, it may change in the next few days.


ETH/BTC 4 Hours Chart
 

The ETH/BTC is trading at the 0.03067 level, moving between the EMA50 and the SMA100. Trading between mobile lines generates sudden short travel movements.
 

Above the current price, the first resistance level is at 0.0312 (upper parallel bullish trend line and EMA50), then the second resistance level awaits at 0.03161 (price congestion resistance). The third resistance level for ETH/BTC is at 0.0332 (upper parallel bullish trend line and price congestion resistance).


Below the current price, the first support level is at 0.0301 (SMA100, price congestion support, and SMA200), then the second support level is 0.0298 (price congestion support). The third support level for ETH/BTC awaits at 0.0275 (price congestion support).


image.png


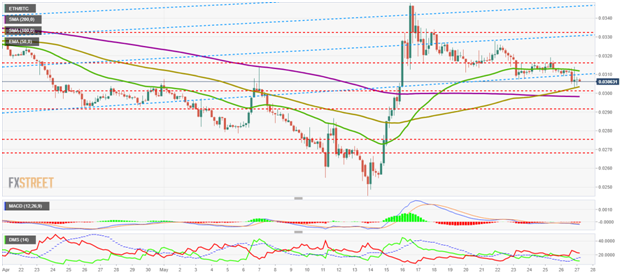
The MACD on the four-hour chart shows a slightly bearish profile, although it can easily turn up and quickly enter the positive zone of the indicator. This is a misleading profile at the time of analysis.
 

The DMI on the four-hour chart shows bears controlling the asset but with a downward profile. Bulls lose the ADX support, potentially complicating bullish development.


BTC/USD Daily Chart
 

BTC/USD is currently trading at $8,777 after hitting a relative high of $8.944. The Japanese daily candlestick chart is currently drawing a doji that jeopardizes the technical conquest if it ends the session with this figure.
 

Above the current price, the first resistance level is at $8,780 (price congestion resistance), then the second resistance level is at $9,160(price congestion resistance). The third resistance level for the BTC/USD pair is at $9,700 (price congestion resistance).


Below the current price, the first support level is at $8,400 (price congestion support), then the second support level is at $8,250 (price congestion support and upper trend line of the long term down channel). The third level of support is back into the bear channel at $8,000 (price congestion support).


image.png


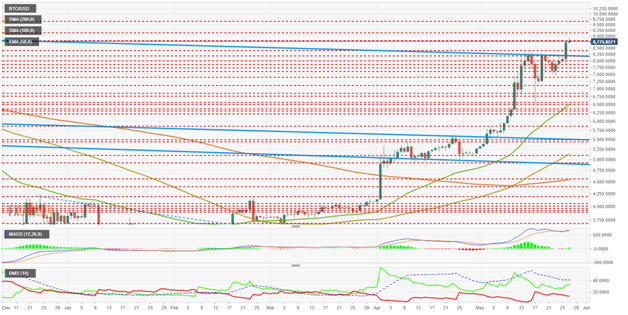
The MACD on the daily chart shows how after a bearish cross attempt, it bounced back and now takes advantage of the momentum to break out of the past bearish scenario. The next two days will mark the medium-term scenario.
 

The DMI in the daily chart shows the bulls increasing the advantage against the bears but still far from surpassing the ADX line that would start a new bullish pattern.


ETH/USD Daily Chart
 

The ETH/USD is currently trading at $268.16 after yesterday's new high relative to the close. The next resistance level is further away at $290, and reaching it requires accumulating bullish strength.
 

Above the current price, the first resistance level is at $290 (price congestion resistance), then the second resistance level is at $305(price congestion resistance). The third resistance level for ETH/USD is $318 (price congestion resistance).
 

Below the current price, the first support level is $260 (price congestion support), then the second support level is $250 (price congestion support). The third level of support for ETH/USD is at $234(price congestion support).


image.png


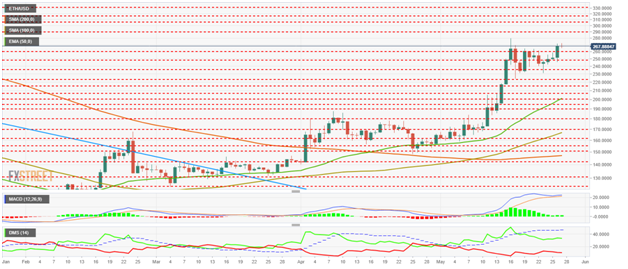
The MACD on the daily chart shows a bullish rebound after the first bearish cross attempt. It is not a very solid structure, so if it continues to rise, it will be in an overbought scenario.
 

The DMI on the daily chart shows how bulls keep control of the situation and barely celebrate the new relative high. The bears, on the other hand, weaken and remain at the lows.


XRP/USD Daily Chart
 

XRP/USD is currently trading at the $0.41 price level after sitting a daily high at $0.42. At this hour it loses support for price congestion at$0.412 and hints at a possible downward turning Japanese candle figure.
 

Above the current price, the first resistance level is $0.412 (price congestion resistance), then the second resistance level is $0.43(price congestion resistance). The third resistance level for the XRP/USD pair is $0.438 (price congestion resistance).


Below the current price, the first support level is $0.39 (price congestion support), then the second support level is $0.37 (price congestion support). The third support level for the XRP/USD pair is $0.35 (EMA50).


image.png


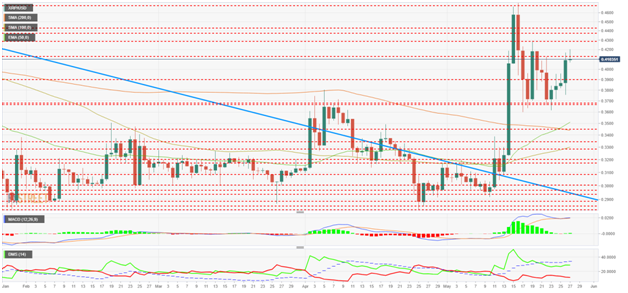
The MACD on the daily chart shows a small upward bounce after the first bearish cross attempt. As in the other cases, it may continue to rise, but in an overbought environment.
 

The DMI on the daily chart shows the bulls reacting up and moving very close to the ADX line. If the D+ were above the ADX, we could easily see a bullish explosion. The bears continue to show weakness.

 
This is a guest post from FXStreet, a leading provider of data, real time analysis and actionable tools for Forex traders.


What Is SteadyOptions?

12 Years CAGR of 115.5%

Full Trading Plan

Complete Portfolio Approach

Real-time trade sharing: entry, exit, and adjustments

Diversified Options Strategies

Exclusive Community Forum

Steady And Consistent Gains

High Quality Education

Risk Management, Portfolio Size

Performance based on real fills

Subscribe to SteadyOptions now and experience the full power of options trading!
Subscribe

Non-directional Options Strategies

10-15 trade Ideas Per Month

Targets 5-7% Monthly Net Return

Visit our Education Center

Recent Articles

Articles

  • When Investors Lose Their Nerve

    It was a rough end to the week for markets, with a sharp sell-off on Friday reminding investors just how quickly sentiment can turn. For anyone who sold in late summer anticipating a correction and then bought back in at the start of October, that one-day drop might have felt like confirmation that they can’t win.

    By Kim,

    • 0 comments
    • 266 views
  • Uncovering Common Cryptocurrency Trading Mistakes For Beginners

    Are you tempted by the shining allure of crypto trading? You aren’t alone. Decentralized cryptocurrencies hold perhaps the most tempting investment pull of a generation, especially amongst young or beginner investors. After all, by painting a different way to buy and sell, cryptocurrency offers something new that we’re all keen to get in on. 

    By Kim,

    • 0 comments
    • 6920 views
  • Buy Call, Sell Put Strategy Explained | SteadyOptions

    The Sell Put And Buy Call Strategy is an example of a synthetic stock options strategy: using call and puts options to mimic the performance of a position, usually involving the purchase of a stock. We saw this when looking at the synthetic covered call strategy elsewhere.

    By Chris Young,

    • 0 comments
    • 67337 views
  • Long Straddle Options Strategy | Maximize Profits with Big Moves

    Straddle Options Definition
    An options straddle strategy is buying (or selling) both a put and call option with the same strike price and expiration date for the same underlying asset, and paying both the put and call premiums.

    By Pat Crawley,

    • 0 comments
    • 67823 views
  • Gamma Scalping Options Trading Strategy

    Gamma scalping is a sophisticated options trading strategy primarily employed by institutions and hedge funds for managing portfolio risk and large positions in equities and futures. As a complex technique, it is particularly suitable for experienced traders seeking to capitalize on market movements, whether up or down, as they occur in real-time.

    By Chris Young,

    • 0 comments
    • 30643 views
  • Long Gamma vs Short Gamma: Options Strategy Explained

    Gamma is one of the primary Options Greeks, which measure an option's sensitivity to specific factors that could affect an option price. Despite traders hyping up several different Greeks and second-order Greeks like "Vanna" and "charm," there are only four primary Greeks that you need to be familiar with to understand options trading.


    By Pat Crawley,

    • 0 comments
    • 50170 views
  • Predicting Probabilities in Options Trading: A Deep Dive into Advanced Methods

    In options trading, the focus should not be on predicting the exact closing price of a ticker on a given date - a near-impossible task given the pseudo-random nature of markets. Instead, we aim to estimate probabilities: the likelihood of a ticker being above a specific value at a certain point in time. This perspective turns trading into a probabilistic exercise, leveraging historical data to make informed decisions.

    By Romuald,

    • 1 comment
    • 17012 views
  • SteadyOptions 2024 - Year in Review

    2024 marks our 13th year as a public trading service. We closed 136 winners out of 187 trades (72.7% winning ratio). Our model portfolio produced 116.7% compounded gain on the whole account based on 10% allocation per trade. We had only one losing month (of 0.6% loss) in 2024. 

    By Kim,

    • 0 comments
    • 6495 views
  • Wheel Strategy Options: Master Wheel Trading Explained

    The “wheel” trade is variously described as a beginner’s strategy, a combination to exploit features of both calls and puts, and as “perfect” solution to the well-known risks of shorting calls, even when covered. The options wheel strategy is an income-generating options trading strategy that both beginners and experienced traders can leverage for profit.

    By Pat Crawley,

    • 0 comments
    • 76140 views
  • Why Dollar Delta Will Change Your Trading

    Delta is one of the four main option Greeks, and any serious trader needs to have a thorough understanding of this greek if they hope to have any chance of success in the trading options. If you’re a beginner, you can visit my blog to learn more about understanding option delta

    By GavinMcMaster,

    • 0 comments
    • 36621 views

  Report Article


We want to hear from you!


There are no comments to display.


Join the conversation

You can post now and register later. If you have an account, sign in now to post with your account.
Note: Your post will require moderator approval before it will be visible.

Guest
Add a comment...

×   Pasted as rich text.   Paste as plain text instead

  Only 75 emoji are allowed.

×   Your link has been automatically embedded.   Display as a link instead

×   Your previous content has been restored.   Clear editor

×   You cannot paste images directly. Upload or insert images from URL.

Loading...

Options Trading Blogs