

SteadyOptions is an options trading forum where you can find solutions from top options traders. Join Us!

We’ve all been there… researching options strategies and unable to find the answers we’re looking for. SteadyOptions has your solution.

BTC/USD Struggles To Maintain Newly Conquered Territory


The first condition to declare the market is in bullish mode has been fulfilled. Now it is Ethereum's turn to assume its part of the game. XRP/USD keeps a low profile, waiting for its chance. We begin the week of analysis celebrating the bullish behavior of Bitcoin late on Sunday.

BTC/USD has broken above the $8,250 level escaping the long-term bearish channel that had governed its movements since early 2018.
 

Its teammates on the crypto podium have followed King Bitcoin up, but with worse performances. This characteristic of the rise means that the second condition that I pointed out in a previous article is not fulfilled.


Let us review the requirements. The first was that BTC/USD exceeds $8,250. The second condition is that the ETH/BTC crypto cross goes into bullish mode, and that has not been accomplished yet. However, it may change in the next few days.


ETH/BTC 4 Hours Chart
 

The ETH/BTC is trading at the 0.03067 level, moving between the EMA50 and the SMA100. Trading between mobile lines generates sudden short travel movements.
 

Above the current price, the first resistance level is at 0.0312 (upper parallel bullish trend line and EMA50), then the second resistance level awaits at 0.03161 (price congestion resistance). The third resistance level for ETH/BTC is at 0.0332 (upper parallel bullish trend line and price congestion resistance).


Below the current price, the first support level is at 0.0301 (SMA100, price congestion support, and SMA200), then the second support level is 0.0298 (price congestion support). The third support level for ETH/BTC awaits at 0.0275 (price congestion support).
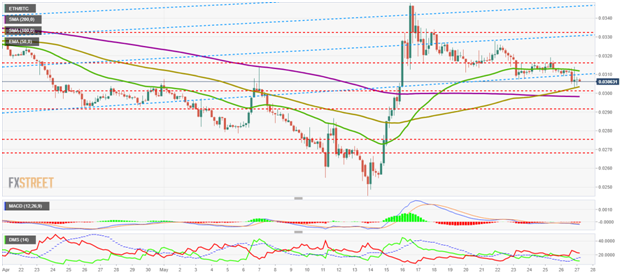
 

image.png


The MACD on the four-hour chart shows a slightly bearish profile, although it can easily turn up and quickly enter the positive zone of the indicator. This is a misleading profile at the time of analysis.
 

The DMI on the four-hour chart shows bears controlling the asset but with a downward profile. Bulls lose the ADX support, potentially complicating bullish development.


BTC/USD Daily Chart
 

BTC/USD is currently trading at $8,777 after hitting a relative high of $8.944. The Japanese daily candlestick chart is currently drawing a doji that jeopardizes the technical conquest if it ends the session with this figure.
 

Above the current price, the first resistance level is at $8,780 (price congestion resistance), then the second resistance level is at $9,160(price congestion resistance). The third resistance level for the BTC/USD pair is at $9,700 (price congestion resistance).


Below the current price, the first support level is at $8,400 (price congestion support), then the second support level is at $8,250 (price congestion support and upper trend line of the long term down channel). The third level of support is back into the bear channel at $8,000 (price congestion support).
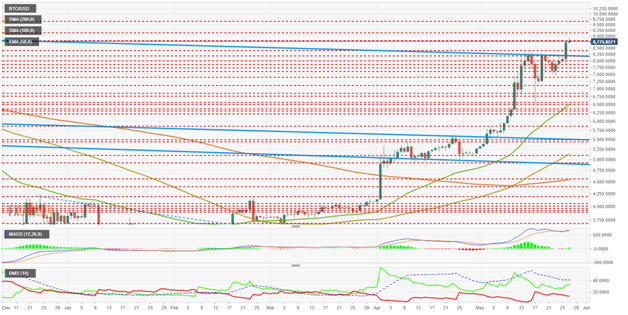
 

image.png


The MACD on the daily chart shows how after a bearish cross attempt, it bounced back and now takes advantage of the momentum to break out of the past bearish scenario. The next two days will mark the medium-term scenario.
 

The DMI in the daily chart shows the bulls increasing the advantage against the bears but still far from surpassing the ADX line that would start a new bullish pattern.


ETH/USD Daily Chart
 

The ETH/USD is currently trading at $268.16 after yesterday's new high relative to the close. The next resistance level is further away at $290, and reaching it requires accumulating bullish strength.
 

Above the current price, the first resistance level is at $290 (price congestion resistance), then the second resistance level is at $305(price congestion resistance). The third resistance level for ETH/USD is $318 (price congestion resistance).
 

Below the current price, the first support level is $260 (price congestion support), then the second support level is $250 (price congestion support). The third level of support for ETH/USD is at $234(price congestion support).
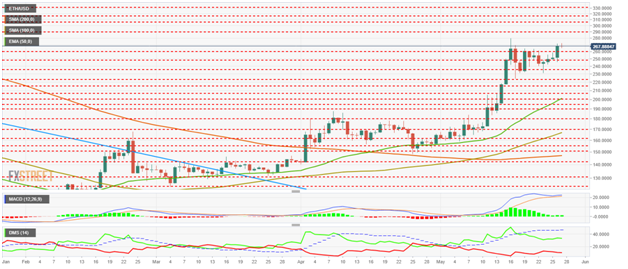
 

image.png


The MACD on the daily chart shows a bullish rebound after the first bearish cross attempt. It is not a very solid structure, so if it continues to rise, it will be in an overbought scenario.
 

The DMI on the daily chart shows how bulls keep control of the situation and barely celebrate the new relative high. The bears, on the other hand, weaken and remain at the lows.


XRP/USD Daily Chart
 

XRP/USD is currently trading at the $0.41 price level after sitting a daily high at $0.42. At this hour it loses support for price congestion at$0.412 and hints at a possible downward turning Japanese candle figure.
 

Above the current price, the first resistance level is $0.412 (price congestion resistance), then the second resistance level is $0.43(price congestion resistance). The third resistance level for the XRP/USD pair is $0.438 (price congestion resistance).


Below the current price, the first support level is $0.39 (price congestion support), then the second support level is $0.37 (price congestion support). The third support level for the XRP/USD pair is $0.35 (EMA50).
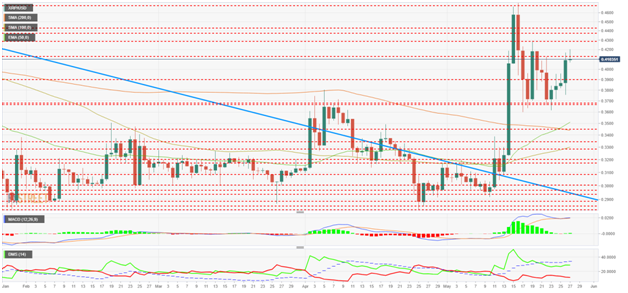
 

image.png


The MACD on the daily chart shows a small upward bounce after the first bearish cross attempt. As in the other cases, it may continue to rise, but in an overbought environment.
 

The DMI on the daily chart shows the bulls reacting up and moving very close to the ADX line. If the D+ were above the ADX, we could easily see a bullish explosion. The bears continue to show weakness.

 
This is a guest post from FXStreet, a leading provider of data, real time analysis and actionable tools for Forex traders.


What Is SteadyOptions?

12 Years CAGR of 114.5%

Full Trading Plan

Complete Portfolio Approach

Real-time trade sharing: entry, exit, and adjustments

Diversified Options Strategies

Exclusive Community Forum

Steady And Consistent Gains

High Quality Education

Risk Management, Portfolio Size

Performance based on real fills

Subscribe to SteadyOptions now and experience the full power of options trading!
Subscribe

Non-directional Options Strategies

10-15 trade Ideas Per Month

Targets 5-7% Monthly Net Return

Visit our Education Center

Recent Articles

Articles

  • Pre-Earnings Entry Price: What 31,000 Cycles Say

    Every card in the scanner carries a block called How expensive is this entry? It compares what you would pay today against what the same setup cost on the same ticker at the same point in past cycles. I built that block in August. It reads well. But a reading that looks sensible and a reading that predicts something are different things, and until last week I had only the first.


    By Romuald,

    • 0 comments
    • 6 views
  • Expensive Compared to What?

    A trader looks at a pre-earnings straddle and asks whether it is expensive. It is the right instinct and the wrong question, because the word carries no meaning on its own. Expensive against what? A $12 straddle on a $200 stock is not expensive or cheap. It is $12.

    By Romuald,

    • 0 comments
    • 260 views
  • Beyond Strategies: What Options Traders Should Know

    Options education almost always begins with structures. Traders learn vertical spreads, calendars, butterflies, condors, covered calls and straddles, study the expiration diagrams, work out maximum profit and loss, and build a sense of the conditions each structure is supposed to suit. That foundation is necessary and there is no way around it.

    By Kim,

    • 0 comments
    • 557 views
  • SPX vs SPY Options: Which One Should You Trade? (2026 Guide)

    Both SPX and SPY options give you exposure to the S&P 500. They track the same 500 stocks, move nearly tick-for-tick, and offer the same core strategies — credit spreads, iron condors, butterflies, and 0DTE trades. Yet the two products settle differently, are taxed differently, and carry very different assignment risks.

    By krisbee,

    • 0 comments
    • 4284 views
  • Strike Price Effects Or Pinning Revisted

    Loyal readers of this blog will recall my post from 2019 “Pinning Down the ‘Option Pinning’”. If you have not heard of pinning have a look at that article as – spoiler – everything in it as well as Jeff Augen’s observations in his books which are referenced is still valid.

    By TrustyJules,

    • 0 comments
    • 1944 views
  • Could This Strategy Be The Holy Grail Of Investing?

    This is a reprint of my Seeking Alpha article from 2013. If you have SA subscription, you can read the full article including hundreds of comments here. For the record, the strategy implementation has changed since then, but the principle remains the same. You can read more here

    By Kim,

    • 6 comments
    • 5367 views
  • Why Traders Need Brokers: An Important Alliance

    Trading the financial markets can be rewarding, but it also offers its fair share of complexities and obstacles. When faced with thousands of financial instruments, fluctuating markets, and a range of platforms at their disposal, traders can feel overwhelmed.

    By Kim,

    • 0 comments
    • 2098 views
  • 8 Tips to Help New Investors Build Up Their Wealth and Manage Risks

    Investing your money is arguably the most effective way to build wealth, but it’s not some magic get-rich-quick scheme. It comes with risk. If you jump into investing, especially if you’re considering investing in cryptocurrency and treat it like gambling, the chances are that you’ll see the same results as gambling.

    By Kim,

    • 0 comments
    • 1512 views
  • No Really, It Will Be Different This Time Around!

    Whilst the Palantir CEO is carping on about the fact that the iPhone is the crowning achievement of civilization and nothing has changed our lives more, us investors are left wondering if all the money that is going into the future grand vista of Big Tech really is the proverbial land of milk and honey.

    By TrustyJules,

    • 0 comments
    • 3095 views
  • Is Bitcoin Worth Buying in 2026?

    If you want the answer to whether or not you should buy Bitcoin, you're in the right place! In recent years, the world has been introduced to an entirely new peer-to-peer currency that's made waves all over the globe. The cryptocurrency known as Bitcoin has been available since 2009, but it's been garnering worldwide attention ever since early 2018.

    By Kim,

    • 0 comments
    • 3356 views

  Report Article


We want to hear from you!


There are no comments to display.


Join the conversation

You can post now and register later. If you have an account, sign in now to post with your account.
Note: Your post will require moderator approval before it will be visible.

Guest
Add a comment...

×   Pasted as rich text.   Paste as plain text instead

  Only 75 emoji are allowed.

×   Your link has been automatically embedded.   Display as a link instead

×   Your previous content has been restored.   Clear editor

×   You cannot paste images directly. Upload or insert images from URL.

Loading...