
We already debunked some of those "studies" here and here. Today we will debunk another study, and will show how to do it properly.
On July 7, 2015, tastytrade conducted a study using AAPL, GMCR, AMZN and TSLA. An ATM straddle was purchased 21 days prior to earnings and closed the day before earnings. A table showed the results. The win rate, total P/L, average P/L per day, biggest win and biggest loss were shown:
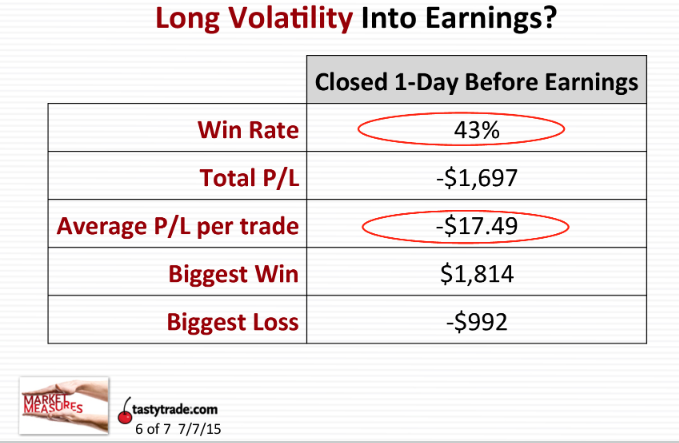
Their conclusion:
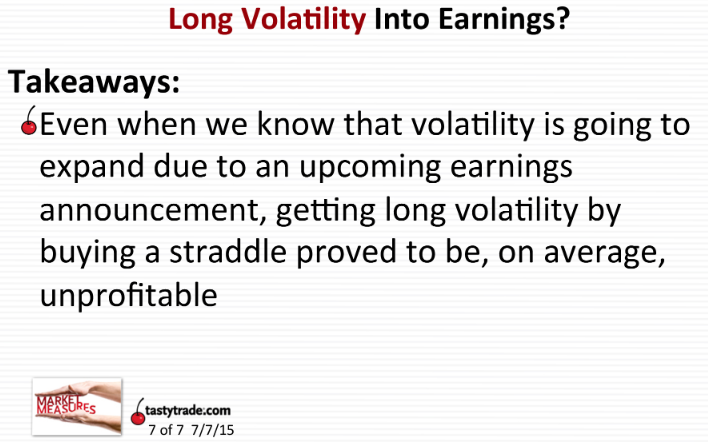
Wait... They concluded that buying volatility prior to earnings doesn't work based on 4 stocks? Why those 4 specific stocks? Why 21 days prior to earnings?
Our members know that those 4 stocks are among the worst to use for this strategy. They also know that entering 21 days prior to earnings is usually way too early (there are some exceptions).
Also, what is a significance of dollar P/L when comparing stocks like AMZN and AAPL? At current prices, AMZN straddle would cost around $8,500 while AAPL straddle around $1,200. Theoretically, if we had a 10% loss on AMZN (-$850) and 50% gain on AAPL ($600), the total P/L would be -$250. But the correct calculation would be total P/L of +40% because we need to give equal dollar weight to all trades.
But lets see how changing just one parameter can change the results dramatically. We will be using AAPL as an example.
First lets use the study parameter of 21 days.
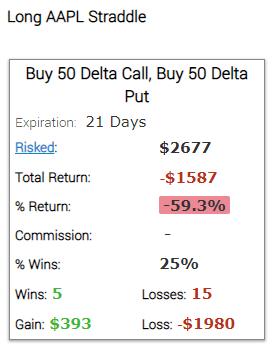
Entering 21 days prior to earnings is indeed a losing proposition. But lets change it to 10 days and see what happens:
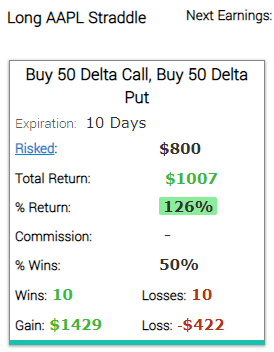
Can you see how changing one single parameter changes the results dramatically? I have a feeling that tastytrade knew that 21 days would be not the best time to enter - but using different parameters wouldn't fit their thesis.
Now lets test the strategy on some of our favorite stocks.
NKE, 14 days and 15% profit target:

Tap Here to See the back-test
MSFT, 7 days and 15% profit target:
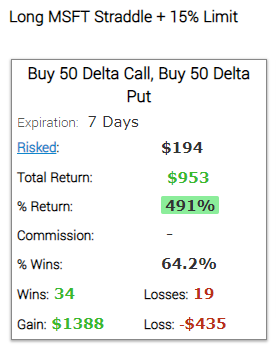
Tap Here to See the back-test
CSCO, 21 days and 10% profit target:
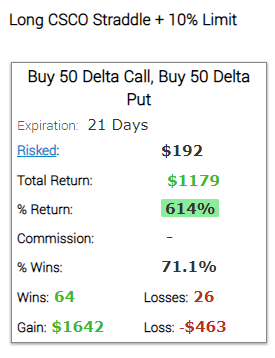
Tap Here to See the back-test
IBM, 7 days and 15% profit target:
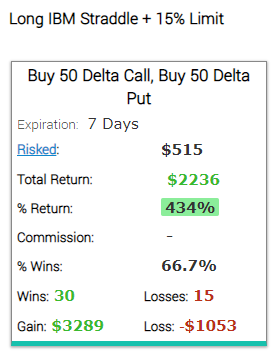
Tap Here to See the back-test
ORCL, 14 days and 20% profit target:
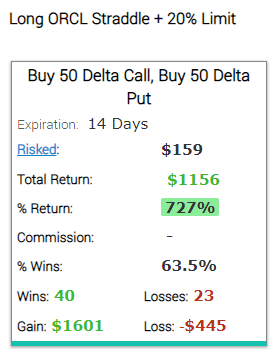
Tap Here to See the back-test
WMT, 7 days and 10% profit target:
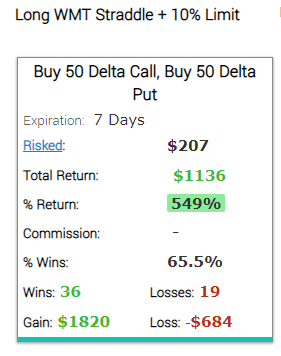
As you can see, different stocks require different timing and different profit targets. Some work better entering 7 days prior to earnings, some might improve performance with an entry as early as 21 days prior to earnings.
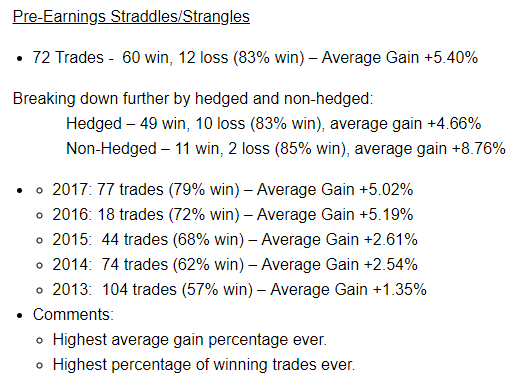
The bottom line is: you cannot just select random stocks, combine it with random timing and no trade management, and declare that the strategy doesn't work. But if you select the stocks carefully, combine it with the right timing and trade management, it works very well. Here are our results, based on live trades, not skewed "studies":
Related Articles:

There are no comments to display.
Join the conversation
You can post now and register later. If you have an account, sign in now to post with your account.
Note: Your post will require moderator approval before it will be visible.