Search the Community
Showing results for tags 'scripts'.
Found 1 result
-
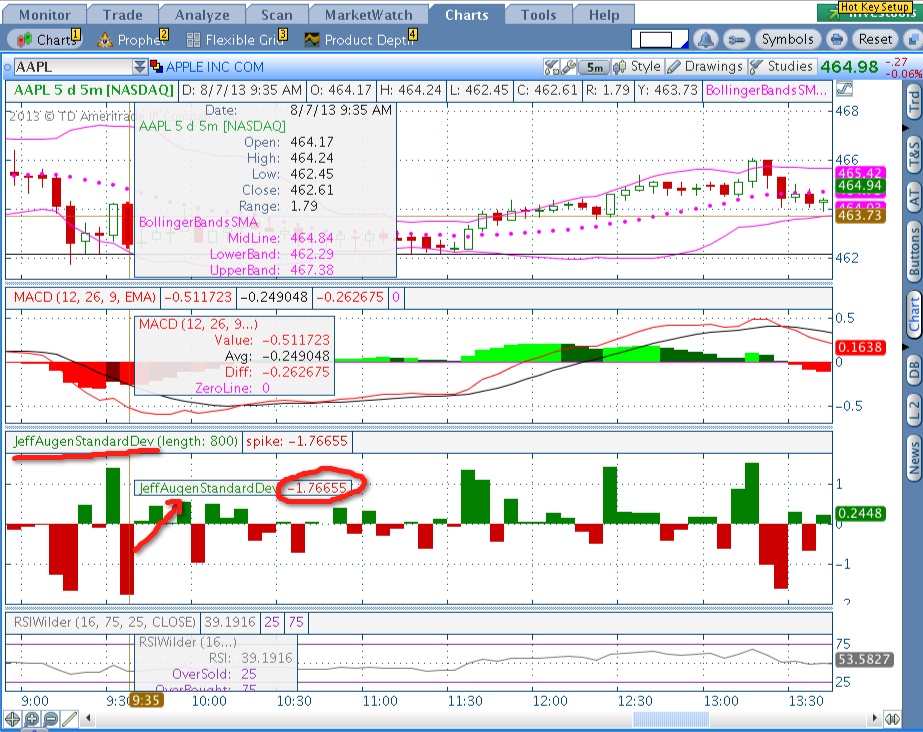
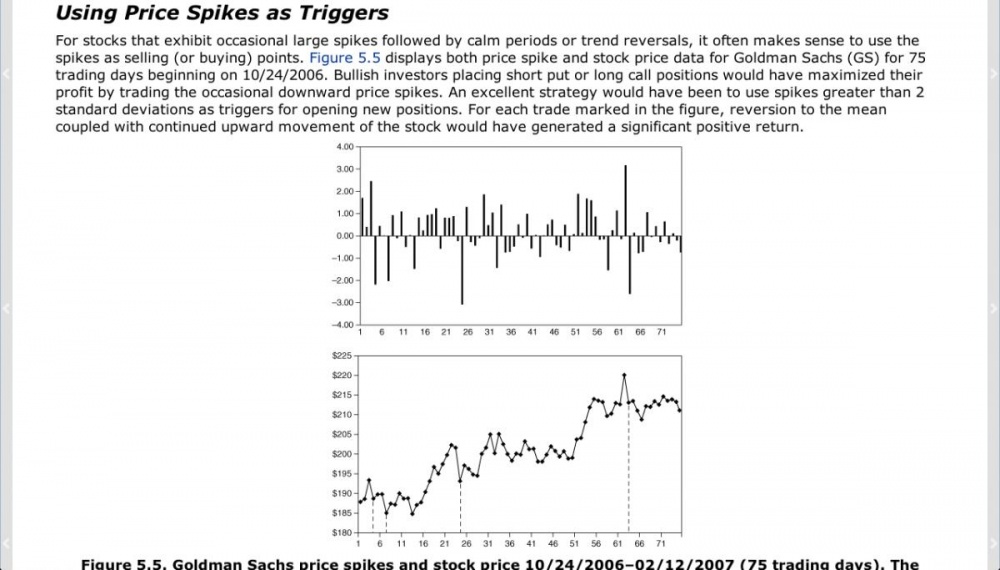
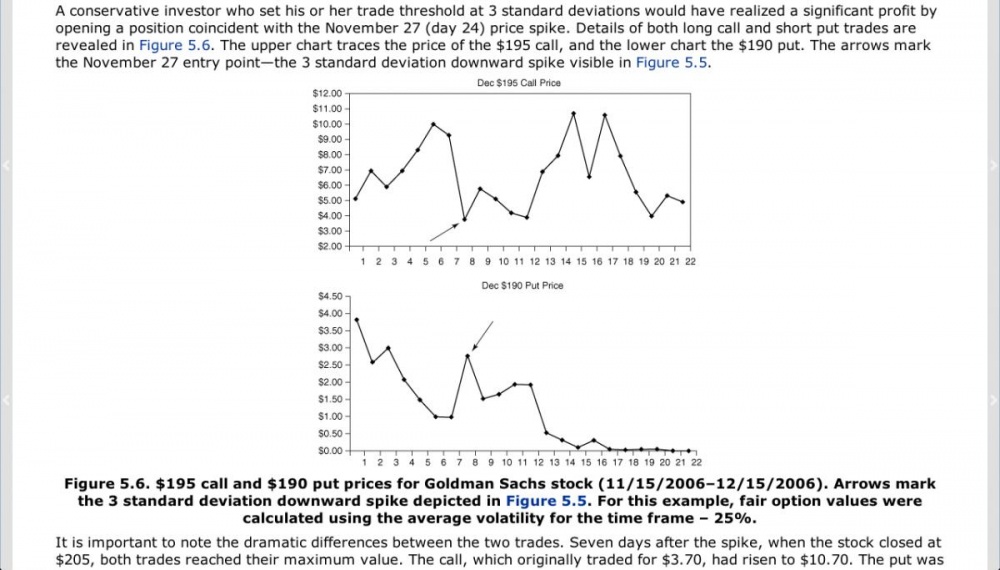
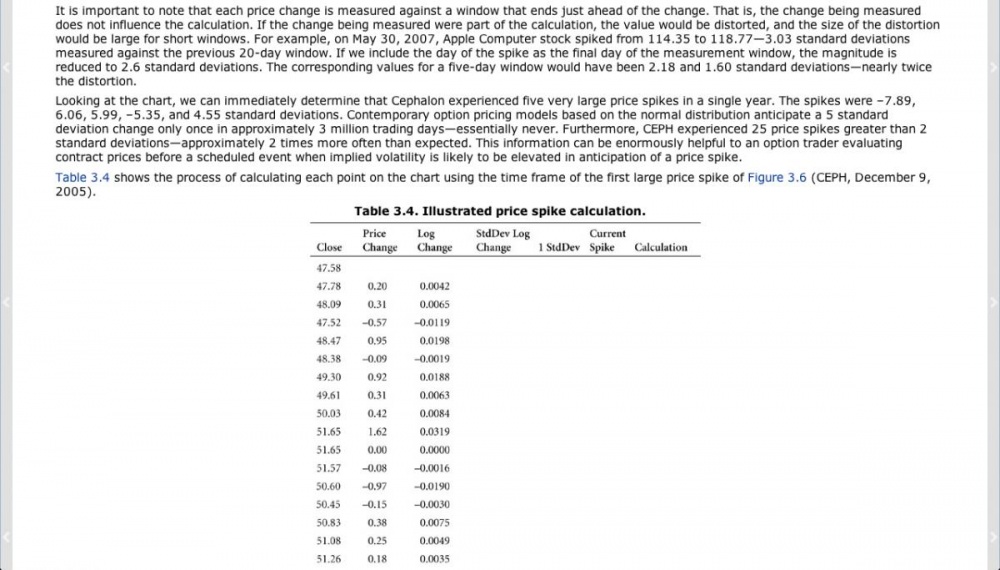
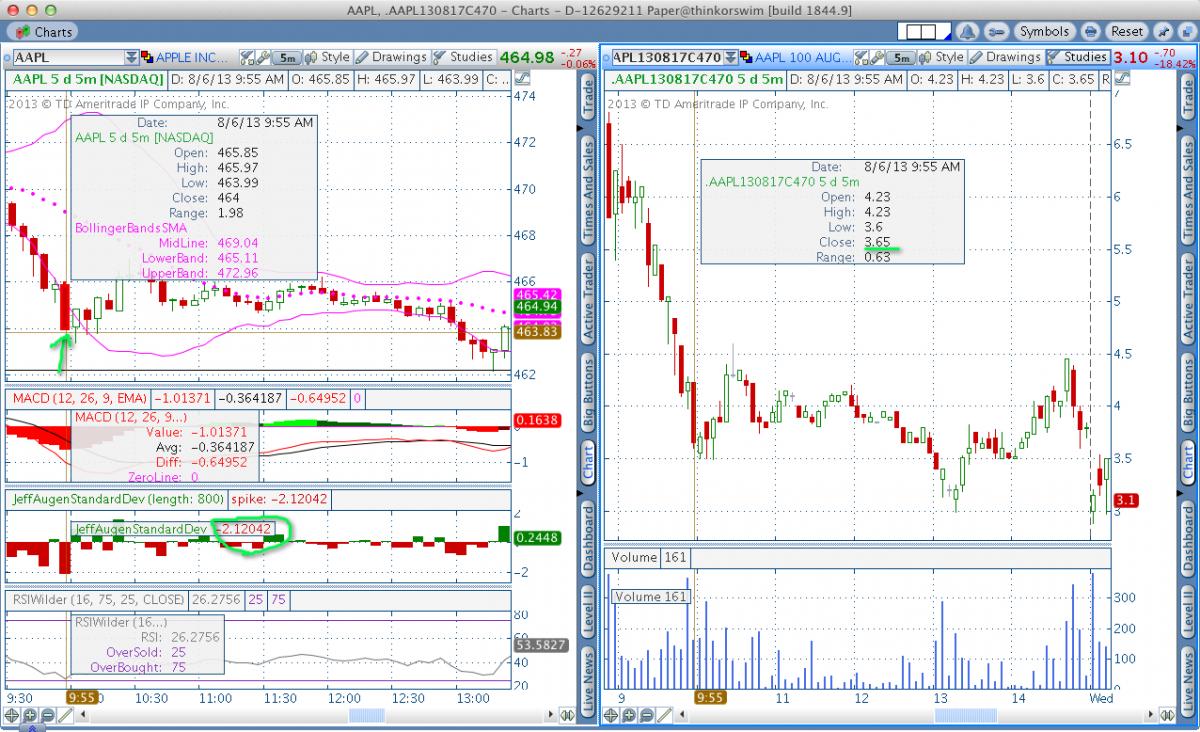
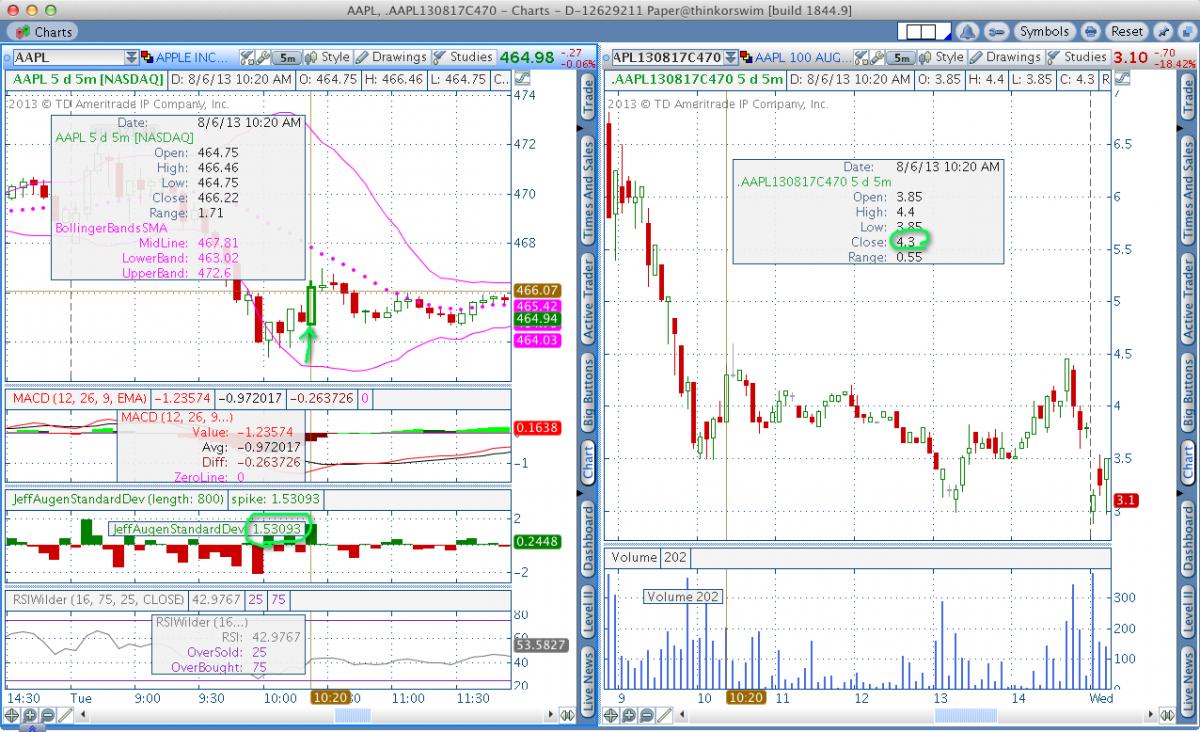
Background In Jeff Augen's Volatility edge, he often used a standard deviation plot to look for spikes. He also discussed it in managing basic option positions and using price spikes as triggers to enter. (it starts on page 113 of the actual book if you are interested in reading it). I post a brief synopsis below (straight from his book, because i have the eBook version). The Mechanics of the Std Dev Study The following is directly from the book, to give a better idea on how he came up with the idea of this study. The ToS Script To turn on this study you have to go to ToS program > Charts > Studies > Edit Studies > New > thinkscript editor and paste the following code in. Then just save it as whatever you want to call it and add it to studies on lower subgraph. Credit to this guy who wrote the script: http://www.thinkscripter.com/indicator/standard-deviation-price-change # Tom Utley 3-17-2009 # Thanks to Jeff Augen # Price Spikes in Standard Deviations declare lower; input length = 20; def closeLog = Log(close[1] / close[2]); def SDev = stdev(closeLog, length)* Sqrt(length / (length – 1)); def m= SDev * close[1]; plot spike = (close[0] – close[1]) / m; spike.setPaintingStrategy(PaintingStrategy.HISTOGRAM); spike.AssignValueColor(if close > close[1] then Color.UPTICK else if close < close[1] then Color.DOWNTICK else GetColor(1)); This is how it looks like in ToS live Example with AAPL Aug monthly 470 Call Possible Entry on greater than 2 STD downspike Possible Exit on spike 25 minutes later (or set your own p/l% with a limit order)