cwerdna
-
Posts
412 -
Joined
-
Last visited
-
Days Won
5
Content Type
Profiles
SteadyOptions Trading Blog
Forums
Everything posted by cwerdna
-
Besides the above, I just got an alert on TOS saying that US equity and options markets will be closed Monday, Oct 29th. Right now on http://www.cboe.com/...us/default.aspx it says: Uh oh.... I do wonder what'll happen as I do have a few open positions that would've needed to be closed by EOD Monday and some by EOD Tuesday.
-
In TOS, under Monitor > Account Statement, if you scroll all the way to the bottom, it'll list Commissions YTD. I'm currently at $6251.55 in commissions YTD. I got moved to for $1.25 contract earlier this year (I think in June).
-
^^^ http://steadyoptions...__160#entry7285 was the reference to the insane # of trades/month. Unless I'm misreading your post, I don't see anything in it about how much in commissions you're doing. I was doing over $700/month in commissions on TOS when I was being charged $2.95/contract, before I got it lowered. Feel free to answer and continue the discussion in the thread I pointed to.
-
In at $3.43 and $3.42 earlier this morning. Wow. $1/contract (I'm assuming no ticket charge) is very good. Don't mean to derail this thread too much, but about how much in commissions were you doing a month with them? I haven't tried complaining to get my $1.25/contract any lower, but there was one guy here who was at $0.70/contract on TOS but he was doing in INSANE # of trades/month. I don't think most mere mortals can get that rate. I think he also get it before TOS was bought by TD AM.
-
Trading and getting fills with Interactive Brokers
cwerdna replied to cwerdna's topic in General Board
^^^ I can't say I like most of IB's interface very much. I tried Mosaic very briefly and found it very confusing and busy. It adds a TON of crap (items) to my already overloaded taskbar. I think a lot of the documentation on IB's site is based on TWS, so I've switched to that. I've never tried their web trader. -
Trading and getting fills with Interactive Brokers
cwerdna replied to cwerdna's topic in General Board
I'm assuming you have a separate tab set up for your straddles and strangles (don't need a separate one for each trade). Right click on the row for your straddle/strangle, then select Charts > New Chart > Chart this combo now. I'm no guru of IB at all. I know how to use little of it (compared to my TOS knowledge). -
I think it's because of dividends. Go to the chart and notice when the dividend was issued. Also look at http://finance.yahoo.com/q/hp?s=ABT+Historical+Prices. Look at the close and adj close columns for those dates.
-
Trading and getting fills with Interactive Brokers
cwerdna replied to cwerdna's topic in General Board
Yeah, it's goofy that IB complains about that. TOS has no problems w/me having buy and sell orders open on the same time on the same trade. I've found that it's less work to Pause Execution (right click on the order), place your opposing order, then click Transmit. -
Trading and getting fills with Interactive Brokers
cwerdna replied to cwerdna's topic in General Board
FWIW, on this subject, a day or two after I wrote the above, the "day trades left" field in TOS changed to 1 and the TD AM web site said "Day trade/round trips: 2 in last 5 days or less". It's moot but I guess there was an update lag. It does seem like TD AM isn't as strict as IB as to what constitutes PDT. -
Trading and getting fills with Interactive Brokers
cwerdna replied to cwerdna's topic in General Board
FWIW, it seems TOS/AMTD doesn't seem to be as aggressive in counting PDT. Today on 9/14, I opened 2 AZO RICs and closed them, the same day. The TOS software says 2 day trades left and the TD AM web site says for me "Day trade/round trips: 1 in last 5 days or less. Why is this important?" Each of the 4 orders were all separate orders (2 at different limit prices to open and 2 at limit different prices to close). It doesn't matter if I get flagged there as I have well over $25K in equity there. -
Interesting... on Options Action on CNBC on Friday (Sept 7th), they were proposing this trade. He wanted the Sept short call to expire worthless. The only purpose was to reduce the price of the Oct 700 call. From what I can tell on the show (which I watch every week and have been doing so for months), they don't really do trades based on rising IV or falling IV.
-
I can't speak to whether a correction is overdue and all that, based on technicals. I'm a total amateur at technical analysis (huge subject: see http://www.investope...rsity/technical, for example) and am trying to get better at it. Some people use RSI (http://www.investope...p#axzz25gRdKH93) to determine overbought/oversold. Some people can see something in a chart that others miss/disagree with. Support and resistance are pretty clear cut and easy to draw on certain stocks, as are channels. Problem w/depending on support/resistance, is you could buy on what looks like a support bounce, but then it could fall and fall below support. You could sell at resistance, only to have it break thru (higher)... I don't think there's a 100% accurate silver bullet/holy grail indicator. But, as you can see, looking at 200 D SMA for S&P 500 seems to work pretty well for picking decent entry times and ok for exit. You can try to look at the SMAs for stocks and see how well they work for the stock in question. My technical analysis and options guru friend feels 200 D SMA is too slow for stocks. As a side note, I sell way OTM naked puts for income. He suggested I only do it on stocks that are above their 200 D SMA, essentially as a sign of strength of the stock. FWIW, Investools (at least in their teaser training) tries to pitch their "3 green/red arrows" strategy ( ). You can actually duplicate these studies exactly in TOS w/o paying for anything from Investools. They also advocate some other methdologies, right or wrong. However, from what I understand, as you go thru more Investools training, it further diverges from their 3 green/red arrows strategy + other tools (e.g. Phase 1 and 2 scores, Big Charts). From talking to my friend (same guy), who went thru their "PhD" program, he confirmed that. He also couldn't care less about fundamentals or phase 1, 2 scores and most of Investools' tools (which aren't free).Sorry, I disgress. I only threw out the 3 green/red arrows strategy as an example of techniques some use. If you want more of a flavor of technical analysis, watch some of Jim Cramer's "Off the Charts" segments he does on Mad Money. He's not a technician and doesn't believe in technical analysis (some of it sounds like BS, to non-believers in TA), but he knows some of the basic patterns (e.g. head and shoulders, cup and handle) and basically explains what technicians have showed him.
-
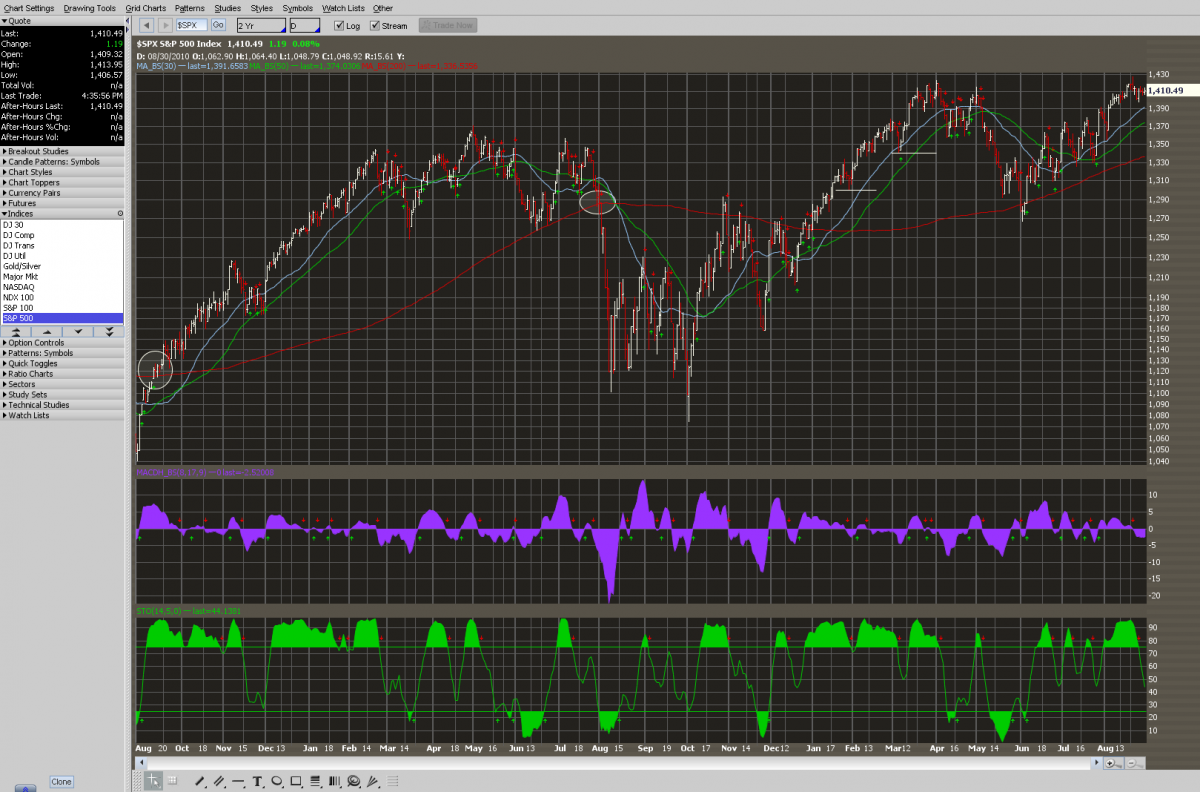
Back to this point, I've attached a 2 year chart of the S&P 500 w/30, 50, and 200 D SMAs (blue, green, red lines). MA_BS(30) == Moving Average with breakout signals (30 days). If you have TOS or some other good charting platform, you can explore how well this works (or doesn't work) further back. If you look at the far left, at ~Sept 2010 and entered when the S&P crossed above 200 D SMA (red line), rode it all the way up and didn't exit until it crossed below at ~August 2011, you'd have lost some of your gains. If you look at some of the points where it crossed the shorter MAs (30 or 50 day) perhaps you could've taken some gains there and saved yourself some of the downside of waiting until the 200 D SMA crossover. The same thing is if you entered at ~December 2011 and got partly out at mid-April 2012, instead of waiting all the way until the cross below at June 2012. Again, this is much easier to see using the TOS app, since you can zoom in/out, move the crosshairs around, change time periods, etc.

-
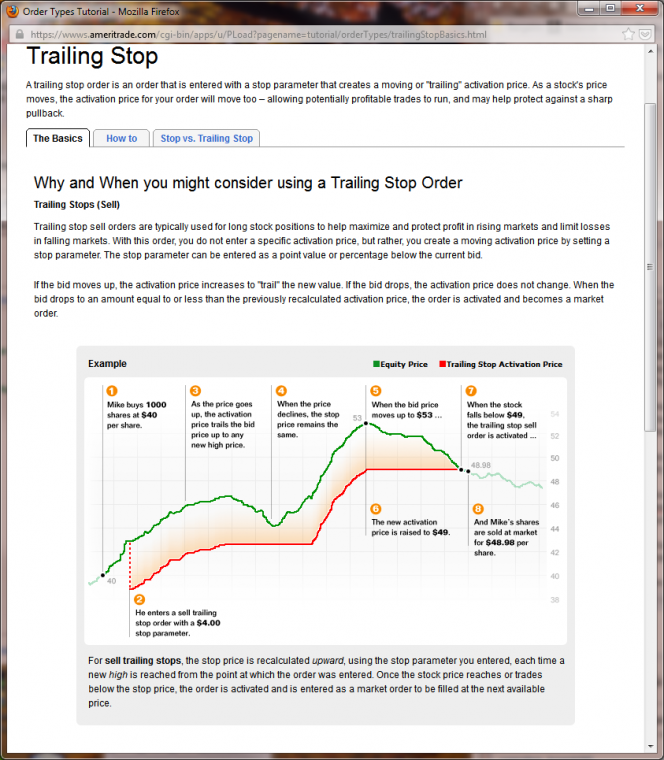
Not all brokerages have always let you set trailing stops. I started w/Datek in 1997 and after a bunch of buyouts/mergers, it became TD Ameritrade. I'm pretty sure that before 2000 or maybe even as late as 2004, they didn't have trailing stops. I haven't had a chance to look at all the posts in detail, but I feel http://www.vantharp....tion-sizing.asp is worth a look. I didn't totally understand position sizing and risk until I went to a free TD Ameritrade seminar (partly intended to suck you into paying for pricey Investools training). I agree w/those principles there (even though, I admit I should be following them more strictly). At the free seminar I went to, they advocated something like this: if you buy a stock, set a stop loss order for 20% loss. So, for example, if you buy $1000 of stock, set a stop loss order for $800. That way, your max risk is $200, not $1000. Of course, there's always the danger that you end up buying high, selling low, and have the stock rebound later. Those losses can add up. However, it keeps you from riding a stock all the way down (I've had some companies go bankrupt or have MASSIVE losses due to the .com crash, and still haven't returned). It also keeps you from selling once you've incurred a big loss (say 50 or 60%) and decide to throw in the towel. I'm not saying you should do this, but keep it in mind. There's a good tutorial on TD AM's web site on trailing stops. Unfortunately, you need to have an account to see the page (https://wwws.ameritr...StopBasics.html). I attached a bitmap of the relevant part. The only problem w/trailing stops is those activation points aren't based on any technical analysis, just a fixed % or point value away from the highest bid price. You could get stopped out too early. And, of course, there's still the danger of buying high and selling low(er), if you buy and the stock does nothing but go down from where you bought it at.
-
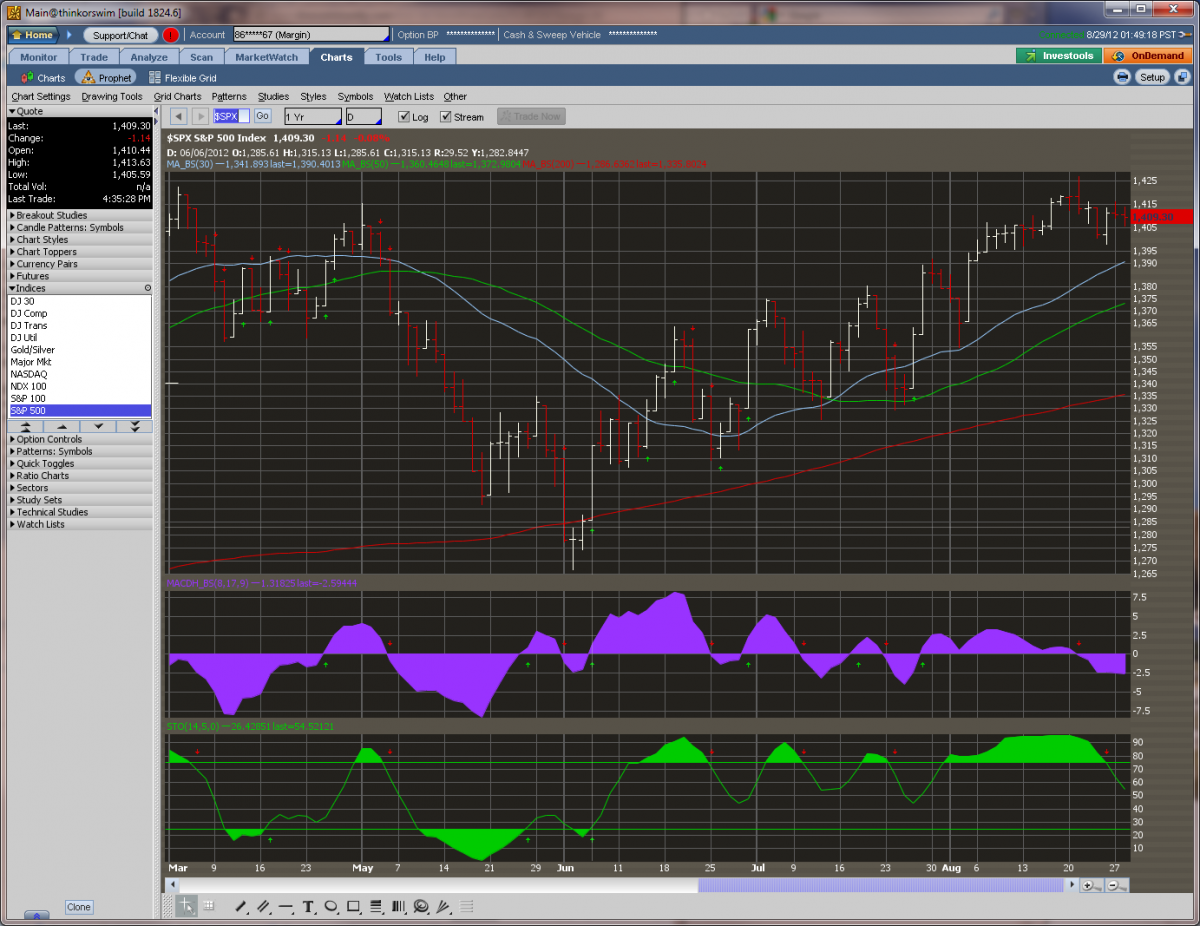
I don't have great answers for you on risk management even though I've been investing in stocks since 97, I still consider myself to be not that much better than an amateur. I've made a lot of mistakes over time. I don't have much time to write about this right now, but I had a debate/discussion w/some other people on a non-investing forum about "buy and hold" being a terrible idea. I basically asserted that one can find better times to enter and exit the market. It's near impossible to find the top or bottom, but still. To quote from my post there: and from a later post (made on June 1, 2012): Since it was hard to illustrate, I ended up making these YouTube videos (on June 1st, 2012). And I said: I really wish I knew about the 200 D SMA as being a decent indicator about the broader market YEARS ago and I wish I knew about TOS when I started investing. It would've saved me a LOT of pain. I recently did look at the 200 D SMA a bit more vs. a few shorter duration moving averages (e.g. 30 or 50 day). Perhaps a decent rule could be something like this? Enter the S&P 500 (e.g. via SPY) when it crosses above 200 D SMA but take some off the table after a long run up if it starts crossing below the 30 or 50 day and exit completely when it crosses below and stick to the rules. This shorter MAs really hadn't occurred to me until more recently. If I had only stuck to my guns about the 200 D SMA rule, I'd be better off. Take a look the attached chart. S&P 500 crossed above the 200 D SMA (red line) on 6/6/12. Back to funds, here are some examples (not recommendations) of funds that didn't do so horribly in 08 and in down years. Be careful, some of them have changed managers. http://finance.yahoo...FSX Performance http://finance.yahoo...pm?s=BERWX&ql=1 http://finance.yahoo...pm?s=FBRVX&ql=1 http://finance.yahoo...CKX Performance Since Yahoo Finance doesn't include 2011 performance yet (for some reason), you might want use Morningstar instead (http://performance.m...A&culture=en-US, click on Expanded View). Yeah, I've made big mistakes on names like C where when I bought them, I thought "this is one of the biggest banks in the world. They've got to be doing something right." Boy, instead I'm sitting on a huge % loss as I didn't sell.
-
Trading and getting fills with Interactive Brokers
cwerdna replied to cwerdna's topic in General Board
I too got bit by the PDT crap on IB due to the lame SEC/NASD requirement. I had no idea I was even in danger of it until I it was too late, when I received an automated email after the market closed. When I created a ticket to request a reset, they told me I "wouldn't be able to trade" until next Wednesday (!) due to the holiday on Monday. So, forget it, I'm just going to add more funds and not waste my reset. The FAQ indicates that I should be able to initiate transactions to close positions. Hopefully that means I can place multiple limit sells to close some long straddles I have. Of course, I didn't even know about the indicator mentioned at http://www.interacti...n&ib_entity=llc under Day Trading > Day Trading FAQs, because that indicator isn't on by default in the account window. You have click the + on the right side of Available for Trading in the account window to see it. You can then check the checkbox to enable it. Booh! At least TD Ameritrade (on their web site) is pretty clear with the text in a yellow box.I think what took me over the edge was me buying some JOY straddles at various prices today then selling them the same day, also at various prices. Lesson learned and warning for everyone: If you're going to have a net liquidation value of under $25K in your account, make sure you have another account somewhere else (so that you can continue trading until you get reset or funds make it over) and set aside some $ to bring it above $25K. I'm guessing (but am not sure) that unfortunately, each leg of a multi-legged transaction ends up counting towards a "day trade". So, I'm guessing that if I buy a straddle and sell it the same day, I already have 2 day trades right there since I opened calls, opened puts, sold calls and sold puts. -
Trading and getting fills with Interactive Brokers
cwerdna replied to cwerdna's topic in General Board
The bolded part is highly unlikely. Good luck finding one, esp. a reliable one. The only simulator I'm aware of is w/iOS SDK (http://developer.app...pplication.html). No idea if it can run 3rd party apps (ones you didn't write). Even if you got the iOS version of IB's app to run in the above simulator on a Mac w/the SDK installed, there's still the connectivity issue. Temper may want to look into using his own laptop (to run full blown TWS) w/a mobile wi-fi hotspot device (e.g. http://en.wikipedia.org/wiki/MiFi) or USB dongle that provides 3G (or above) service. Have you tried mucking w/the proxy server settings in TWS? Click on "show all fields" at the first dialog. And, yes, your IT people would likely need to enable certain ports to be forwarded or opened up. -
Trading and getting fills with Interactive Brokers
cwerdna replied to cwerdna's topic in General Board
Amend, yes. I've had to use the iPhone version of IB's mobile app to change the limit sell prices on some strangles or straddles before. I only had to do it as I had to be somewhere away from my PC on a day that I need to close out a position. It's pretty bare bones compared to using (desktop) Trader Workstation, so I can't speak to how good it is for placing trades. If you're going to get an iPhone, I'd highly recommend waiting for Apple's announcement, which is also certainly going to be Sep 12 (see http://www.macrumors.com/). It seems likely it'll be available for sale ~Sept 21 to 30. I would NOT buy any iPhone right now, esp. not the 3GS nor 4. If you get the 4S, you'll be a generation behind whatever's the most current after the announcement. (I have an iPhone 4 that I bought >2 years ago and will be upgrading to whatever the next iPhone is called (e.g. iPhone 5, "the new iPhone", etc.)) -
I see. Well, I really missed the boat there since I joined TOS way after the buyout happened. Re: hedge fund, ok, that's insane. I don't do anywhere close to that # of contracts a month. I did get TOS to lower mine to $1.25/contract. When I was paying $2.95/contract on TOS, I was doing $700+/month in commissions. Yeah, $0.50/contract seems impossible for mere mortals. You're lucky you lucked into such great rates. If I got $0.70 or $0.75/contract on TOS, I'd most likely leave IB.
-
I don't want to go OT, but can we discuss the above further at http://steadyoptions...__160#entry7243? The TOS rate you list sounds too good to be true. I'd probably close my IB account if I could swing that good a deal on TOS. I like TOS a lot better. As for IB...well, $0.70 is the standard, but what I'm charged is all over the place... It still seems to average <$1 for commissions though. The things I don't like at IB are the stupid cancel/modify fees and how execution credit supposedly is only applied for cancels/modifies same day. Thus, I'm pretty leery of canceling/modifying my non-spread orders. It's ridiculous that the cancel/modify fee is greater than what they charge for a trade the goes thru.
-
During the earlier days of the TOS/TD AM integration, once all the account management stuff went away from https://www.thinkorswim.com and TOS accounts had to go to www.tdameritrade.com instead, I'd get false positive Reg T violations ALL the time on the TD AM web site. I called them about it since I didn't even understand what it meant. In my cases, after talking to them, they were false alarms for me and I just learned to ignore it for months. I knew I had plenty of cash in the account, I don't short stocks and it wasn't in danger of going into margin call. dwilliams8649 http://steadyoptions.com/forum/topic/454-jeff-augen-weekly-strats/#entry7224 asserts I wonder how large it needs to be. I know of nobody having it that low. If I had that type of deal, I'd probably close my IB account.
-
There was a great table in some Investools training (I shouldn't put it up, since it's copyrighted) but the first table at http://www.optionmon...ions_basics.php is similar to it, discussing right and obligations, depending on your position (buyer/seller) and put vs. call. If you sell a naked put, your max loss is capped at the (strike price * 100) - premium received. So, if you sold a put at a 100 strike, and received $500 premium, and the stock fell to $0, if you hold it until expiration and it expires ITM, you're going to be assigned 100 shares at $100/share, so you're going to pay $10,000 for stock that's worth $0. But, you did receive the $500 premium, so you lost $9,500. If you sell a naked call, your max loss is potentially infinite. Let's say you sell a naked call on a stock at $100 strike. Since it's naked call, you don't have any to cover it. If the stock hits $1000 and you're assigned, well, you've got to buy shares on the open market at $1000/share to give to the other guy but only be paid $100/share. If you use Thinkorswim, in the options buy/sell confirmation dialog, it'll tell you your max loss and max profit for most options trades. There are some types where it won't but for selling or buying calls or puts, it will. I'm an options amateur too, and I'm not scared of selling way OTM naked puts on stocks that I wouldn't mind owning that are no more than ~50 days way from expiration. I've made a decent amount of $ (but use up a LOT of buying power) and have almost never lost $. One MUST be careful about earnings though. I almost never ever sell naked puts that expire after earnings. I just don't enter the trade and wait for earnings to pass. I have never sold any naked calls yet. I'm scared by that. Back to assignment, another consideration for some (depending on brokerage and position size) is the assignment/exercise fee, if any. For TD AM/TOS, on small positions, being assigned can suck. See http://steadyoptions...ade/#entry6183. It's best to contact your brokerage to understand what will happen when assigned, esp. if multiple legs expire ITM.
-
It looks like I can't send referrals from my TOS account (have to login from the TD AM web page). But on my old TD AM account, I can. They need a first name, last name and email address. If I'm the first, send it to me via private message. Hope you're ok w/whatever commission you're going to get.
-
Trading and getting fills with Interactive Brokers
cwerdna replied to cwerdna's topic in General Board
Is there a way to get Trade Log to go back further than a week? I'm looking for some view that nicely shows combo trades I made in the past. Trade Logs does it but seems to have that week cutoff. -
^^^ I knew about the $1 minimum, but didn't realize your other points. So, if I do a 2-legged spread w/1 contract for each leg, my commission should be $2 min (in total)? A RIC or IC of 1 contract per leg would be $4 min (in total)?