Mikael
-
Posts
650 -
Joined
-
Last visited
-
Days Won
12
Content Type
Profiles
SteadyOptions Trading Blog
Forums
Everything posted by Mikael
-
GOOG 52 wk IV percentile is 9% right now. What do you think about putting on some calendars on GOOG like the IBM trade? possible news which may cause the stock to move: BBBY is now officially up for sale, i'm guessing GOOG / AAPL are both interested.
-
Does anyone know if it's still 1.50 for SPX options? because that's what IB charges for SPX trades, and i'd rather use ToS for SPX trades because the platform is way better. I sent him an email asking for $1/contract no ticket fee, and i'll transfer 300-400k over to ToS.
-
wait, we can get 1.50/contract with no ticket? how do we get the SO rate? I'm paying 7 bucks + 0.75 per contract.
-

Jeff Augen's StandardDEV study for ToS (thinkscript)
Mikael replied to Mikael's topic in General Board
okay i see it now, i didn't see the first post before. this is very interesting and can directly affect our earning plays, maybe Kim can chip in if he gets around to reading this. -
Jeff Augen's StandardDEV study for ToS (thinkscript)
Mikael replied to Mikael's topic in General Board
what time frame do you have the chart set on? so entry on the 5th day before earning if spike (either way) < 1.7 STD -
Jeff Augen's StandardDEV study for ToS (thinkscript)
Mikael replied to Mikael's topic in General Board
hi Samerh, thanks for sharing. Just to clarify do you mean entering into ATM straddle positions 5 days before earnings and holding it until day of earning on the stocks you listed? Or are you talking about a signal or ratio based on (IV-HV20) / LM? -
If IV goes up alot, its likely the price gld will have gone down a bit. So ur short position will be down. Hal I believe if you are on the ratio the effects of increasing IV and paper loss on the short will be somewhat offset by your long position. But I would check your overall position vega The overall position should still be downside bias ESP if your on the ratio. Look at the overall delta on the position. This trade won't do well if GLD is on a huge rally since its impractical to constantly roll up your long position. At some point you would be over allocating the trade
-
Jeff Augen's StandardDEV study for ToS (thinkscript)
Mikael replied to Mikael's topic in General Board
I think one way to use this tool for earnings could be to measure the STD spikes as we get closer to earnings. If for example stock XYZ has many spikes greater than 2 STD (more than the expected 5% of the time based on prices being normally distributed, ) in some # of days leading up to earnings for the past 4 cycles, it's reasonable to assume in the days leading up to earnings for the next cycle, we can expect the stock to move around a bit. (eg. many 2+ STD spikes again). So in this case, maybe we can enter the straddle using weekly options that expires right after earnings (or close to it) to maximize possible gamma gains from rolling. I haven't done the math but i suspect AAPL might be a good candidate. Also maybe we can put on the straddle earlier if it's possible to realize substantial gamma gains. but we have to develop some kind of system where it calculates the average # of spikes up and down (based on some STD dev criteria, like 2STD spikes on hourly charts or something). it's my understanding that the BS option pricing models assumes the lognormal distribution. so prices should fall within -1.75 and +2 spikes 95.5% of the time. so maybe we can program is according to this parameters (look for price spikes greater than -1.75 and +2 sigmas). in terms of discounting past spikes near earnings, why do that? the price spikes are random anyway, i don't see why you would take on a contrarian view. if based on past earnings, the price spikes are increasing as we get closer to earnings, it's reasonable to expect the same to happen as we get closer to earnings this cycle as well. we can just use it the same way we look at IM right? -
Jeff Augen's StandardDEV study for ToS (thinkscript)
Mikael replied to Mikael's topic in General Board
I reorganized the first post with additional information and screenshots for those who are interested. The first time i was just typing out loud so hopefully this makes grasping the idea easier. -
http://stockcharts.com/school/doku.php?id=chart_school:technical_indicators:moving_average_conve I learned everything about chart reading from that website. it's a very good resource for all things related to charting. it's also free I basically just use those 3 indicators you mentioned. I always have the MACD and RSI on, plus a SMA. Now i have the custom augen study on as well. the Bollinger band is good to use as well. works especially well in conjunction with the Augen study.
-
ToS paper doesn't give live quotes though. So it's better just to open a live account for a small deposit and get the live quotes.
-
Jeff Augen's StandardDEV study for ToS (thinkscript)
Mikael replied to Mikael's topic in General Board
Hi Richard, Glad you found it useful. Yes, you can adapt the system to any length of time. Obviously your strategy will be different but the general idea is the same. In his book, he used the spikes as entry indicators for GS on a 1 day / 1 year graph. I don't know much about the scripting language but i found some resources which may help you if you want to write some scripts: http://www.thinkscripter.com/ <- writes custom scripts, some for sale other for free. they also have a forum you can check out https://www.thinkorswim.com/tos/thinkScriptHelp.jsp?laf=bright (ToS offical guide) http://steadyoptions.com/forum/topic/1130-discussion-vxx-put-trade/page-4 (we made another script for the VXX and XIV trades, check it out if you are interested) -
Jeff Augen's StandardDEV study for ToS (thinkscript)
Mikael replied to Mikael's topic in General Board
by the way if you want to try paper trading this way make sure you pick a stock that 1. very liquid, otherwise slippage will be way too high. 2. kinda of volatile (otherwise you will never get any good price spikes to work with on the short term, otherwise you have to go longer term and then time decay etc. all become problems, so i don't want to deal with that) so far i only tried with AAPL (best choice) because of the number of price spikes and the options are very liquid. also GOOG would work. the index options like SPY etc. don't work too well because they trade fairly flat. also you need really tough stop-losses in place (just like if you are trading stock should always have stop losses in place). and need to have a profit taking strategy. i just use 20-25% as a guideline, don't really look for uptick price spikes as much. -
Jeff Augen's StandardDEV study for ToS (thinkscript)
Mikael replied to Mikael's topic in General Board
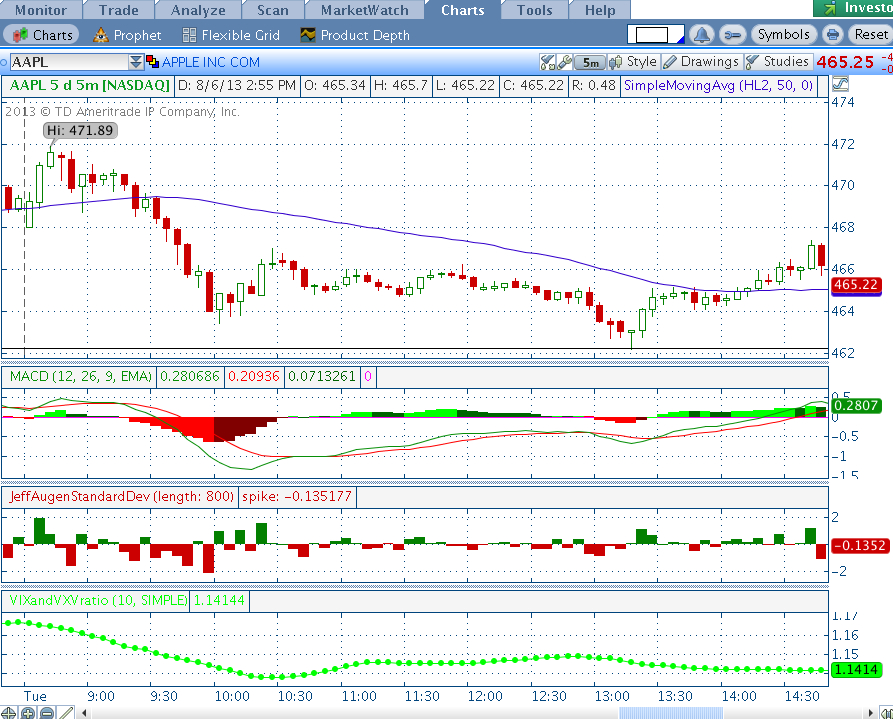
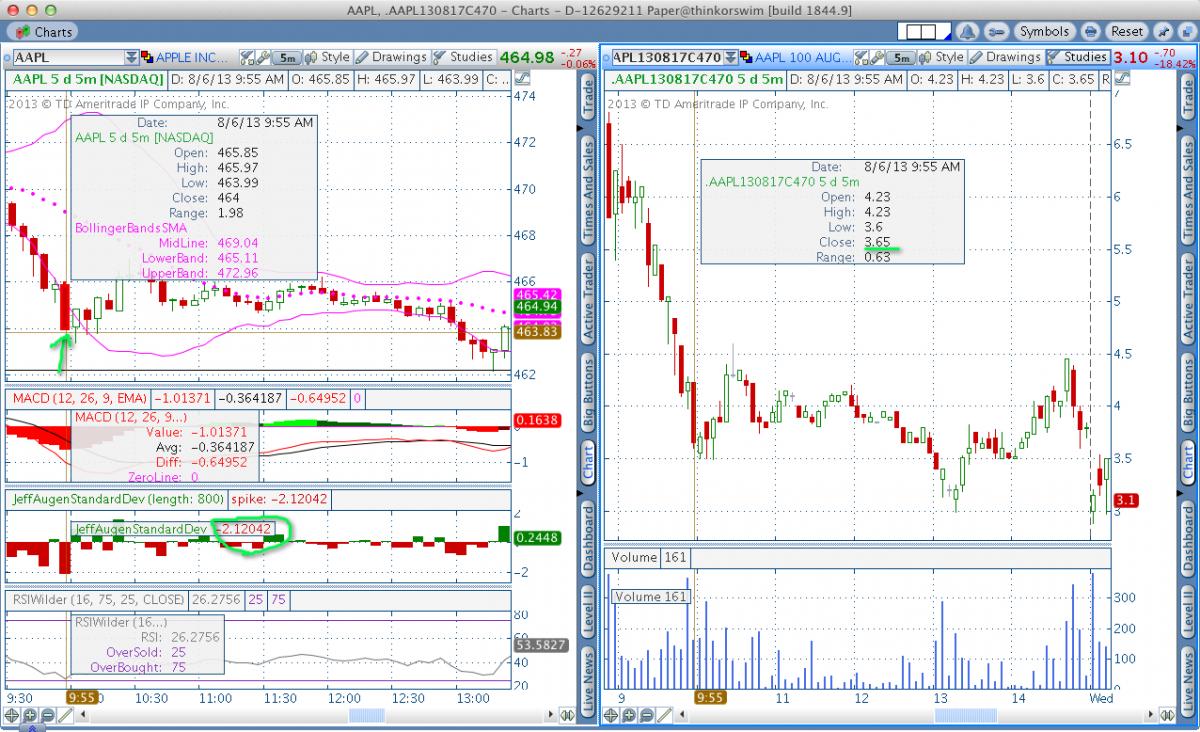
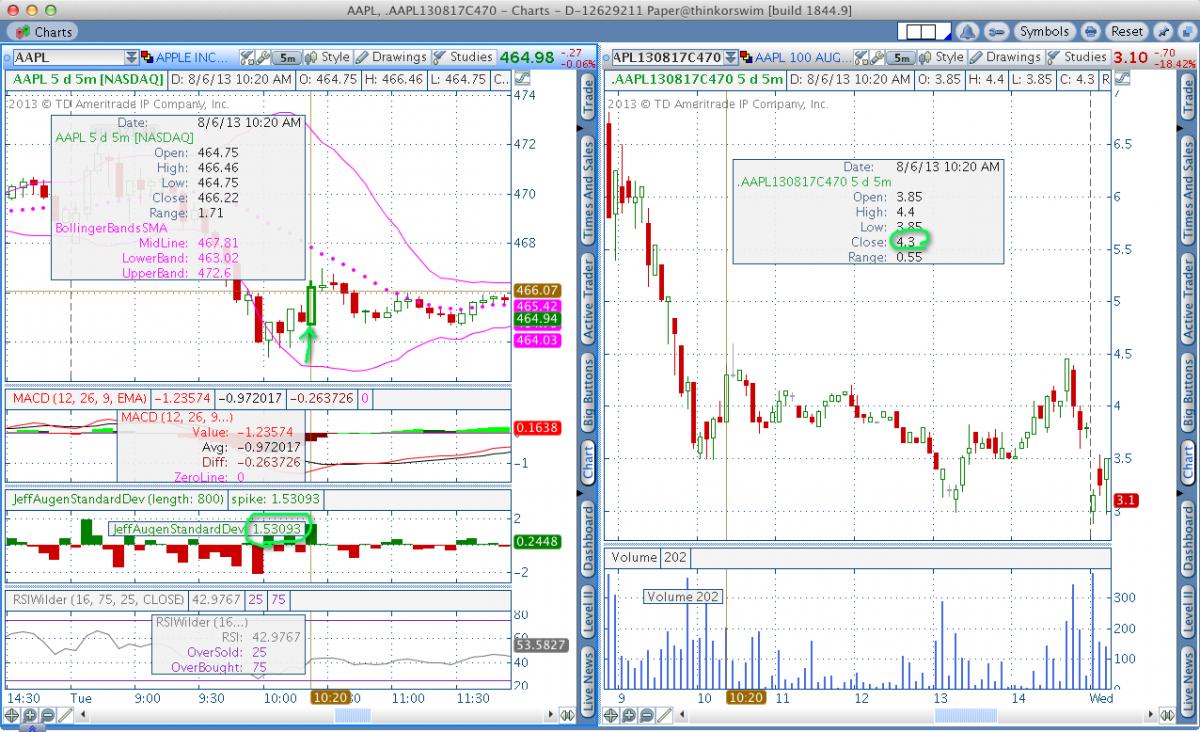
Hi Red, i haven't read that book yet but i did read his the volatility edge in options trading. (he actually discuss pre-earnings straddles/strangles which is also relevant to SO trades). he also discussed about the trading options on expiration day in this book. not sure if he talked about the samething in TOAE, but i suspect it might be similar. basically, options lose the most value on the thursday evening and expiration friday. and many stocks exhibit a "pinning" effect on Friday. (he said it's because of institutional traders unwinding large complex positions or something), anyway not too sure of the exact reasoning behind it but he gave an example using google and said basically stocks tend to exhibit a pinning effect on the higher option strike on expiration fridays. (so for ex. if goog is trading at 912 friday morning, it is likely to trade at around 915 for the entire day.) so in this case, he's saying on friday it's good to short the expiring option to extract the last remaining value in it. so you'd short a OTM option on this day. Obviously if the IV is higher the more premium you are going to get so this strat would work better in the high IV environment, but i think it would still work in low IV environment you just won't get alot of premium. the std bar thing is just the way he looks at price spikes and he describes a system to use it as an entry and exit signal. i think this kind of signal can work in any market type. the basic premise is since options are priced according to STD of the underlying price, whenever your underlying spikes up or down (2+ STD) you should use it as a entry or exit signal. most short term price ticks tend to be mean reverting, if you have an especially large down or up tick, it should revert back to the mean price. (not always but that's the idea). 2STD is quite a big spike (think about it, if the prices are normally distributed a 2 std spike only should happen about 4.5% of the times). obviously most stock prices are not normally distributed. the point is that is a pretty big up down tick and you can take advantage of the mean reverting trend. (you also need to assess not only based on this study but your other technical indicators, like MACD RSI etc.) since you have to pick a direction otherwise you can't use the spikes as signal. the downside is it's very hard to guess medium to long term direction, and i'm usually wrong on market predictions so i'm kinda of adapting this system to be way shorter term. thus using the 5m charts and trying to close trades within 1-3 days and keep position size small). btw this system is very directional so it's not at all similar to the SO strategies. it's basically the same thing as trading stocks. if you have a big account you can use 1.0 delta options, but for expensive stocks that's too expensive for me so i'm using 30 delta otm options instead. as a example i have been using AAPL aug 17 470 call option. you can see the price of the contract ranged to 3 - 7 today. that's a huge latitude you have to work with. then look at the jeff augen study. the entry signal would be the down tick around 10 today. it was more than 2 std downtick. your exit signal is up to you. you can take profit at a certain p/l% or exit at 1 STD deviation uptick around 3:40.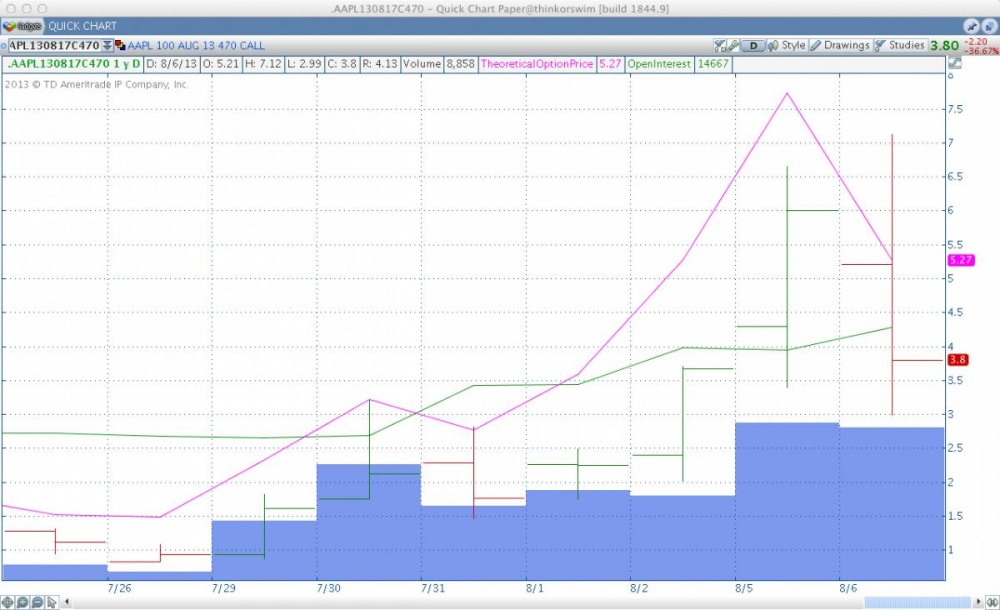

-
Jeff Augen's StandardDEV study for ToS (thinkscript)
Mikael replied to Mikael's topic in General Board
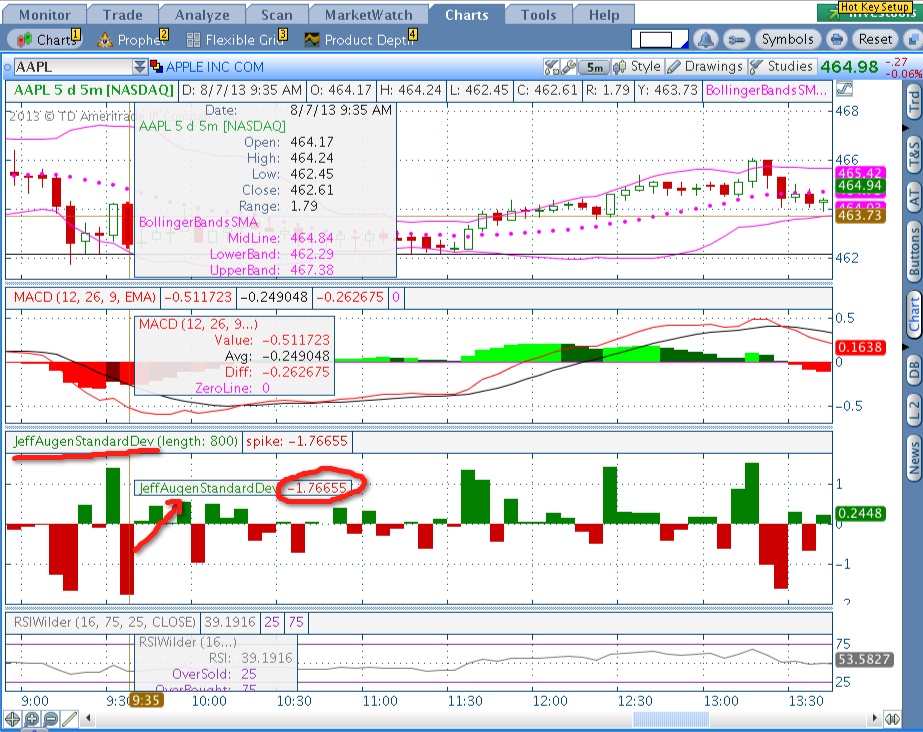
for anyone that's wondering, i'm using the 5 minute, 5 day charts with the study set at 1950 periods (which corresponds to exactly 5 trading days). So i'm measuring the standard deviation on the price spikes based on the prices of the previous 1950 ticks (5 min per tick x 12 x 6.5 hours in a trading day x 5 days). -
Jeff Augen's StandardDEV study for ToS (thinkscript)
Mikael replied to Mikael's topic in General Board
decided to try with just straight calls and be a little more conservative on the profit targets (calls are all 1 strike OTM). enter on downticks greater than 2 STD. exit on upticks greater than 2 STD or when 20% profit has been reached. For instance this morning i entered around 9:40 at 4.8 debit for the Aug monthly 470 call option because the downtick of 2.5 STD 60 minutes before market open, followed up 7 upticks all the way until market open. this is telling me there's going to be a strong uptrend right after market opens. so i bought that call as soon as it opened and it was priced at around 4.6 but couldn't get filled so i moved it up until 4.8 and it got filled. around 9:40 there was 3 consecutive upticks with 2 of them greater than 2.0 STD and AAPL. this is strong exit signal. AAPL ended up around 478ish (from 476ish @ open) and the called was priced around 5.7 so i exited my position. in hindsight it was probably better to buy the option with a bit more time in case AAPL is rangebound for the next few days. although if you look at the price spikes on AAPL, you are going to get some movement no matter what. since it's in a pretty strong uptrend recently i decided to be bullish along with the rest market and do it with calls. -
Jeff Augen's StandardDEV study for ToS (thinkscript)
Mikael replied to Mikael's topic in General Board
Haha you are using some of his strategy without knowing it. SO earning trades is one of his strategies. (tho Kim could have came up with it himself too lol) Definitely recommend you to read this book by him. http://www.amazon.ca/The-Volatility-Edge-Options-Trading/dp/0132354691 Overall his a very mathematical and statistically driven trader. But he has a mix match of trading strategies so I don't see a central tenet really. -
Jeff Augen's StandardDEV study for ToS (thinkscript)
Mikael replied to Mikael's topic in General Board
Thanks Paul. The idea behind Jeff Augen's "Using Price Spikes as Triggers" is actually a pretty simple. He plots prices according to # of standard deviations away from the average prices for the past X peroids (you define the length in the study). So basically he's saying it's a good idea to use big up or down ticks to open or close positions. What i have been doing with this system is looking at volatile stocks like AAPL. 1. You still need to assess a direction. Obviously for the past months or so AAPL is on a very clear uptrend. 2. For entry: on a downtick greater than 2 std deviations, open ratio call backspread on AAPL using 1 short ITM call, 2 long ATM calls to make net delta around +25-35. 3. For exit: on a uptick greater than 2 std deviations or around 50% gains. it's been working pretty well on paper trading. (obviously since i'm getting the direction right). sometimes on a really big downtick days, if you buy the calls at the bottom, you can often make about 40-50% in a day. Obviously the big risk is if the trend reverses and also the negative theta. To mitigate the theta i have been buying 60 day outs. To mitigate the downside risk i have been doing what Chris been doing with the GLD and SPY ratio trades. I bought a Jan. 450 put and been selling weeklies 2 week out to pay back the "hedge". It's been working okay for the past 3 weeks on paper, but there's so many parts going on in this trade it gets confusing sometimes lol. So basically you are making short term bets based on the trend. (since the trend is up right now i'm betting up) As a hedge against a catastrophic stock collapse like last september, using Chris ratio diagonal/calendar spread setup. -
Jeff Augen's StandardDEV study for ToS (thinkscript)
Mikael replied to Mikael's topic in General Board
Hi Paul, Thanks alot for the code. I put it into thinkscript and now these options appeared! Just a couple of questions: 1. Would it make more sense to set the alert for each tick or bar? I think it should be for the bar right? (we're trying to get alerts for reach time a bar on the study goes above or below 2.0 2. Not sure if thinkscript knows to do this but would it only alert for positive values right now? do we have to explicitly write in alert for both <+2.0 and >-2.0? thanks again! Mike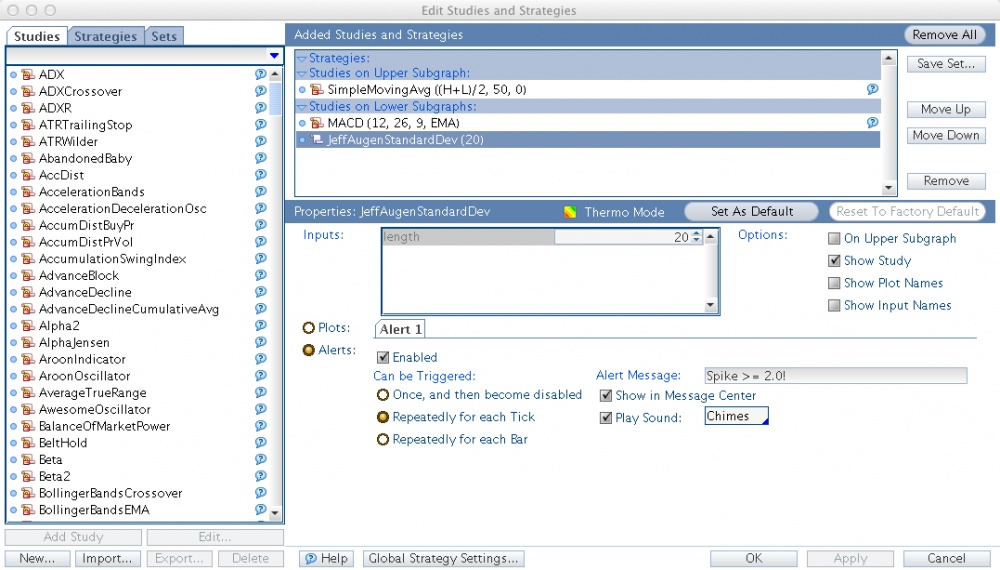
-
Jeff Augen's StandardDEV study for ToS (thinkscript)
Mikael replied to Mikael's topic in General Board
Thanks Paul! I thought the length=20 was the same as the SMA or EMA length (which is usually in days). i'm usually using the hourly charts so 20 bars is just over 3 trading days. that's not a good enough sample size. i'm going to change the length to 70 which would work out to be about 10 trading days on the hourly bars. Paul do you know of a way to put it in the script where ToS would alert you with a sound (or pop-up) whenever the price hits a certain Standard deviation up or down (like 2.5 or 3 for instance). -
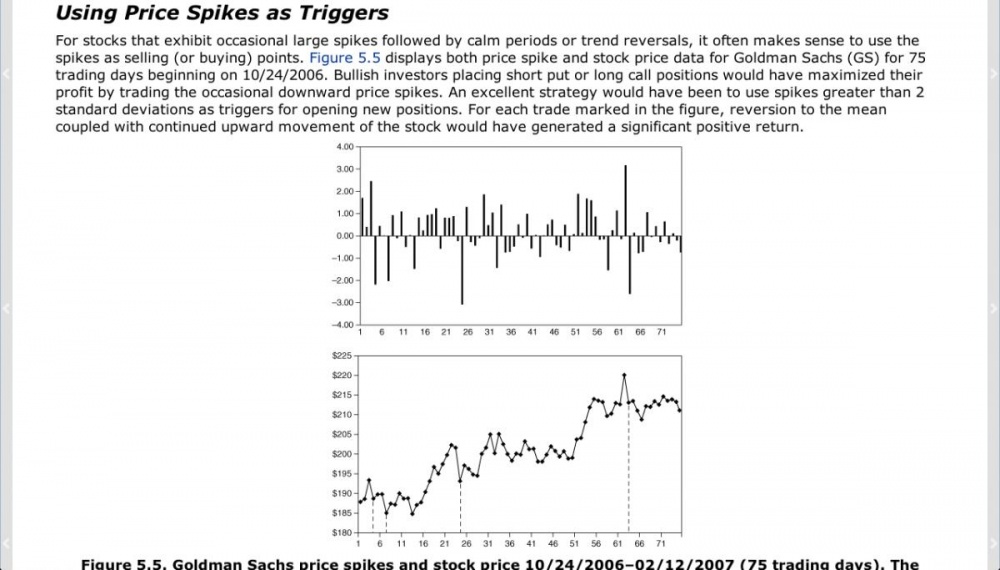
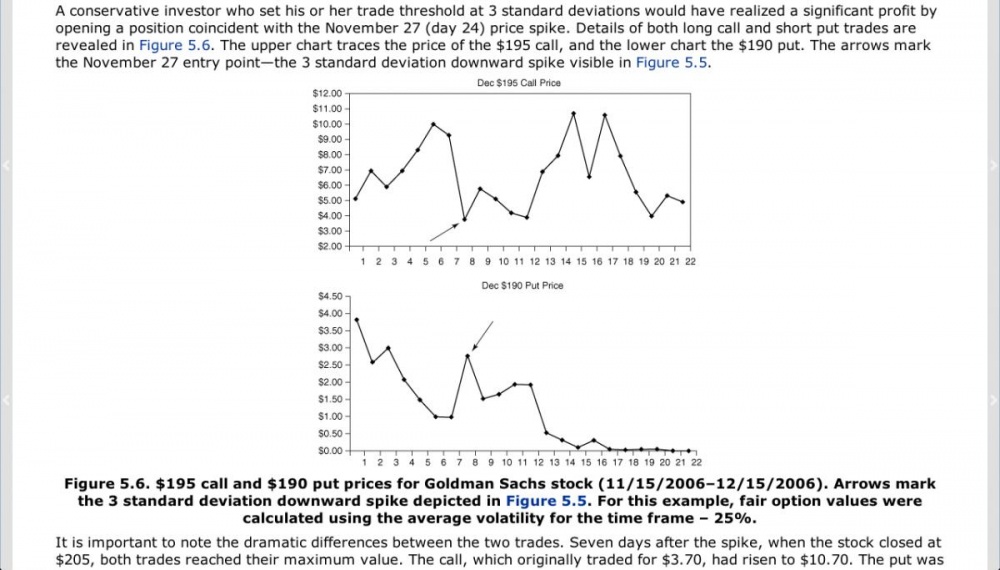
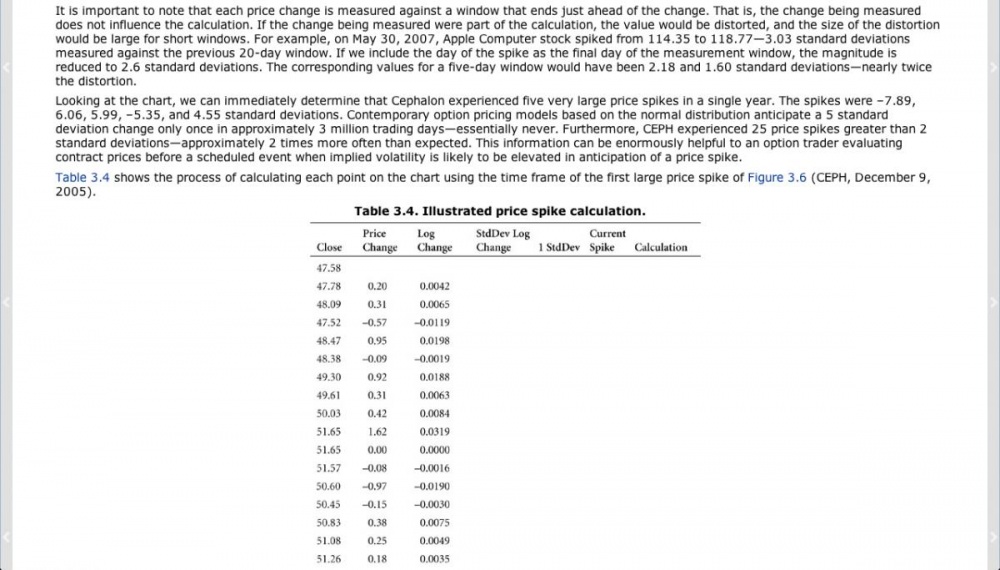
Background In Jeff Augen's Volatility edge, he often used a standard deviation plot to look for spikes. He also discussed it in managing basic option positions and using price spikes as triggers to enter. (it starts on page 113 of the actual book if you are interested in reading it). I post a brief synopsis below (straight from his book, because i have the eBook version). The Mechanics of the Std Dev Study The following is directly from the book, to give a better idea on how he came up with the idea of this study. The ToS Script To turn on this study you have to go to ToS program > Charts > Studies > Edit Studies > New > thinkscript editor and paste the following code in. Then just save it as whatever you want to call it and add it to studies on lower subgraph. Credit to this guy who wrote the script: http://www.thinkscripter.com/indicator/standard-deviation-price-change # Tom Utley 3-17-2009 # Thanks to Jeff Augen # Price Spikes in Standard Deviations declare lower; input length = 20; def closeLog = Log(close[1] / close[2]); def SDev = stdev(closeLog, length)* Sqrt(length / (length – 1)); def m= SDev * close[1]; plot spike = (close[0] – close[1]) / m; spike.setPaintingStrategy(PaintingStrategy.HISTOGRAM); spike.AssignValueColor(if close > close[1] then Color.UPTICK else if close < close[1] then Color.DOWNTICK else GetColor(1)); This is how it looks like in ToS live Example with AAPL Aug monthly 470 Call Possible Entry on greater than 2 STD downspike Possible Exit on spike 25 minutes later (or set your own p/l% with a limit order)


-
Just wanted to update my trades. (i set a lower target of 3% a week for 25 weeks) BTO 50 SPY Jan 18 169 Puts for -7.43 STO 40 SPY Aug 2 169 Puts for +1.26 BTC 40 SPY Aug 2 169 Puts for - 0.35 (extrinsic received = 0.91 vs needed 0.65) *needed 0.65 if stay on 4:5 ratio. STO 40 SPY Aug 2 170.5 Put for +0.86 (this was yesterday) BTC 40 SPY Aug 2 170.5 Put for -0.35 (received an additional 0.51, so net this week received total of 1.42 vs needed of 0.65) STO 40 SPY Aug 16 171 Put for +1.60
-
It seems reasonable to assume GLD IV is not going to rise anytime soon if monetary policy is the main driver. Feds just announced they are pretty much going to keep QE going for at least another couple of months. Looks like an interesting strat thanks for sharing!
-
why not use the web version of your broker's software? i know IB and ToS (and any broker worth the money) would provide a web based trading page.
-
looks like -1.63 to open dbl calendar + 1.24 to close put side - 1.06 to reopen + 0.83 to close - 1.28 to open remaining open +1.31 assume 1.28 still 1.28 market value if liquidate everything today: +0.69 that's a 0.69/1.63 or 42% ROI since 07/25. not bad at all! what are the main risks to this? i'm guessing since it's a dbl calendar and it's not pre-earnings any big move of GLD will be bad. but if you are constantly adjusting i guess this can be mitigated. I don't see GLD gaping too much on openings. any other risks you considered?