All Activity
- Past hour
-
 Ankit Chaudhary joined the community
- Today
-
Few things I wanted to know if anyone can answer this clearly. When ATM calendar is profitable , does DC also be profitable on same trade ? ATM calendar is expected to expand more than DC in general. So was wondering why would someone start with DC ? With DC , one calendar will start loosing as underlying moves and you are hoping the other calendar compensates for loosing calendar. But that hope may / may not come true. There is no gurarantee ? The earnings calendar is not like a regular calendar. The earnings calendar depends on RV expansion.
-

 You still have work to do. You need to build a strategy, test whether it has an edge, and decide how much you’re willing to risk on each trade. AI can speed up testing. You decide whether the results justify risking real money and when to step in if the system behaves differently than expected or market conditions change. In this article, we’ll look at how much AI can change the way you trade options, from building and backtesting your strategy to executing trades, and what the limitations of using it are. AI in financial markets: from institutional trading desks to individual traders Large financial institutions were using automated trading systems long before today’s AI tools. As the SEC’s report on algorithmic trading explains, firms used software to analyze large amounts of market data and automate parts of execution. Research and backtesting: Quantitative teams use historical data to test trading rules before putting capital at risk. Machine learning opened up other applications. In 2018, the researchers behind Deep Hedging explored how a model could adjust a derivatives hedge while accounting for trading costs and liquidity. Fast execution: Some high-frequency trading firms use direct market data feeds and locate their servers close to exchange systems. That shortens the time between receiving a quote and reacting to it. Automated execution can follow programmed rules alone. Today, individual traders can use AI for parts of that work. How far they can take it depends on three things. AI model: Models differ in how well they follow complex trading rules, write and debug code, and how much data they can review at once. For years of options quotes, you can ask AI to write a script that processes the dataset. Data access: AI can help write a backtest. Testing an options strategy requires historical quotes for the strikes and expirations the strategy would have traded. Broker access: You can automate alerts or prepare trades for manual review. To submit live orders automatically, your system needs a compatible broker connection and rules that define when it can act. For example, you might want to know what happens to call prices after a stock breaks out. AI can help you write a script that matches years of breakout signals to the historical options quotes available at the time. You can then compare how calls with different strikes and expirations performed over the next few trading days, without looking up every contract by hand. Integrate AI into your trading system You may come from a background in finance or investing and want to automate a trading strategy without knowing how to code. A few years ago, building an automated trading system often meant hiring a team of developers, explaining how you trade, and spending considerable time and money building and testing the software. Today, you can describe your trading rules in plain English and ask a model such as GPT‑6 Sol in ChatGPT or Claude Fable 5.2 to draft a script. This approach is often called vibe coding. Compare the generated code with your rules, then test a few trades you can verify by hand. For more complex work, such as debugging a backtest that pulls quotes for both legs of an options spread, you can use OpenAI Codex or Anthropic’s Claude Code. These tools can work across multiple files and run tests. Ask them to show which tests they ran and check whether the results match what you expected. Here’s how you can use these AI tools in your trading workflow: Turn your trading decisions into rules Whether you trade trend following, mean reversion, or any other strategy, start with the decisions you want the system to make. Write down what triggers a trade, what you’ll trade, how much you’ll risk, and when you’ll exit or skip a setup. Include the indicators and analysis you already use, and spell out what you look for in each. If you want the system to place orders, define how it should handle those too. Suppose you want to buy a bull call spread after a stock breaks out. You buy one call and sell another at a higher strike, both with the same expiration. Here’s how you could turn that setup into rules. Signal: The stock must close above the highest price it reached in the previous 20 trading sessions. Entry: At 9:45 a.m. Eastern the next trading day, select the expiration closest to 30 days away, within a 25- to 35-day window. Buy the call with the strike nearest the stock price and sell the call with a strike $5 higher. Skip the setup if no expiration qualifies or either strike is unavailable. Risk: Set a maximum net debit of $1.25 per share and a dollar risk budget per trade. Use that budget to decide how many spreads you can open. Skip the trade if even one spread would exceed the budget. Exit: Attempt to close both legs together at 9:45 a.m. Eastern five trading sessions after entry. Decide in advance what the system should do if the closing order goes unfilled. Some decisions are harder to put into code. You might take profits when a move “looks tired,” based on what you’ve seen in similar trades. With partial automation, the system can alert you while you decide when to exit. If you want it to manage the exit too, describe what you see when momentum fades in terms the code can check, then test that rule. When you automate a strategy, you may give up some of the flexibility you had trading manually. A fixed exit can leave money on the table when you would have held a winning trade longer. It can also give back some gains when you would have spotted fading momentum and taken profits sooner. What you gain is a system that follows the same rules every time, cuts down on impulsive decisions driven by fear, greed, or FOMO, and frees you from having to watch every position. Judge the strategy over a series of trades. Look at whether it can produce a profit after costs, whether you can tolerate its drawdowns, and how much of your time it actually saves. Building your own options strategy? See how professional options traders plan and manage their trades. Explore SteadyOptions membership for options education and real-time trade alerts, with explanations of why the team enters, adjusts, and exits trades. Give AI the platform documentation and the right data Once your rules are written down, tell the AI where the code will run. Share the official documentation for your platform’s scripting language or your broker’s API, or ask the AI to find the pages relevant to what you’re building. Ask it to show where the code handles each rule so you can check how it translated your instructions. Give the AI a sample of your data so it can see how prices and timestamps are recorded. For the backtest itself, use as much clean, relevant history as you can get. In the breakout example, the stock’s price history tells you when the signal occurred. To estimate what it would have cost to open and close the spread, you need timestamped bid and ask quotes for both calls at the times specified in your rules. Cboe’s historical options quote data is one example. Ask the AI to write the code that matches the stock signal to the two option contracts and their quotes. Decide how old a quote can be before the script treats it as stale. If either leg has a missing or stale quote, have the script flag the setup for review. Give the AI two examples with known outcomes. In the first, the order fills at $1.25 or less. In the second, it remains unfilled because the backtest’s fill rules never show a fill at $1.25 or less while the order is open. From backtest to live trading Check individual trades before judging the results Open a few trades from the backtest and follow them from signal to exit. Did the code wait until the next session? Did it pick the right strikes and expiration? Did it respect the debit limit and attempt to close the spread at the right time? If a trade looks wrong, give AI the timestamp, the rule, the expected result, and what the code actually did. Rerun that case after the fix. Once the script follows your rules, you can start evaluating the strategy itself. Check whether the spread could have filled Suppose the stock breaks out and your entry rules select the 100 call to buy and the 105 call to sell. Here’s what their quotes might look like at the scheduled entry time. The midpoint of the call you buy is $2.20. The midpoint of the call you sell is $1.00. Subtract one from the other and you get a $1.20 net debit per share. Buying at the displayed ask and selling at the displayed bid gives a $1.35 debit, above your $1.25 limit. A combined order could still fill at $1.25 or less. The midpoint alone gives you too little information to count it as a fill. If the order remains open, apply your fill rules to the quotes that follow. That’s why the timestamp matters. In The Last 14 Minutes, SteadyOptions shows how a wide quote on one leg changed the calculated midpoint of a spread near the close. Once you’ve checked that the trades and fills follow your rules, review three numbers first. Net return: How much did the strategy earn after commissions and fees? Trade count: How many trades contributed to those results? Maximum drawdown: How far did the account fall from a peak before recovering or reaching the end of the test? If you use a profit target and a stop, compare the planned reward with the amount at risk. This spread has a five-session exit and no fixed profit target, so look at the win rate alongside the average win and average loss after costs. If you trade across several stocks, test the positions together. Two spreads on stocks in the same sector can lose money at the same time. Set risk limits for each trade and for all open positions combined. Compare portfolio versions over the same period using net return, maximum drawdown, and the Sharpe ratio. Sharpe measures how much return you earned above the risk-free rate relative to how much your returns fluctuated. Test across market conditions that matter to your strategy. Set aside a later period before you adjust the rules, then use it once you’ve settled on a version. If you change the rules after seeing those results, use fresh data for the next independent check. Connect alerts to execution and test it on paper With semi-automation, a TradingView alert tells you when a breakout triggers. You can then check the spread’s price in your broker’s options chain and place the order yourself. TradingView can simulate Pine strategy orders. For live automation, a TradingView webhook sends the signal to an external service. At your scheduled entry time, the service checks quotes and risk limits, then submits the order through the broker’s API if those checks pass. Check that your broker supports placing both legs as a single order at a net limit price. Interactive Brokers supports spread orders through its Web API. Its paper simulator uses the best displayed quotes and has limited support for combo orders. A backtest applies your rules to historical data. Paper trading lets you watch the system respond as signals arrive. Check how it handles: A rejected entry order. An unfilled exit order. A submission timeout. Check whether the broker received or filled the order before retrying. Start small and monitor what actually happens If you go live, start with a position size whose loss you can absorb. Check the first trades against your rules. If the chart and broker use different feeds, compare the symbol, session settings, timestamps, and prices before deciding why a signal or fill differed from the test. Keep a log of signals, submitted limits, actual fills, commissions, and orders that went unfilled. If far fewer orders fill within your $1.25 limit than the backtest assumed, pause new entries and see whether the quotes widened or your fill model was too optimistic. Have a plan for open positions too. If a closing order remains unfilled as expiration approaches, decide how you’ll handle the spread and the risk of assignment on the short call. With American-style equity options, the short call can be assigned before expiration, especially just before the stock’s ex-dividend date. As market conditions change, review your rules and test any revisions before putting them into live use. Advantages and disadvantages of AI in trading AI can shorten the work between having an idea and seeing how it behaves in a test. The value depends on the job you give it and how easily you can check the result. Final thoughts AI is changing how traders and investors develop and test their strategies. You can use it to turn a trading idea into code, backtest your rules on years of historical data, and automate some or all of your trading process. Your experience still matters when you set the rules, decide how much to risk, and judge whether the results hold up. Start with one task you can check yourself. Compare two spreads, test a single entry rule, or automate an alert. Give the system more responsibility once you’ve seen how it handles the job and what happens when something goes wrong. Explore SteadyOptions membership for options education, trade ideas, and a community where you can see how traders plan entries, manage positions, and make exit decisions. FAQ Can I use AI for options trading without knowing how to code? Yes. You can use an AI assistant to compare contracts, organize a trade plan, or draft a script from rules you describe. If the script will submit orders, you need a way to check its behavior and troubleshoot problems before it handles real money. How can I compare two AI tools for options trading? Give both tools the same options chain and the same task. For example, ask each to identify which bull call spreads meet your strike, expiration, and debit rules. Check whether each tool picks the right contracts, shows its calculations, and flags missing quotes. Can AI help me review an options trade I already closed? Yes. Give it your original trade plan, both legs’ entry and exit fills, and the reason you closed the position. Ask it to point out where your execution differed from the plan. For example, it can help you spot that you paid more for the spread than you intended or closed it before your exit rule called for it. About the author: Naoufal Seddik is a trader and financial writer with over six years of experience in financial markets. He covers forex, indices, stocks, and commodities. He works with the editorial team to create clear, accurate trading and investing content for readers of all experience levels. He is also a Top Rated Plus freelancer on Upwork. Upwork profile: https://www.upwork.com/freelancers/~01900fde01a206f244
- Yesterday
-
 JonSnowKnowsNothing joined the community
-
 alkumar joined the community
-
 Joe Ng joined the community
- Last week
-
 JimIke joined the community
-
Naoufal Seddik changed their profile photo
-
 NGera joined the community
-
Naoufal Seddik joined the community
-
5 Stocks For Options Trading In November 2026
Naoufal Seddik posted a article in SteadyOptions Trading Blog
 After Democrats won the midterms, investors also worried that new rules could slow down data center construction. Chip stocks were among the hardest hit. SanDisk (SNDK) fell 22.3% and closed at $806.43. In this article, we examine five stocks with possible options trading opportunities after the selloff. We look at their key price levels, upcoming earnings and potential strategies, explaining what to watch before considering a bullish or bearish trade. NVIDIA: support breaks as selling pressure increases NVIDIA fell sharply as investors feared that tighter AI regulation could delay data-centre construction and weaken demand for its chips. Friday’s rebound followed a wider recovery in semiconductor stocks. The stock closed November 6 at $186.64, below both $190.01 support and EMA 200 near $205. The current setup remains bearish, although a recovery is still possible: Bearish: further declines below the recent $181–182 low would reinforce selling pressure. Bullish recovery: reclaiming $190.01 would be an initial improvement. A sustained move above EMA 200 would strengthen the bullish case, with $243.37 a later resistance objective. Wait for earnings on November 17 after the close. AI chip demand and revenue guidance will help assess whether business growth can support a recovery. Consider puts if selling continues after the report, or calls if results and a recovery above EMA 200 support the bullish scenario. Make earnings and volatility part of your options trading plan. Explore SteadyOptions membership to learn how traders use them in their strategies and make more informed trading decisions. Walmart: earnings will test the recovery Walmart’s early-November rebound drew support from interest in its expanded Sparky AI shopping assistant ahead of the holiday season. Its previous quarter also delivered 23% global eCommerce growth. These developments support the growth story, but investors still need evidence that stronger digital sales translate into sustained profits. The stock closed November 6 at $125.52, following a pullback within its October recovery. Price remains above EMA 200, but $134.69 resistance has not yet been tested: Bullish: buyers defend the pullback and push toward $134.69. A breakout that holds would support considering calls. Bearish: a future rejection at resistance, followed by renewed selling, could support considering puts. Losing Friday’s $123.03 low would show that the current pullback is deepening. Wait for earnings on November 19 before the open. Watch comparable sales, eCommerce profitability and holiday guidance. Results that exceed expectations could support another advance; weaker margins or cautious guidance could undermine it. Use the price reaction to confirm the direction. Disney: buyers defend the breakout level Disney enters earnings with mixed business developments. Its previous quarter benefited from stronger streaming revenue and US theme-park demand. More recently, reports of possible job cuts and cost savings have raised questions about how management will improve profitability while funding growth. Those proposed cuts remain unconfirmed by Disney. Disney opened November 6 below $115.98, then recovered to close at $116.75. That buying supports a possible retest of former resistance as support: Bullish: holding $115.98 and continuing higher could bring $120–121 into reach. A break above those highs would put $124 in focus. Bearish: falling back below $115.98 and failing to recover it would weaken the breakout. Wait for earnings on November 17 before the open. Streaming profits, parks demand and management’s outlook could determine whether the recovery continues. Strong results followed by buying above $115.98 could support calls. Disappointing results and a failed retest would undermine that opportunity. Home Depot: rejection at $358.85 signals selling pressure Home Depot’s recent rally followed hopes that the election results could bring housing-affordability measures and lower mortgage rates. Those expectations still need to translate into stronger renovation spending. Its previous quarter showed 1.7% comparable-sales growth, leaving earnings an important test of the recovery. After the recovery, price rejected $358.85 resistance with a strong bearish candle. Price subsequently closed November 6 at $343.47, keeping that selling pressure in focus: Bearish: a failed bounce and further decline below $338.12 could bring EMA 200 near $330–332 into focus, followed by $320. Bullish: reclaiming $358.85 and holding above it would weaken the bearish scenario. Wait for earnings on November 17. Customer transactions, spending on larger projects and guidance will show whether housing optimism has business support. Weak results followed by further selling could support puts or a bear put spread. Stronger results and a sustained breakout would favor reassessing the bullish opportunity. Amazon: strong cloud growth meets spending concerns Amazon’s latest earnings presented a mixed picture. AWS revenue rose 39.3% to $46 billion, but overall results missed analysts’ expectations and the holiday-quarter outlook was cautious. Planned capital spending of approximately $220 billion in 2026 also keeps attention on the cost of expanding its AI infrastructure. Amazon closed November 6 at $259.30, above EMA 200 near $246 and around the middle of its 226.65–287.20 range. The broader recovery remains intact, but there is no confirmed breakout: Bullish: holding above EMA 200 and breaking $270–273 could support a move toward $287.20. Bearish: losing EMA 200 and failing to reclaim it would weaken the recovery. Sideways: continued trading between support and resistance would leave purchased options exposed to time decay. Amazon has already reported earnings. Watch subsequent updates on AWS demand, holiday sales and investment spending. A confirmed advance could support calls or a bull call spread, provided the premium leaves sufficient potential reward toward resistance. The current position near the middle of the range calls for patience. Match the order to the scenario Price confirmation identifies a possible setup. The options chain determines the cost and deadline for expressing it. Use a limit order and check the actual bid-ask spread. A widely traded stock can still have an illiquid strike or expiration. Close a purchased option with a sell-to-close order; close a spread by reversing both legs. Volatility and risk management Sharp stock moves make options pricing especially important. Implied volatility reflects expected movement embedded in premiums. A rebound in the stock can coincide with falling IV, limiting a call’s gain. After earnings, IV crush can offset the benefit of correctly anticipating direction. Before entering: Compare IV with its own history, using a consistent measure. Choose an expiration that allows time for the expected move. Check options liquidity, transaction costs and realistic exit prices. Set a position size that accommodates the potential loss. A standard 100-share contract quoted at $2 costs $200 before fees. That premium can be lost completely. A planned stop cannot guarantee the exit price, especially across an earnings gap. Spreads also require attention to assignment and expiration. NVIDIA, Disney and Home Depot report on November 17, followed by Walmart on November 19. Positions across these stocks can concentrate event risk in the same week. Decide before entering whether to close ahead of results or deliberately hold through them. Options trading goes beyond choosing a stock. You also need the right strategy and a clear plan for managing the trade. SteadyOptions combines advanced options education with trade ideas, real-time entry and exit updates, and a private trading community. Members also receive explanations behind each trade, position adjustment updates, and guidance on risk management and portfolio allocation. Its model portfolio made a 48.1% gain from the beginning of 2026 through October, before commissions. Join SteadyOptions and put a clear plan behind your next trade! About the author: Naoufal Seddik is a trader and financial writer with over six years of experience in financial markets. He covers forex, indices, stocks, and commodities. He works with the editorial team to create clear, accurate trading and investing content for readers of all experience levels. He is also a Top Rated Plus freelancer on Upwork. Upwork profile: https://www.upwork.com/freelancers/~01900fde01a206f244
- Earlier
-
 Roni Svetlov joined the community
-
We are pleased to expand our services offerings with a new strategy called Steady Insiders. Here are the service parameters: Tailored for medium term investors Model portfolio size - $50,000 Underlying - stocks Average holding period - 3-5 months 30-40 trades per year 15-25 positions in the portfolio Summary SteadyOptions is built on disciplined, non-directional, delta-neutral strategies designed to harvest implied volatility mispricing. We all know, however, that in options there is no greater pleasure than being right on direction. The question of what that direction is occupies a large part of most traders’ time and realistically they are mostly wrong about it or if not wrong they are just lucky because markets statistically tend to go up. This proposal introduces a directional catalyst strategy driven by SEC Form 4 insider transaction scanning, dynamic trend-reversal triggers and structured options execution (LEAPs and Diagonal Spreads). Unlike delta-neutral earnings plays, this strategy deliberately seeks positive directional delta to capture multi-month re-ratings while – where possible - systematically harvesting short-dated theta to lower net capital risk. In other words it implements the blog post made on insider trading (see here). Simply put, the idea is to scan for insider buying and combine that with a conviction-based catalyst to build a small delta positive portfolio. Take biotechnology firms – we know some of them could be worth billions but no one has the time to figure out which one. Well the people that know are on the inside and if they are buying ahead of an FDA announcement and other indicators are positive (mainly positive MA crossings) then it could be worth following the insiders. The strategy is more sophisticated than simply buying what insiders do, combining this with an external catalyst that we can discuss with members here on the forum. We already named biotech events but for example IP/patent battle outcomes, corporate restructuring, the bottom momentum stocks (i.e. oversold ones) or sectors that will benefit from cheap AI – all of these can create subsets to scan for those companies where the insiders are buying. Next Steps Official Service Launch: January 1 2027: Introduce an "Insider Catalyst Hub" sub-forum on SteadyOptions to track a live, transparent model portfolio. Portfolio Build Alerts: Issue clear entry alerts (LEAP strike/expiration selection) and subsequent monthly diagonal roll notices (e.g. closing expiring short calls and opening new monthly strikes). Continuous Updates: Provide weekly updates on secondary insider accumulation and technical trend status for all active names. Add new names to the list if appropriate new ones crop up. The strategy will be managed by our long term contributor @TrustyJules. SteadyOptions members already know and appreciate his contributions for over 8 years, and we are very pleased that he will be managing his own service. I will let @TrustyJules to add more comments and insights. Any questions - feel free to post here. More details will be available on the members only forum.
-
@ykotowitz I stopped using my QT account after about a week .... it just didn't work well for me to do the option trades like the ones we do here ... I found it confusing and tough to make quick modifications for trades on the fly ... if I spent more time with it I may have got more use to it but went back to IB ... I haven't got around to actually closing the account yet ... it is good for the SY TLT trades which are multiple contracts so $0 comms is nice
-
I have opened a Questade account a few weeks ago and did some trades. It is indeed free for US options trades, which makes a significant gain for small value trades. I have not compared executions with interactive brokers, but the executions seem to be in line with IB quotes. However, the data for options is poor. The bid and ask figures for combo trades are simply the sum of the bids and asks for the legs, unlike IB. As well, I can not find a way to chart combo trades. Placing orders for option trades is clunkier than IB, but manageable. I found it necessary to keep my IB account for data and charting even though I conduct most trades on Questrade. If anyone else has tried the service, I would like to hear about their experience. Thank you
-
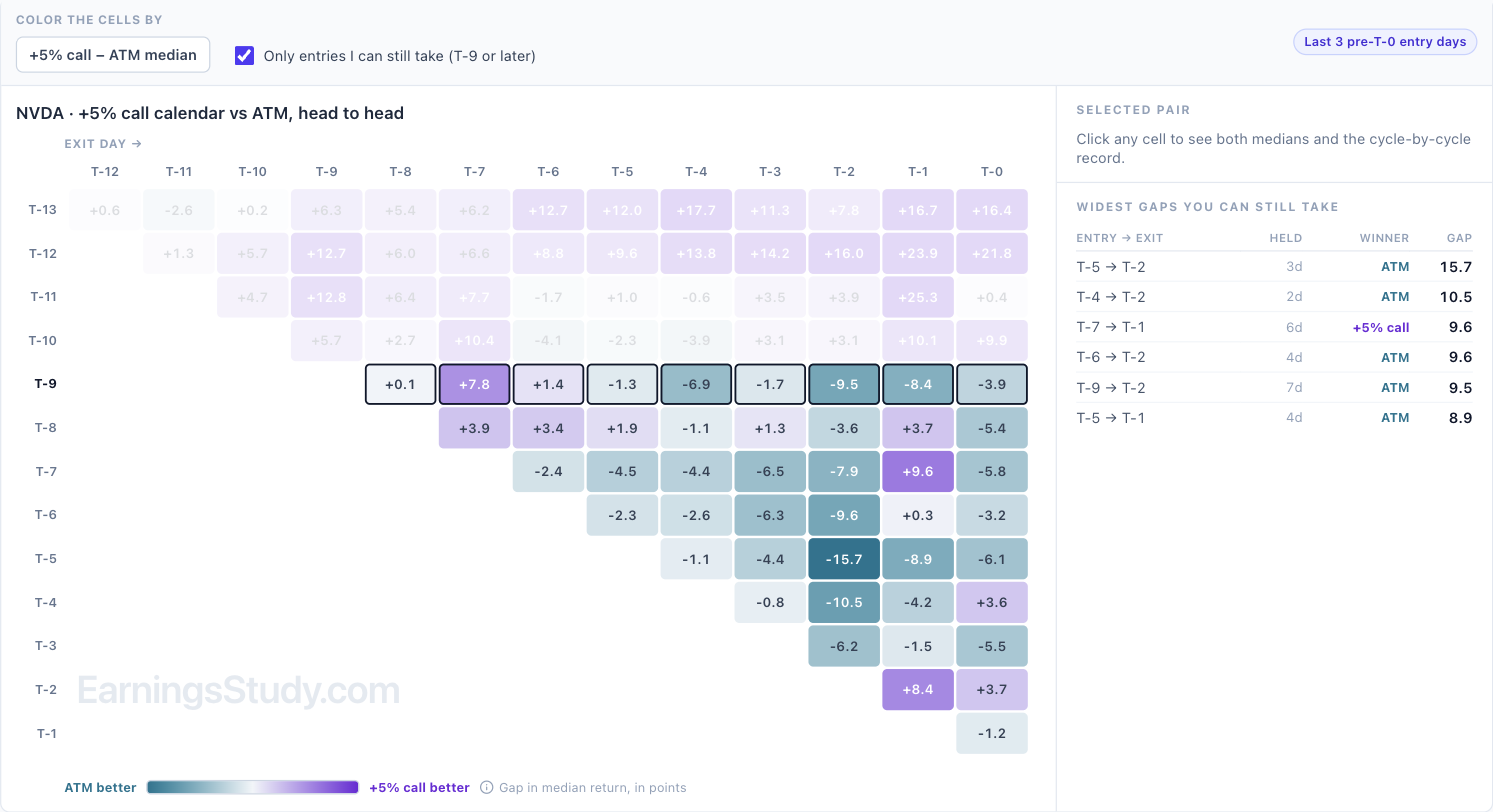
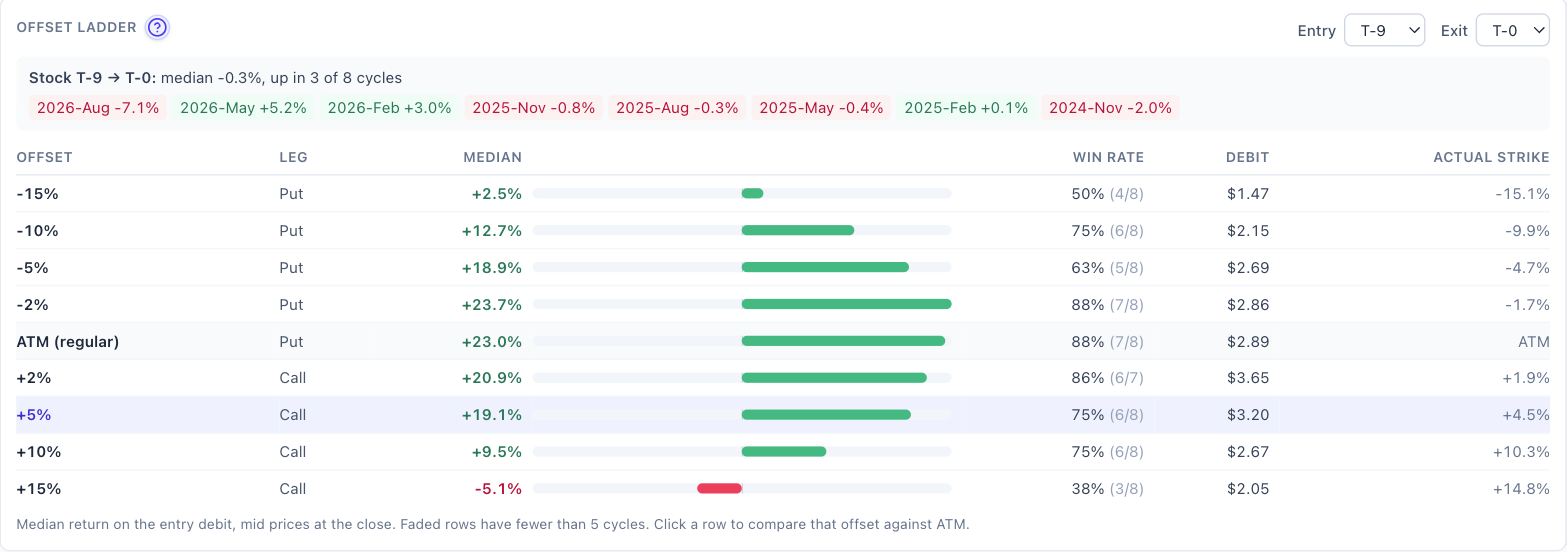
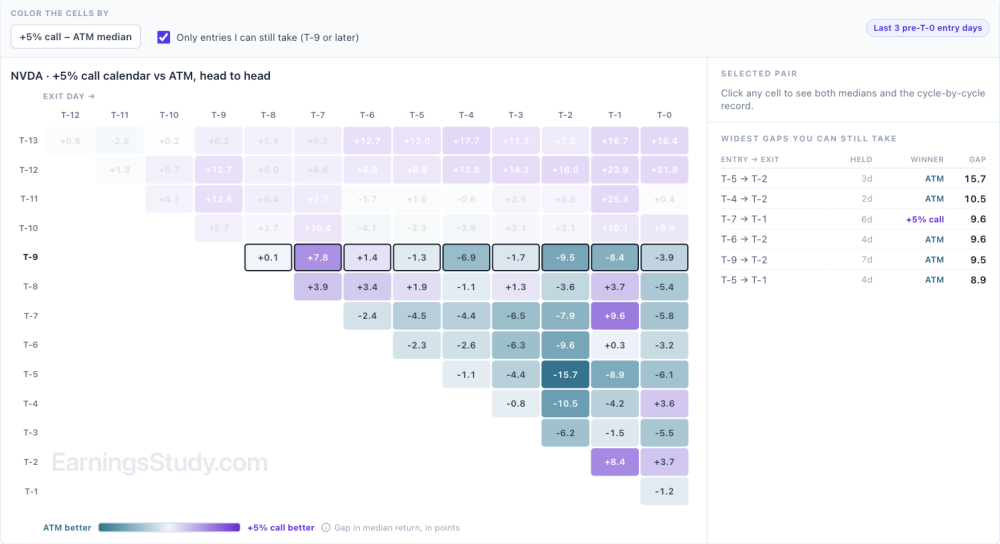
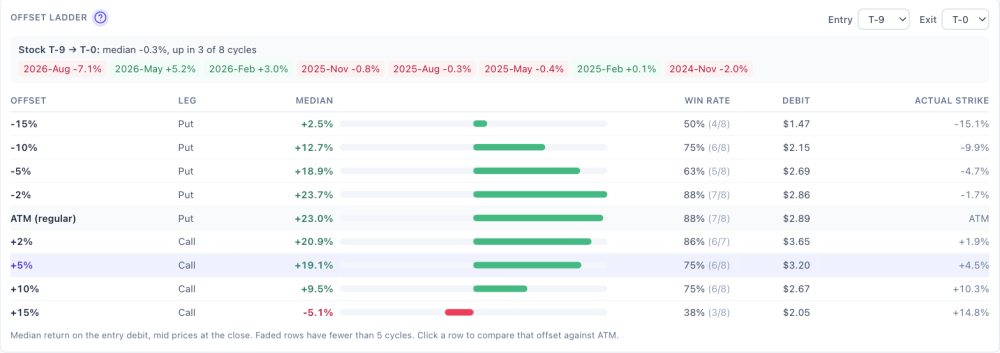
Coming soon: Directional Calendar The Calendar page models the at-the-money calendar. Plenty of calendars around earnings are placed off the money instead: above the stock if you lean bullish, below it if you lean bearish, or wherever you think the stock will sit by the report. The next addition to the Calendar page models those, and it's in testing now. Here's a preview on NVDA, which reports Nov 17 after the close. Numbers are from EOD data through Nov 3, at T-9. What it models. A calendar with the strike set 2%, 5%, 10% or 15% above or below the stock. By default, strikes above use calls and strikes below use puts (the out-of-the-money side), and you can switch either one to puts or calls. It isn't a separate page: in the Calendar page's History Matrix, choose Directional from the Compare with menu, and the regular calendar stays on screen next to it. The strike rule. A strike only counts if it actually lands near the offset you picked. For +5%, that means between 3.5% and 7.5% above the stock. If no listed strike fits, that day is skipped rather than quietly rounded to the money. At +5% on NVDA, all 115 entry days priced, the strikes landed a median 4.9% above the stock, and the calendar cost a median 1.98% of the stock price. Compare with Directional, +5% call calendar, NVDA. 1. Head to head with the regular calendar. One grid: each cell is the directional calendar's median return minus the ATM calendar's, purple where the offset did better and teal where ATM did. For NVDA's +5% call calendar entered at today's T-9, the offset only came out ahead on short holds (7.8 points better exiting at T-7). From T-5 onward the ATM calendar won every exit: by 9.5 points at T-2 and 3.9 points held to T-0. The widest gaps still available mostly go to ATM, led by T-5 to T-2 at 15.7 points. +5% call calendar vs ATM, gap in median return (points). Today's T-9 row is outlined. 2. Offset ladder. For one entry and exit, every offset next to the regular calendar and the stock's own move. NVDA from T-9 to T-0: the stock moved a median −0.3% and rose in only 3 of 8 cycles. The ATM calendar returned +23.0%, the −2% put +23.7% and the +2% call +20.9%. At ±5% returns were about 19%. Further out they fell off: −10% put +12.7%, +10% call +9.5%, −15% put +2.5%, and +15% call −5.1% with only 3 of 8 cycles positive. Offset ladder, entry T-9, exit T-0. How to read it. NVDA has barely moved between T-9 and its reports, so strikes near the money did best, and the further out the strike, the worse the result. A directional calendar pays when the stock actually travels toward the strike before you exit. Check the stock drift line and its cycle-by-cycle chips before reaching for an offset. On NVDA they range from −7.1% last August to +5.2% in May, with most cycles inside ±2%. Two cautions. These are 7 or 8 cycles per cell, so treat any one number as a sample, not a rule. And strikes far from the money cost less in dollars (the −15% put was $1.47 against $2.89 for ATM), so their percentage returns swing harder. I'll post here when it opens. If you place calendars off the money a particular way (other offsets, a fixed dollar distance, a different expiration pair), send it through the Ask button while the design is still easy to change. Educational research only, not trade advice. Based on EOD data; past cycles don't guarantee future results.

-
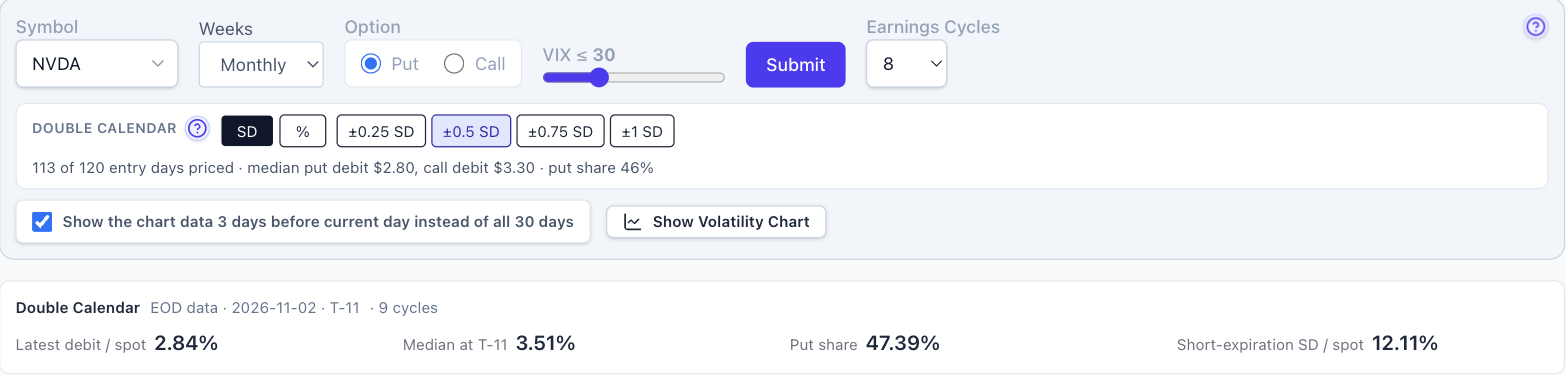
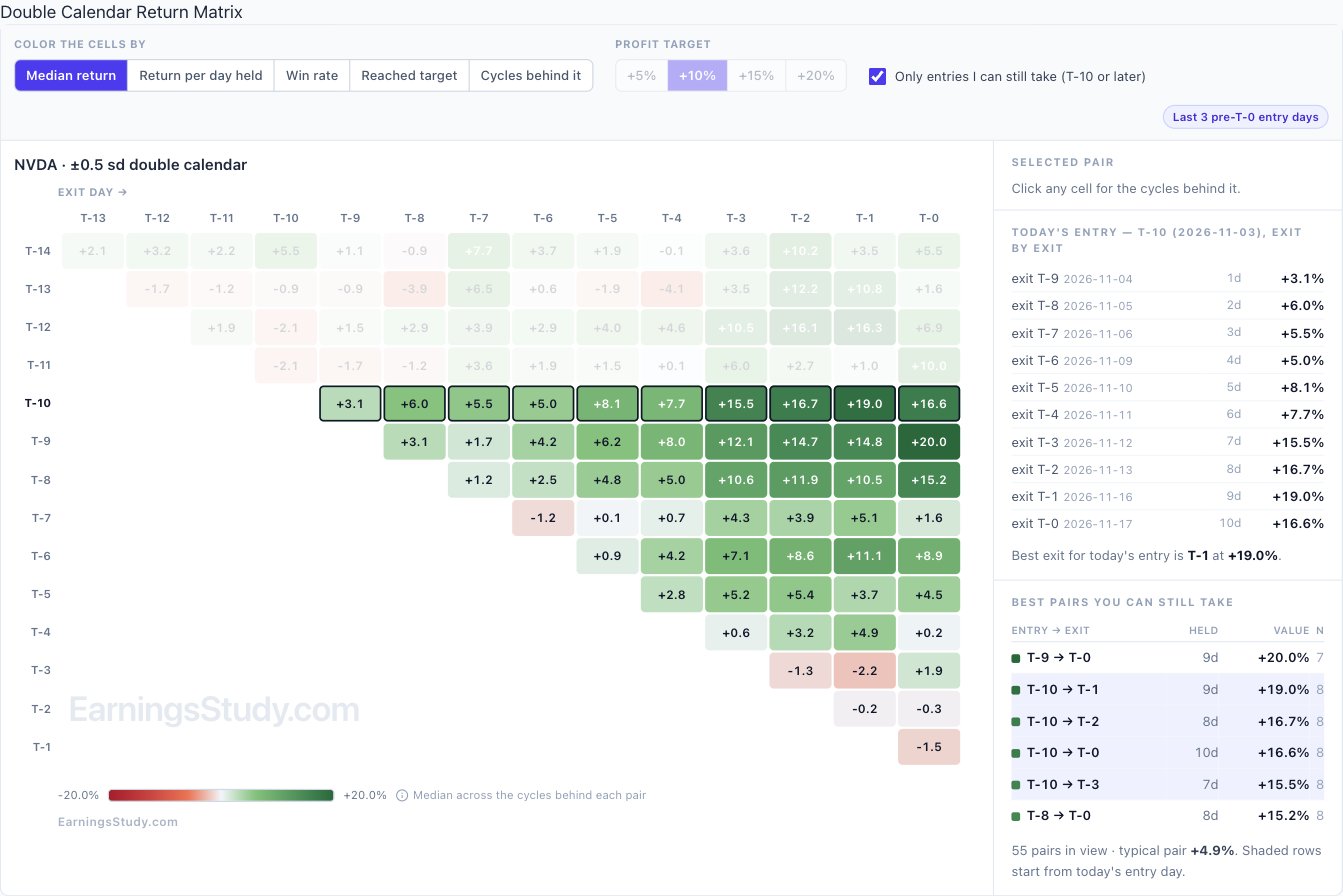
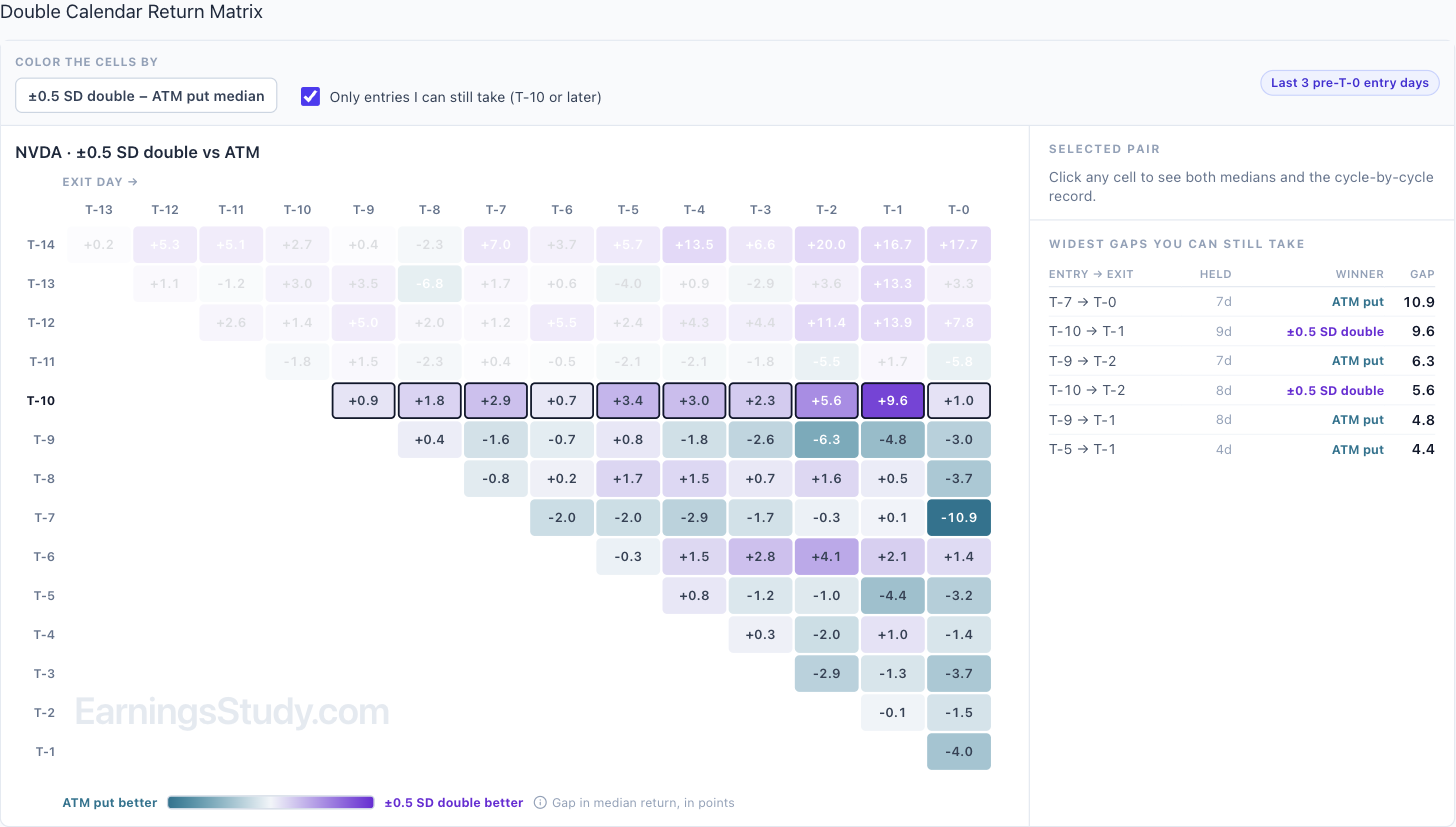
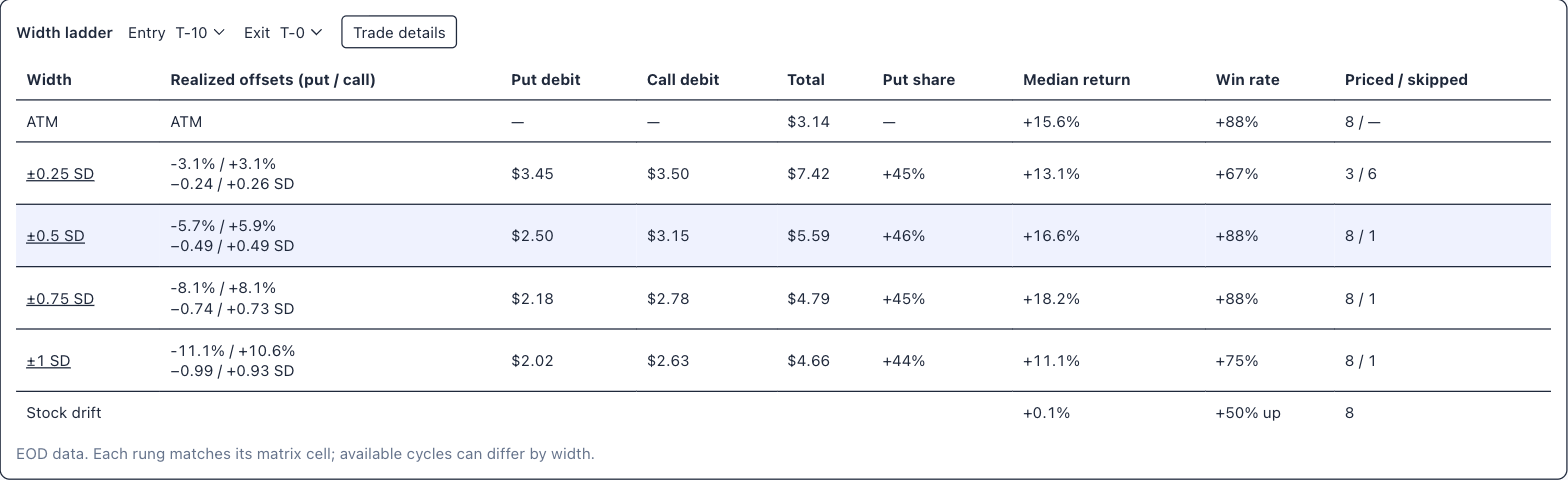
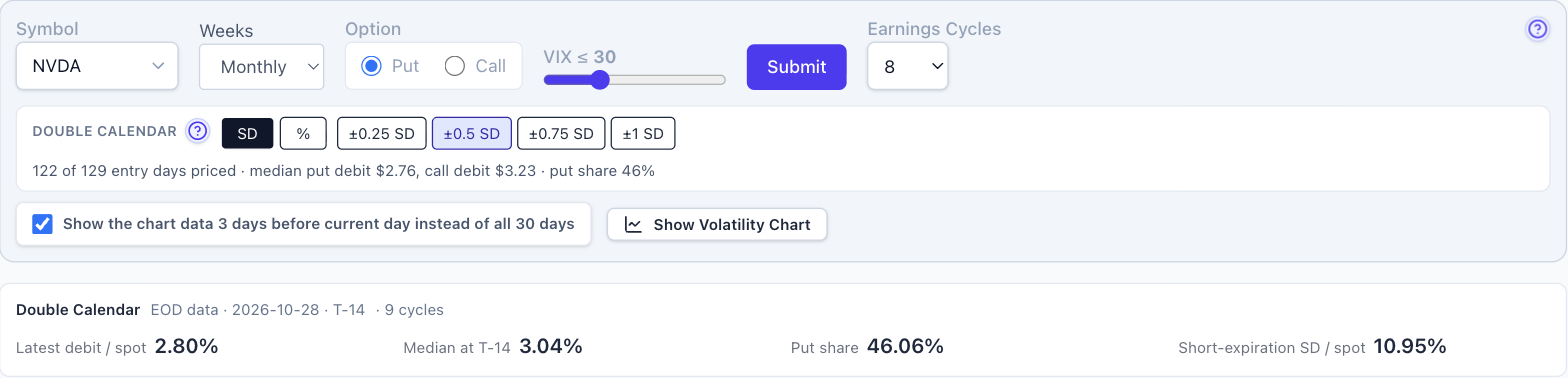
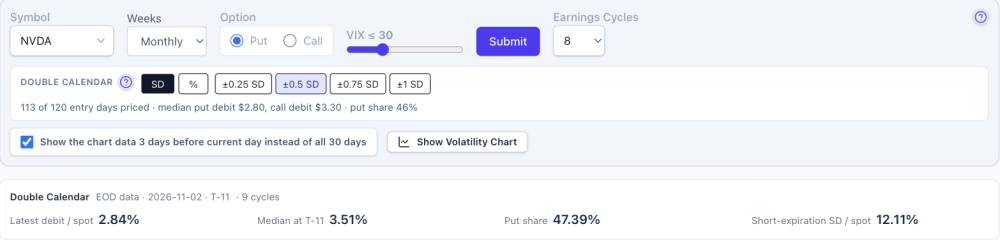
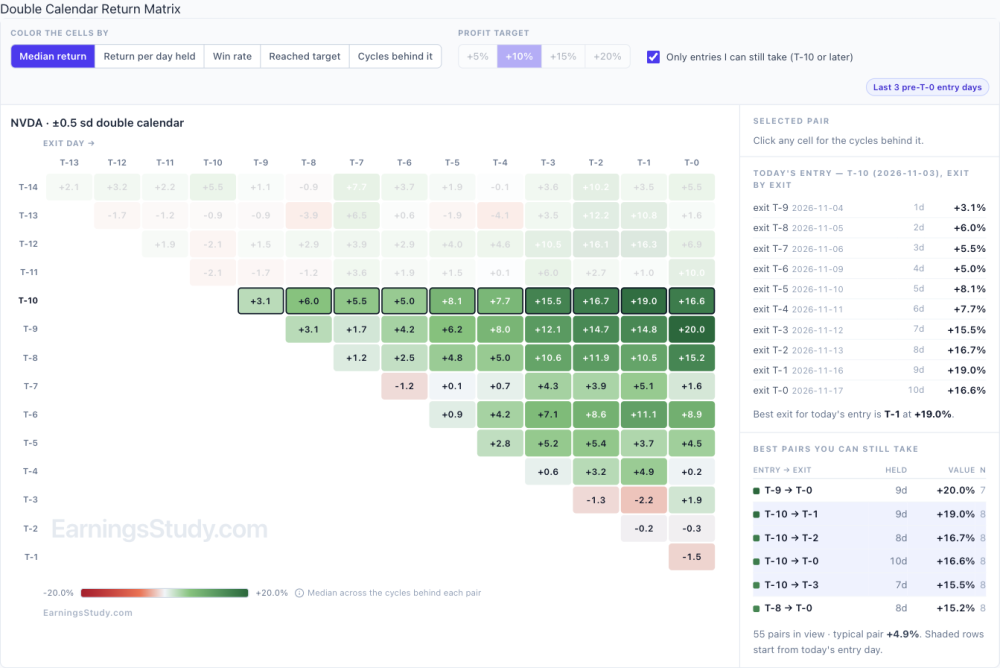
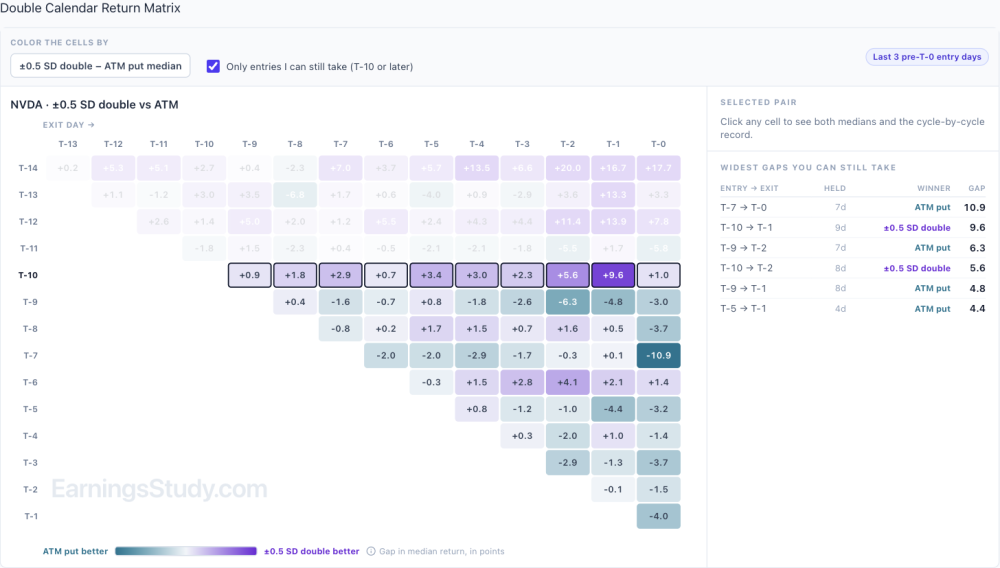
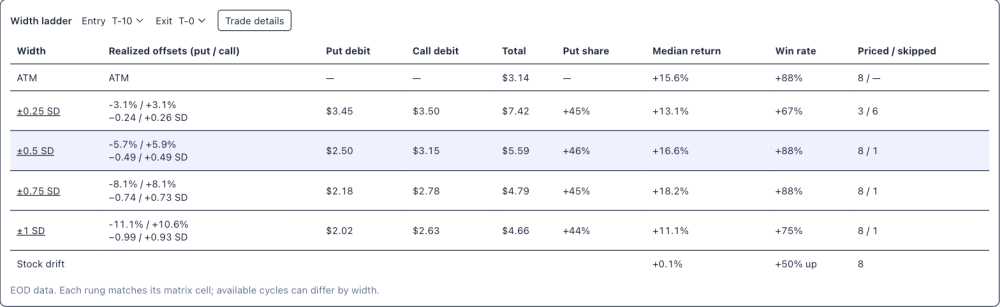
Double Calendar is open Last week I previewed the Double Calendar page. It's open now for every member: look for Double Calendar in the sidebar, right under Calendar. If you'd rather start from the regular calendar, the Calendar page now has a Compare with menu where you can pick Double. Quick recap: a double calendar is a put calendar below the stock plus a call calendar above it, on the same expirations. You set the width in standard deviations of the short expiration (±0.25 to ±1 SD) or as a percent of the stock price. A cycle only counts when both halves can actually be priced. Here's how I'd use it, on NVDA. It reports Nov 17 after the close, so today is T-10. Numbers are from EOD data through Nov 2, at ±0.5 SD. 1. Is it cheap or rich? The summary bar shows today's debit as a percent of the stock against the median for the same day in past cycles. NVDA's double cost 2.84% against a 3.51% median at T-11, about a fifth below its own history. NVDA, ±0.5 SD, EOD Nov 2. 2. What did entering here return? In the return matrix, tick "Only entries I can still take" and read today's row. Entering NVDA's double at T-10 returned a median +3.1% by the next day, building to +15.5% at T-3, +16.7% at T-2 and +19.0% at T-1, and +16.6% if held to T-0. Switch the coloring to Win rate: 7 of 8 cycles finished positive on most of those exits. Across every pair from T-10 on, the typical one returned +4.9%. Return matrix, ±0.5 SD, median return. Today's T-10 row is outlined. 3. Is it better than the plain calendar? Tick "Show ATM Calendar alongside" and each cell shows which one did better, and by how many points. On the T-10 row the double came out ahead on every exit, by anywhere from 0.9 to 9.6 points; the biggest gap was T-10 to T-1. One row down it flips: from T-9 the at-the-money put calendar won most exits, and T-7 to T-0 went to the ATM calendar by 10.9 points. So the edge here comes from the entry day, not from the structure in general. Double vs ATM put calendar, gap in median return (points). 4. Which width? The width ladder puts every width next to the regular calendar for one entry and exit. NVDA from T-10 to T-0: the ATM calendar returned +15.6%, ±0.5 SD +16.6% and ±0.75 SD +18.2%, all with 7 of 8 cycles positive. ±1 SD dropped to +11.1%, and ±0.25 SD priced only 3 cycles because the strikes sat too close to the money. The stock itself moved a median +0.1% over that stretch. Click Trade details for each cycle's strikes and debits, with both halves listed separately. Width ladder, entry T-10, exit T-0. Not every name looks like this. HD, also reporting mid-November, tells a different story at ±0.5 SD. From today's entry on, the typical pair returned −2.1%. Entering at today's T-9 had a best exit of +4.7% three days later and −0.9% held to T-0. That's the reason to run the four checks rather than assume a double is the better calendar. Two cautions. Each cell rests on 7 or 8 past cycles, so treat a number as a sample, not a rule. And the double costs more in dollars than the ATM calendar ($5.59 against $3.14 on NVDA here), so compare them by percent return, which is how the page shows them. Thanks to the members who asked for this. If you trade doubles a particular way (other widths, different expirations for the two sides) or something looks off, send it with the Ask button in the top bar. It attaches the page you're on. Educational research only, not trade advice. Based on EOD data; past cycles don't guarantee future results.
-
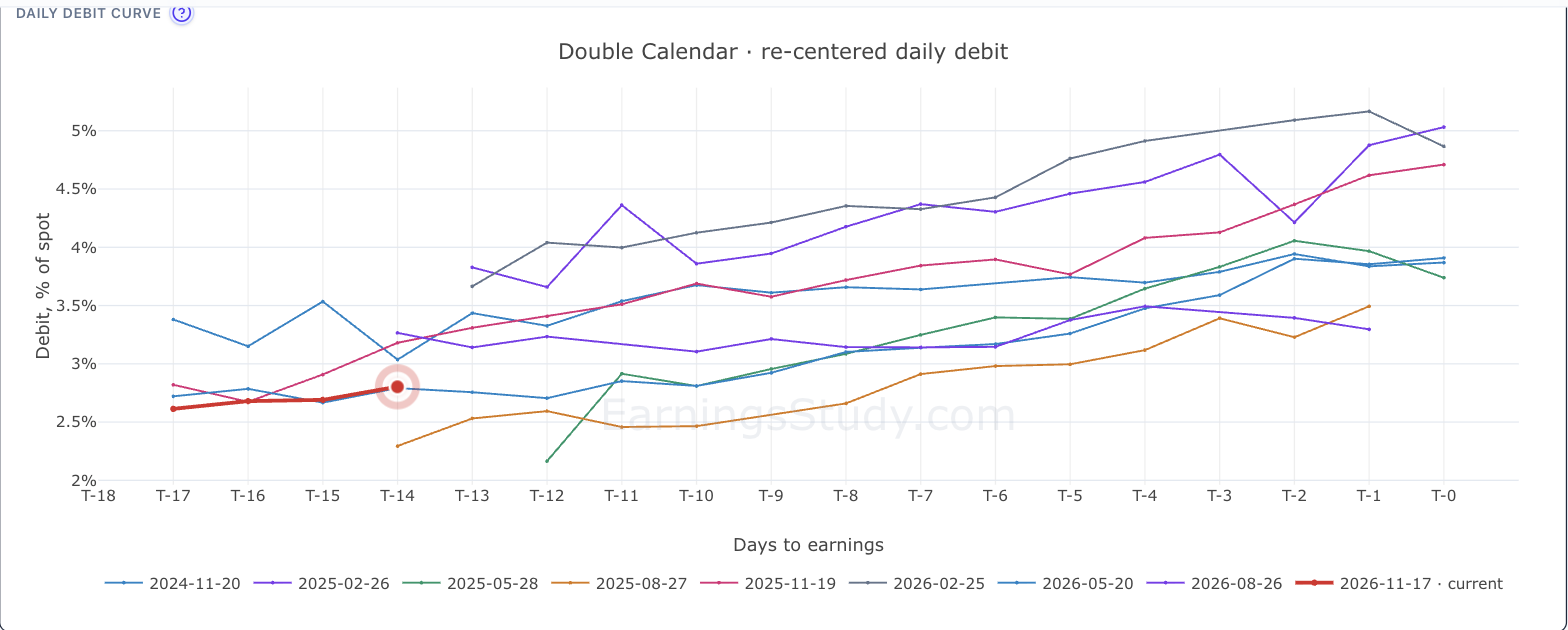
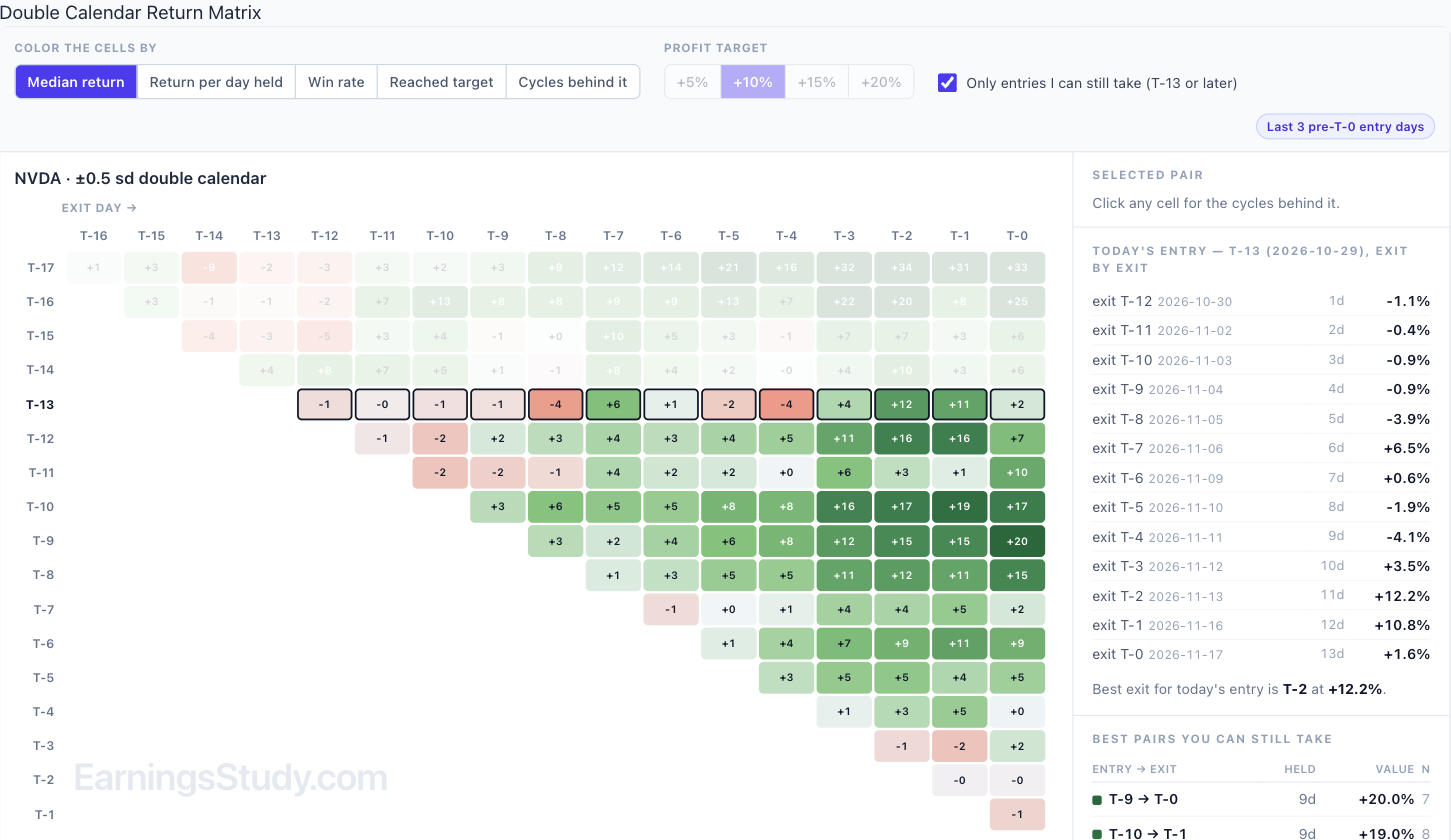
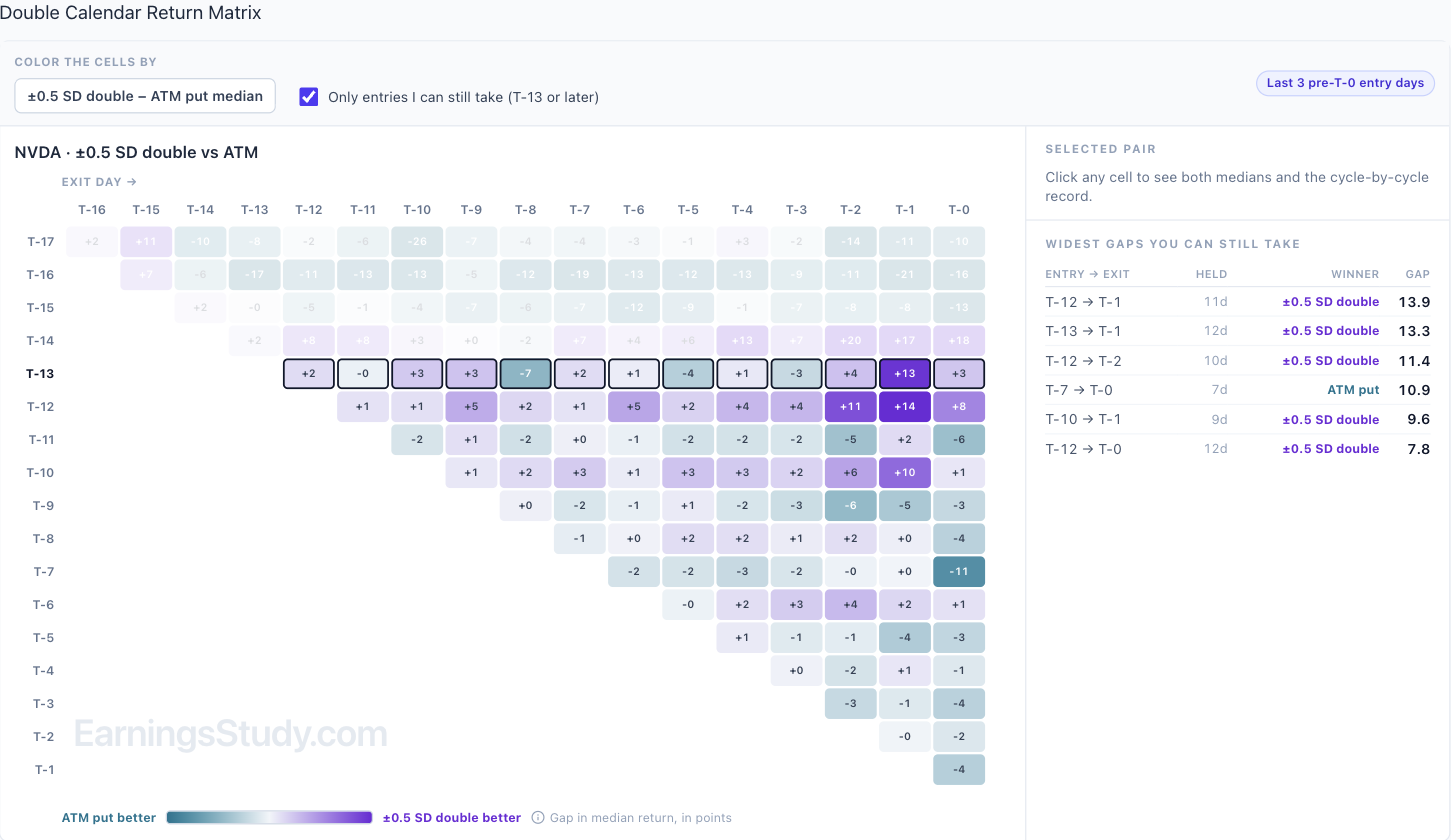
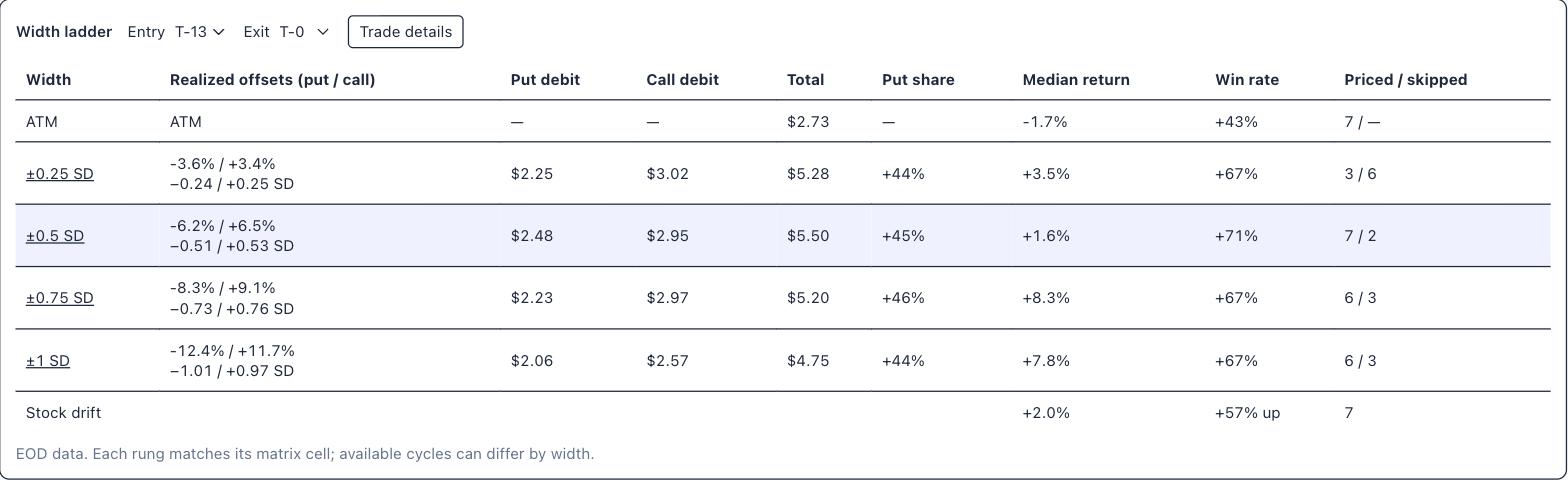
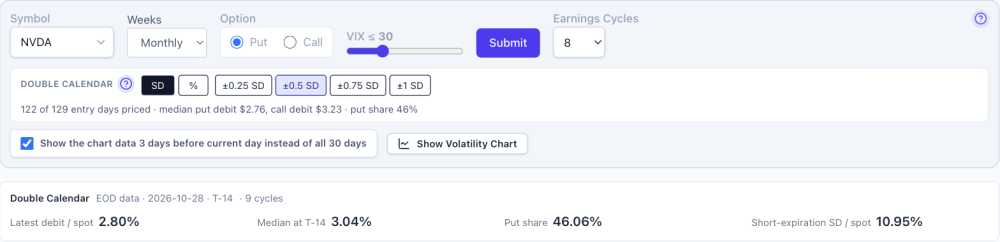
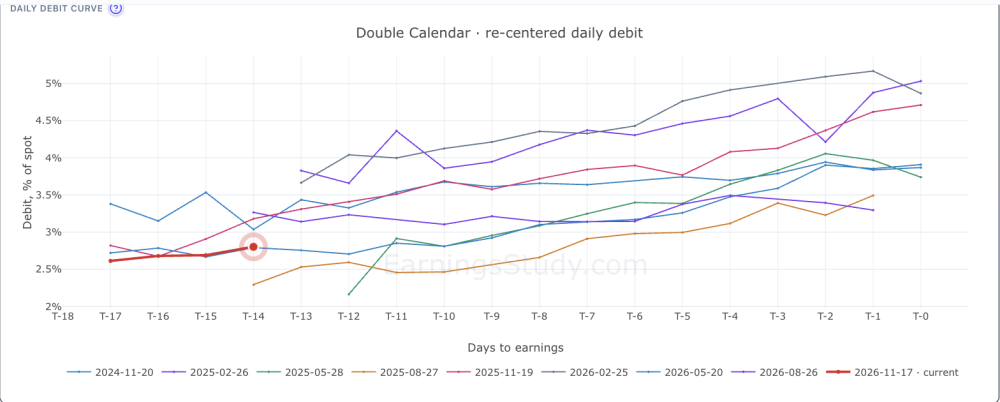
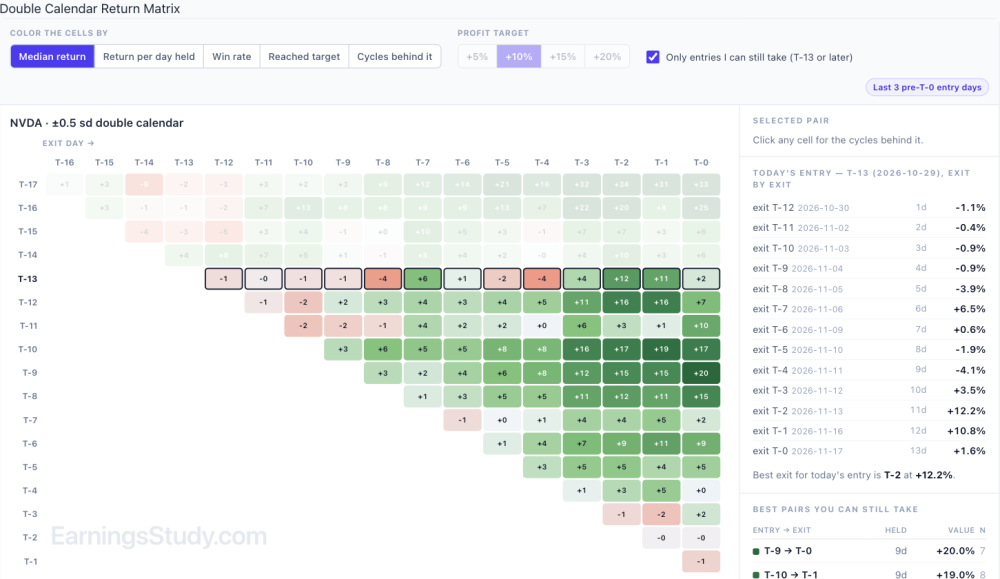
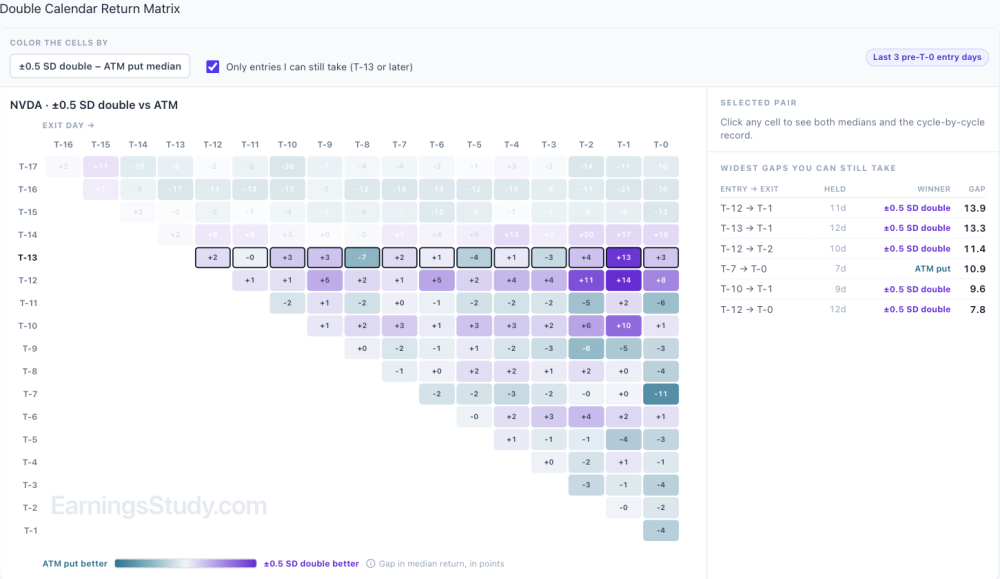
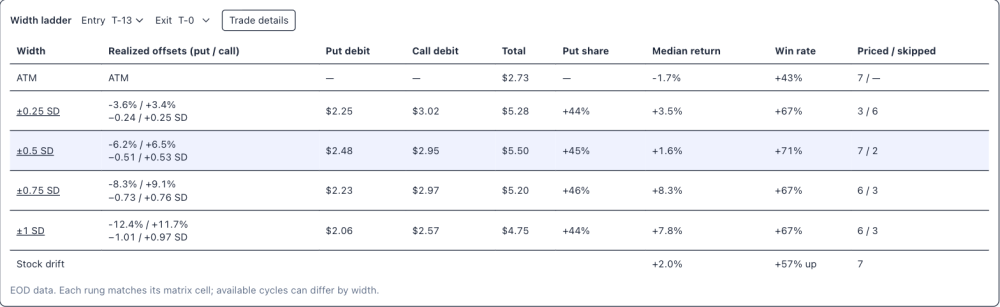
Coming soon: Double Calendar A few of you trade double calendars around earnings and have asked how they would have done in past cycles. That page is built and in testing now. Here's a preview on NVDA, which reports Nov 17 after the close. What it models. A double calendar is two calendars on the same expirations: a put calendar below the stock and a call calendar above it. Instead of one tent at the current price, you get two, with a wider range where the trade can still make money. The price for that is a lower peak, so it suits a stock that tends to drift before its report rather than sit still. How wide. You pick the width in standard deviations of the short expiration (±0.25, ±0.5, ±0.75 or ±1 SD), or as a percent of the stock price. SD makes widths comparable across names: ±0.5 SD is a much smaller dollar distance on KO than on TSLA. A cycle only counts when both halves can actually be priced; the page never quietly falls back to one side or to the at-the-money strike. NVDA, ±0.5 SD, EOD Oct 28. At ±0.5 SD, NVDA's double cost 2.80% of the stock price at the Oct 28 close, below its 3.04% median for that point in past cycles. The put side was 46% of the cost. 1. Daily debit curve. The structure re-centered on each day's price, as a percent of the stock, for every past cycle, with the current one in red. On NVDA the debit has tended to rise into the report. Daily debit curve, 8 past cycles plus the current one (red). 2. Return matrix. The same entry-by-exit matrix as the other strategy pages, with the same coloring modes (median return, return per day, win rate, reached target). For NVDA at ±0.5 SD, the 91 entry and exit pairs still available had a typical median of +3.9%. The best were T-9 to T-0 at +20.0% and T-10 to T-1 at +19.0%. Entering on T-13 itself was weaker: best exit T-2 at +12.2%, and +1.6% if held to T-0. Return matrix, ±0.5 SD, median return per entry and exit day. 3. Side by side with the regular calendar. Tick "Show ATM Calendar alongside" and each cell shows which structure did better and by how many points. On NVDA it's mixed, and that's the useful part. The double won by about 14 points on T-12 to T-1 and T-13 to T-1, while the at-the-money calendar won by 11 points on T-7 to T-0. A double calendar isn't an upgrade everywhere; this view shows you where. Double vs ATM calendar, gap in median return (points). 4. Width ladder. For one entry and exit, every width next to the regular calendar and the stock's drift. NVDA from T-13 to T-0: the at-the-money calendar returned −1.7% with 43% wins; ±0.5 SD +1.6% with 71% wins; ±0.75 SD +8.3% and ±1 SD +7.8%, both with 67% wins. The ±0.25 SD row priced only 3 cycles, because the strikes sat too close to the money to count as a separate structure. Width ladder, entry T-13, exit T-0. I'll post here when it opens. If you trade double calendars a particular way (other widths, different expirations for the two sides), send it through the Ask button while the design is still easy to change. Educational research only, not trade advice. Based on EOD data; past cycles don't guarantee future results.
-
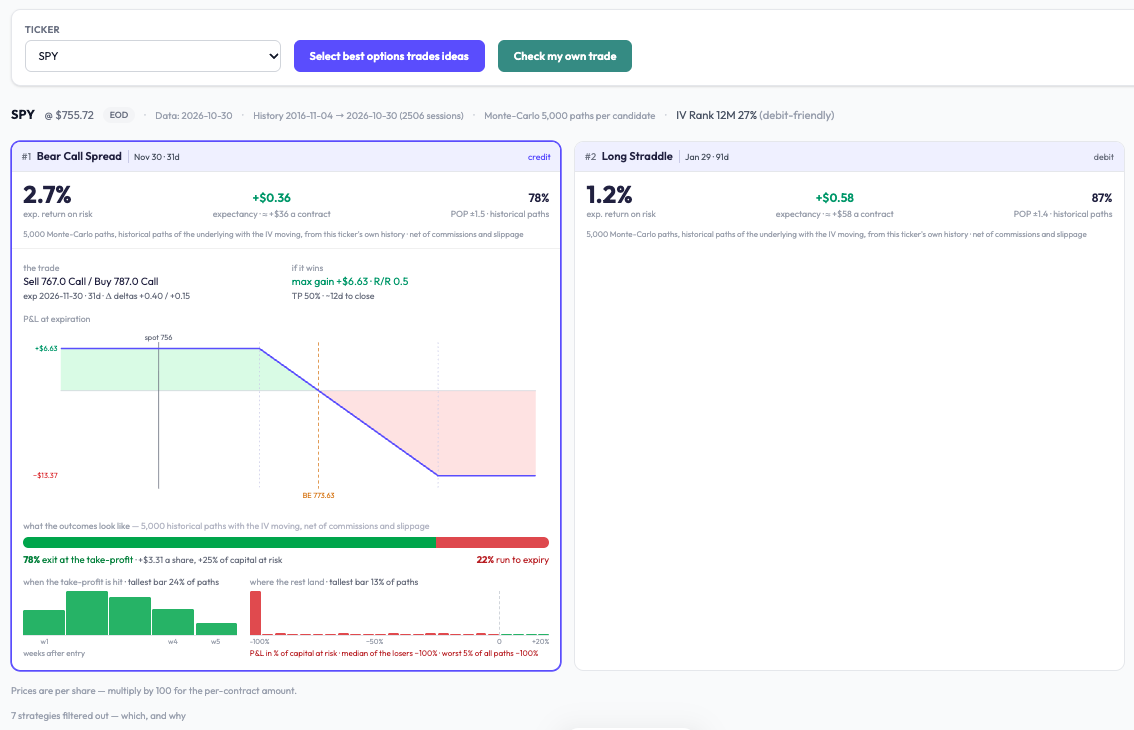
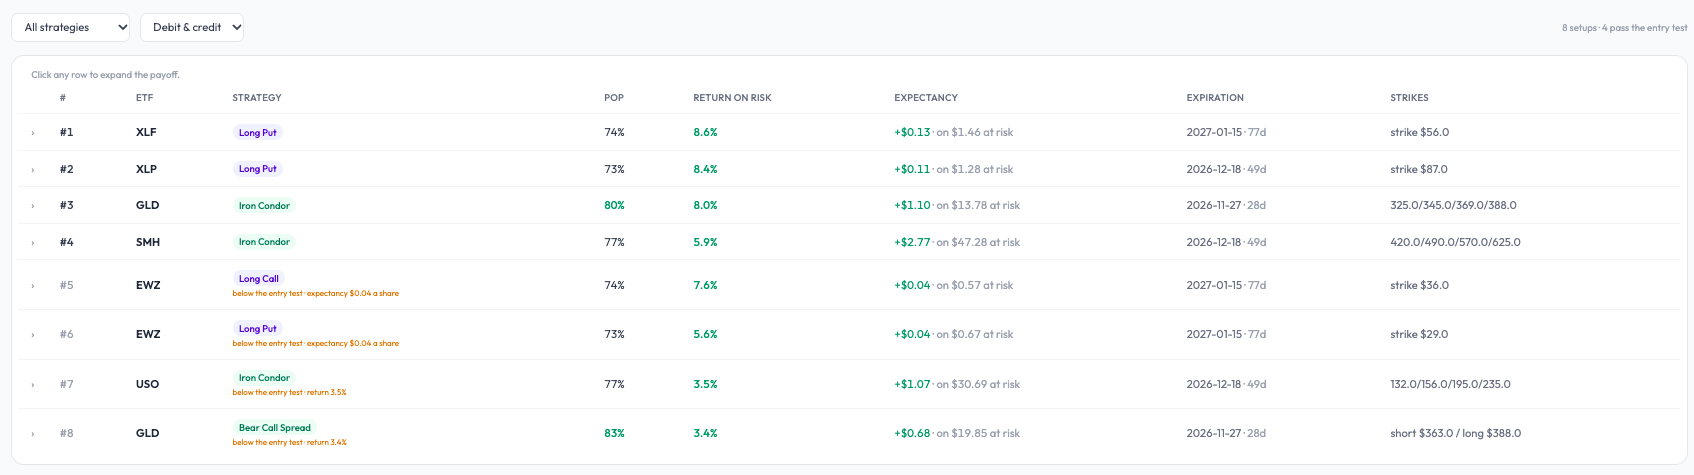
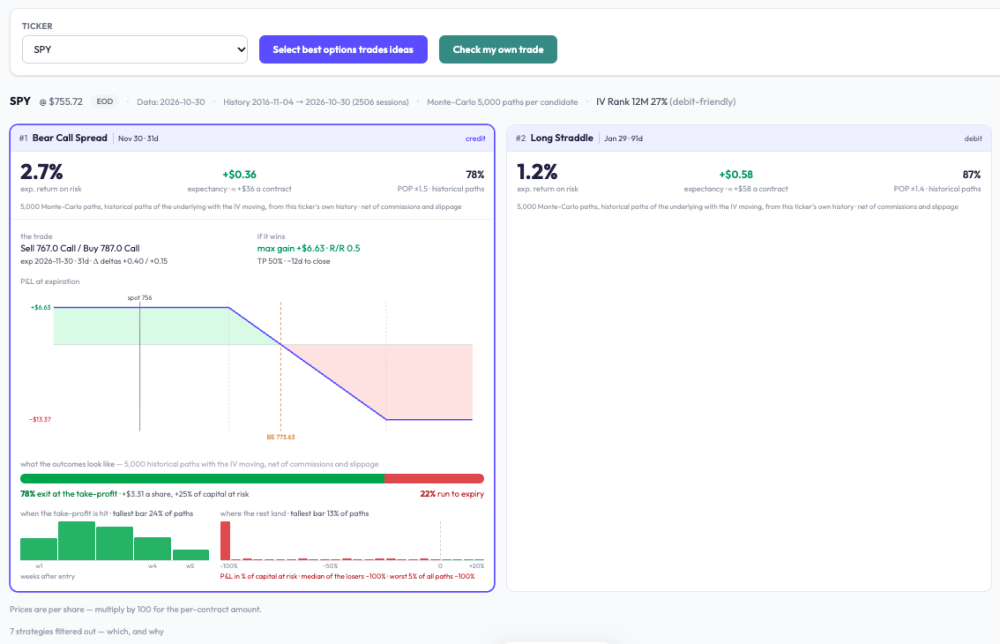
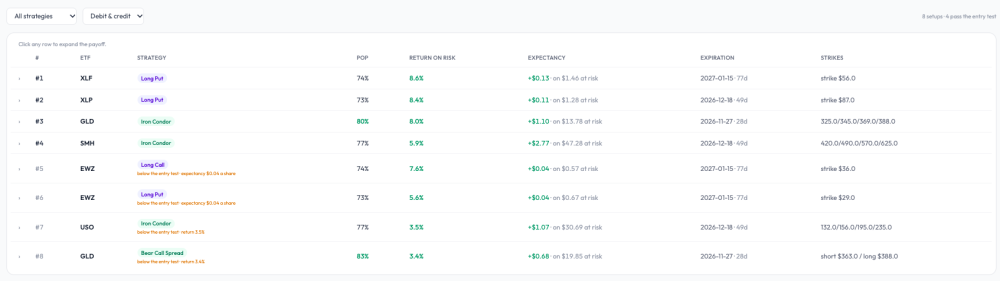
Ticker-Options Ideas and Best OS ETF now simulate with the implied volatility moving Until now, OptionBench’s Monte-Carlo ran each candidate with the IV held constant along the path, giving the ranking. The limitation of a constant-IV simulation is easy to state: a long straddle with a +10% take-profit is not a bet on where the underlying ends up, it is a bet on the path and on what the IV does along it. A model that keeps the IV frozen cannot price that, whichever volatility number you feed it. What changed The second pass now draws historical paths from the ticker’s own history: daily moves of the underlying and of its ATM implied volatility, kept in step (block bootstrap of the pairs, demeaned), with every leg repriced at the path’s IV at each step. Take-profit exits are detected along the path, at the threshold (limit-order convention). Ten years of chains per ticker, 5,000 paths per candidate, net of commissions and the exit share of the spread. What you see Ticker-Options Ideas: each card states its basis (“historical paths of the underlying with the IV moving, from this ticker’s own history”), the window it drew on (2016 → today for most tickers), and a new block, what the outcomes look like: the share of paths that exit at the take-profit, in which week they do, and where the rest land as a % of capital at risk: the distribution behind the POP, not just the POP. Long straddles and strangles carry a 10% take-profit (where the historical hit rates are), verticals and condors 50%. Best OS ETF: one ranking over every setup of every ETF. A setup passes the entry test when POP ≥ 70%, expected return on risk ≥ 5%, and net expectancy ≥ $0.10 a share; those rank first, the others follow with the reason stated on the row (“below the entry test · return 3.5%”). The Expectancy column now reads “+$0.13 · on $1.46 at risk”, so the dollar figure and the return say the same thing. The Today page shows the top three that pass. Check my own trade: Trade Doctor has moved into Ticker-Options Ideas as a second button. Build your position leg by leg on the ticker’s chain and it runs through the very same engine and shows the very same card as the ideas, plus a strip of checks (liquidity per leg, loss profile, IV context, earnings and macro events before expiration, costs), as dated facts. Old Trade Doctor links land there. What this is not It is a better-calibrated simulation, not a forecast. The paths are the ticker’s own past; a regime the ticker has not lived through is not in them. Prices are the last close’s, at a realistic fill near the mid; a thin chain fills worse than the model. And POP, expectancy and the outcome distribution are statistics about a structure under stated conditions (price paid, take-profit rule): what to do with them is yours. Questions welcome. Romuald - optionbench.com
-
Three years is long enough to make "50/50" feel like a myth
-

Trading Options – The Binary Way
VolatilityNotes commented on Kim's article in SteadyOptions Trading Blog
This article is quite old, so some of the broker information has changed since it was published. For more current comparisons, DayTrading.com and BinaryOptionsVision are two useful places to start. BinaryOptionsVision’s broker directory brings regulation, payment methods and account conditions together here: https://binaryoptionsvision.com/brokers I’d still verify the regulatory details independently before depositing, but comparing more than one source usually gives a clearer picture. -

Schwab and ThinkOrSwim Outages - login, transfers
briskauger48 replied to mrputsncalls's topic in General Board
That sounds frustrating. Hopefully Schwab fixes everything soon. It’s never good when you can’t access your account or transfer money when you need to. -
Doing pretty well with calendar screener on this tool. This week I am up: V calendar up 30% BA calendar up 24% Looks like that has also been the most winning trades based on the earnings study data: https://i.imgur.com/FXSlvG2.png
-
I think I found the root cause, and the update should propagate in the next few hours. Let me know if you see improvements.
-

Stop Loss and no exit date for TLT in steadyyields
Yowster replied to mangaloreab's topic in General Board
To add to Kim's comment. Steady Yield will use trade allocation sizing to control risk levels. Also, using trade structures where risk is defined and such that the risk is not much higher than the reward (so no trades where $9 is risked to make $1) -

Stop Loss and no exit date for TLT in steadyyields
Kim replied to mangaloreab's topic in General Board
Usually we close those trades 2-3 weeks before expiration to reduce the gamma risk. As for stop loss, I don't believe we have a hard stop loss, but biggest loss was around $2,400. As a side note, strategy specific questions are best to be posted in the strategy topics and not in the general forum. -
Hi all, Could someone reply to the following please? Whats the exit date for TLT under SteadyYields ? Also what is the stop loss recommended for all trades ? Thanks Mangaloreab
-
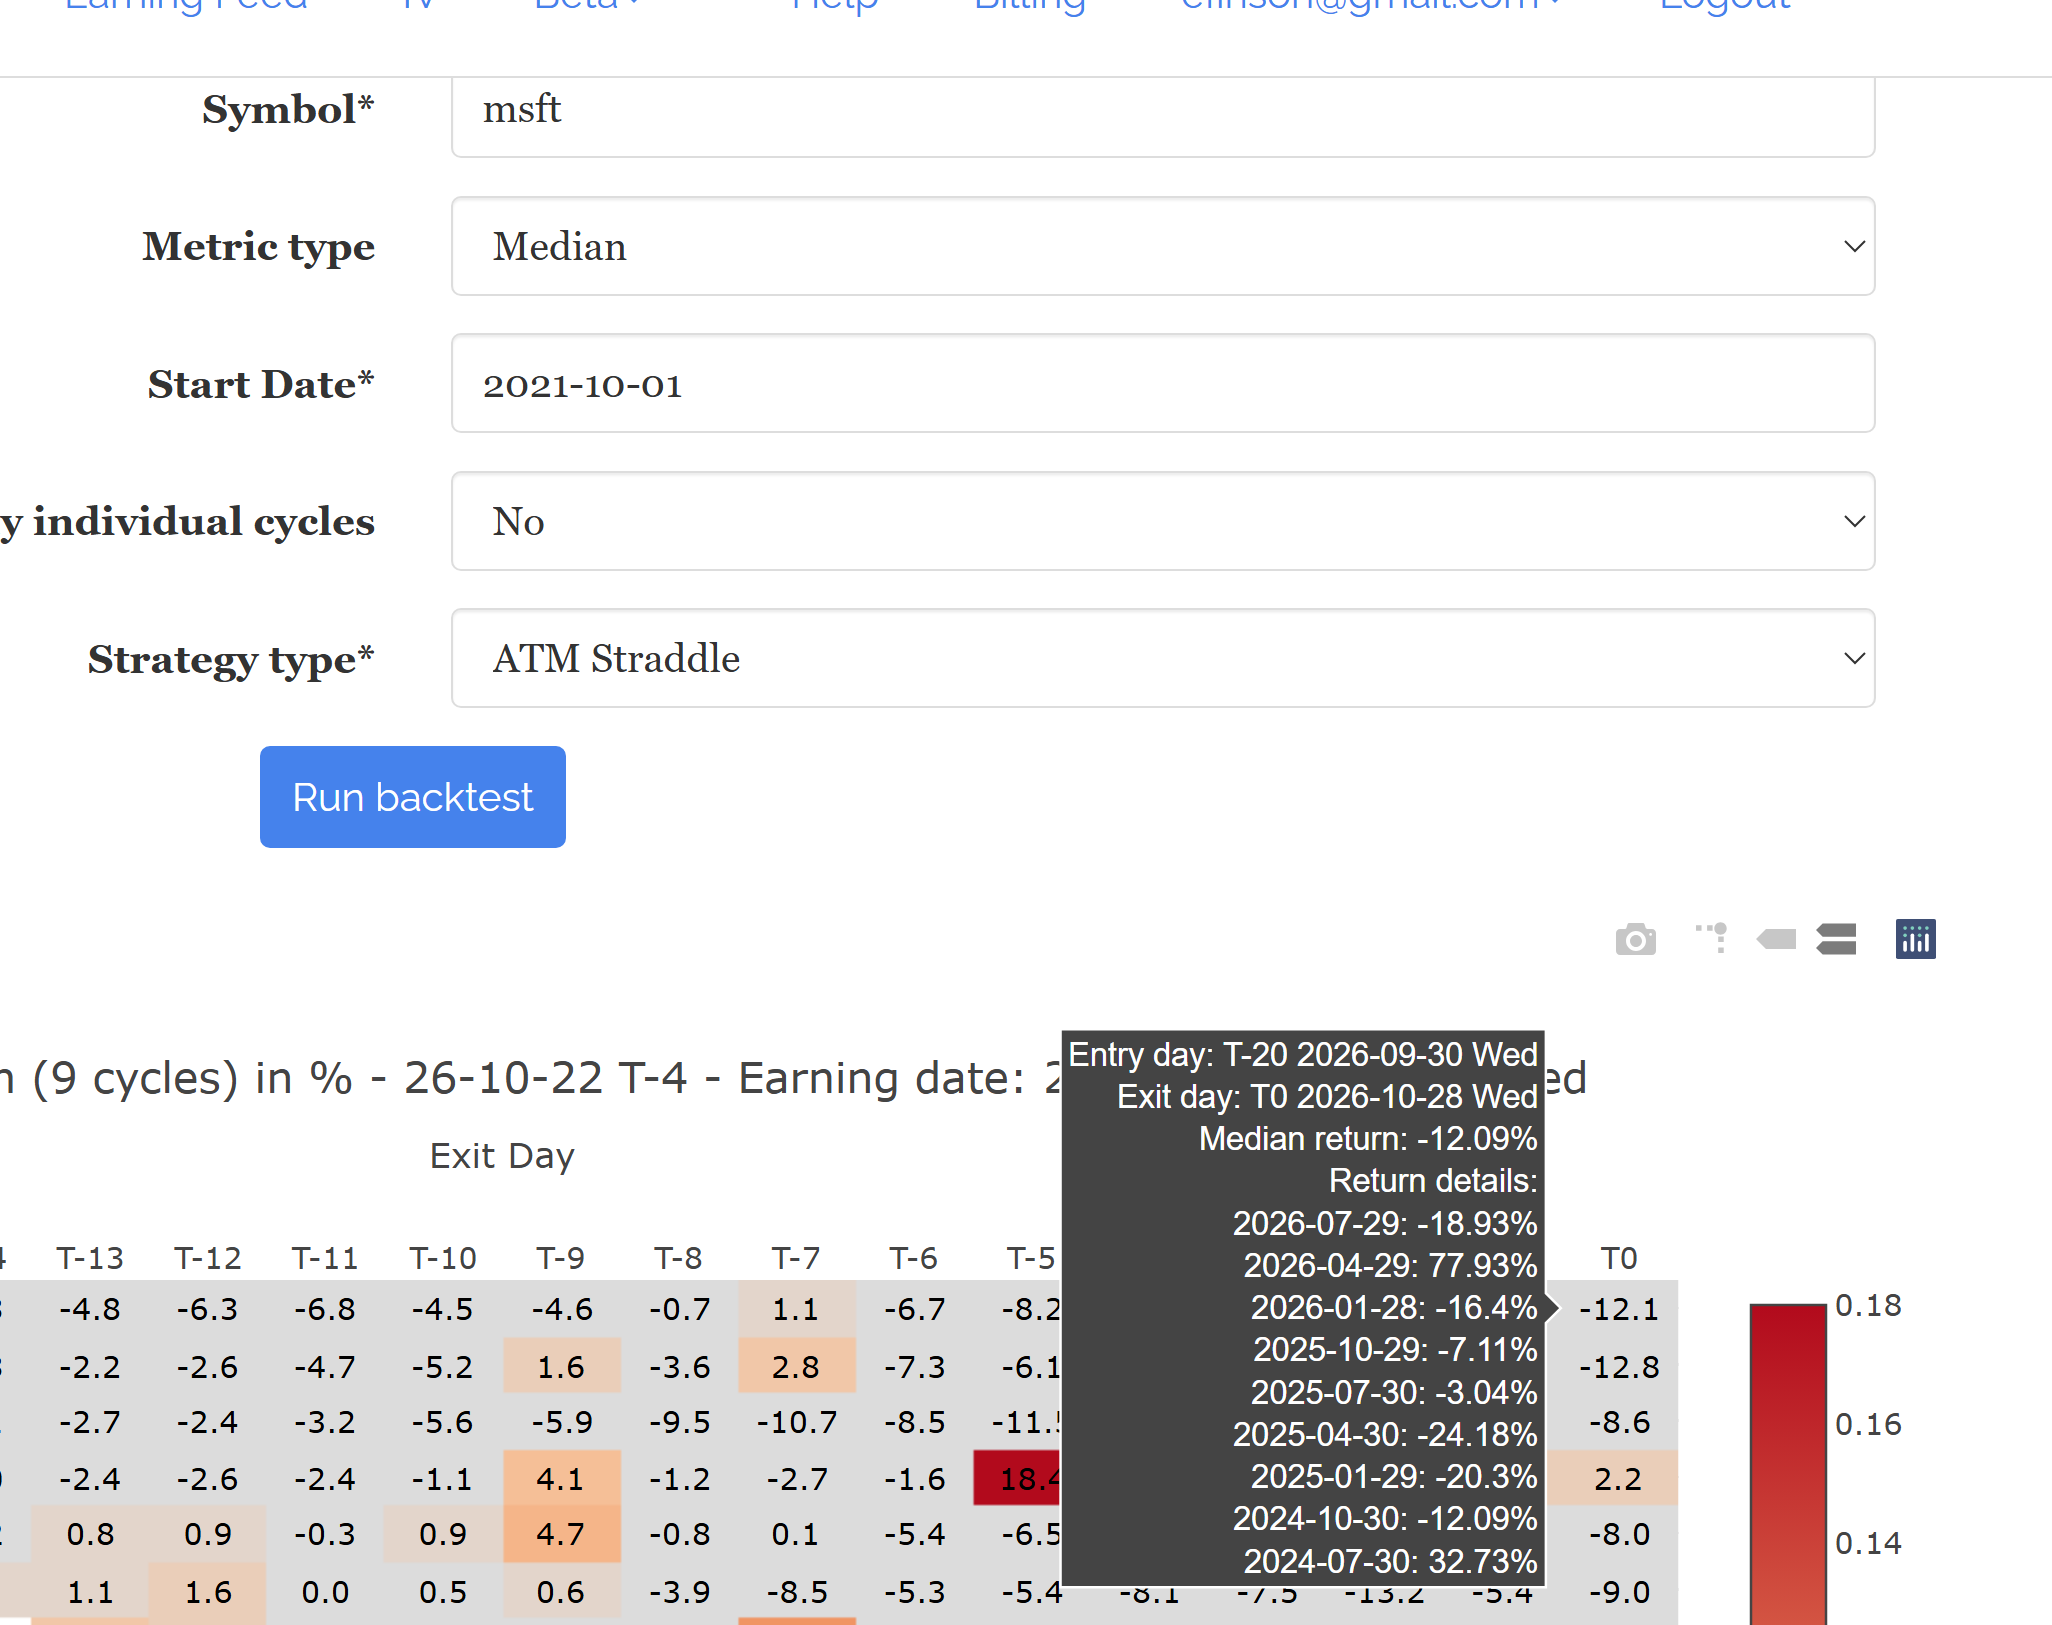
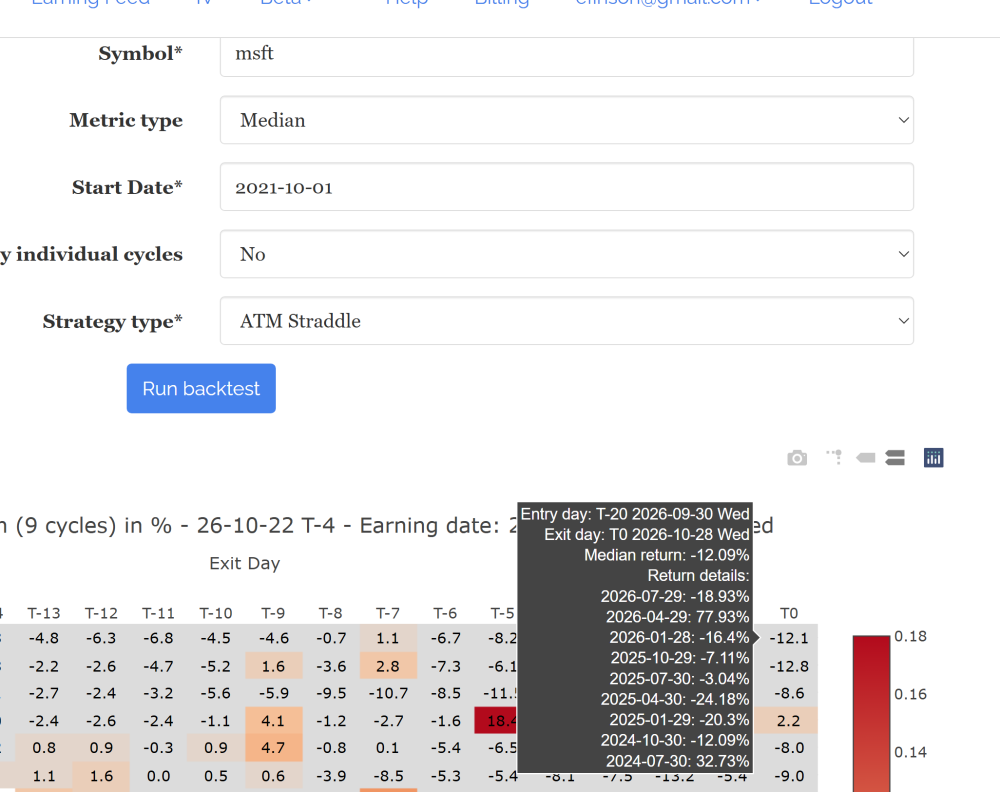
Here is an example for MSFT
-
Do you have an example like which symbol and which strategy type? Also do you change the default start date (normally today minus 2 years so it’s 8 cycles)?
-
Hi, Under the return matrix it sometimes only returns 9 cycles for most tickers even if a longer history is selected. The next day many times it goes back to the selected history. This has happen a few times Thanks
-
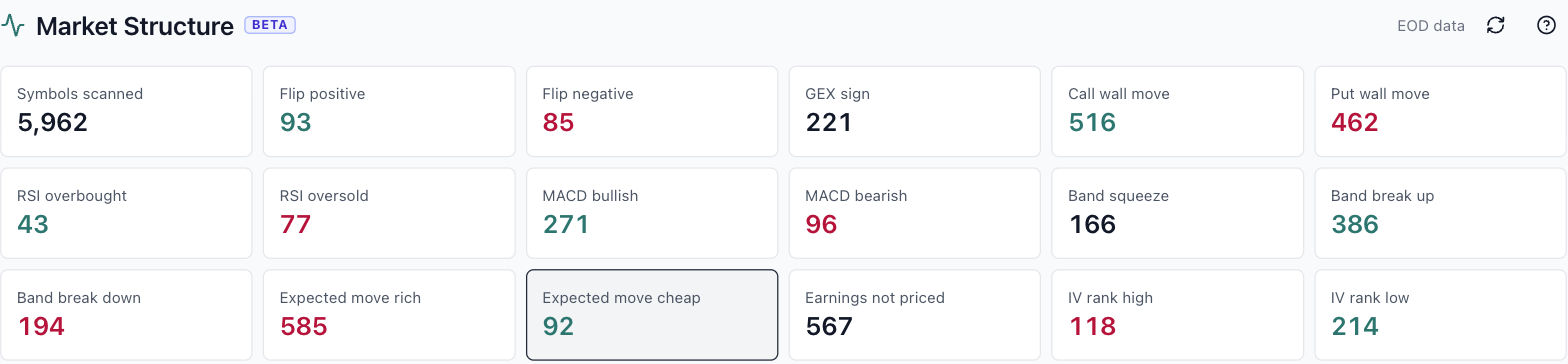
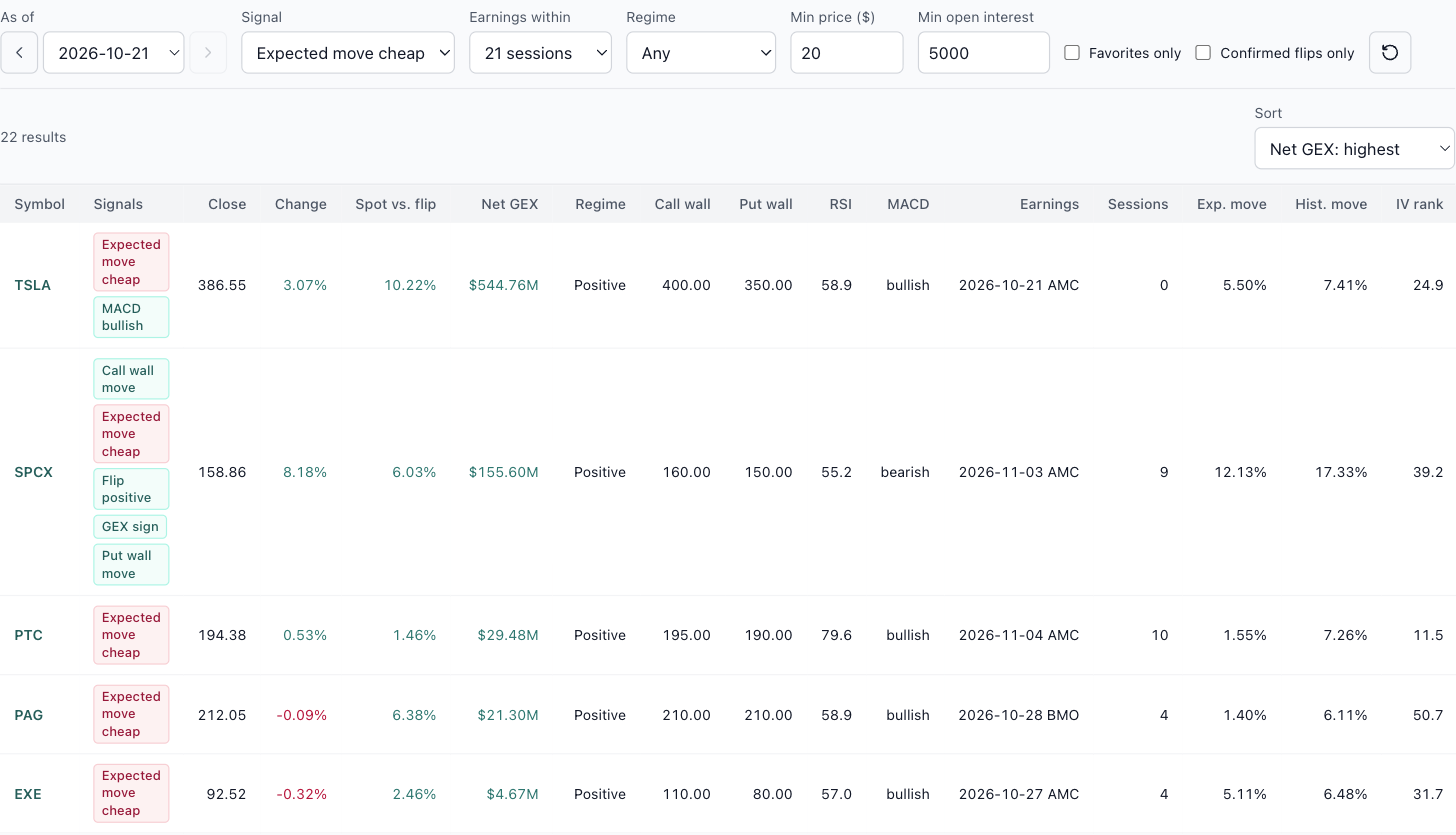
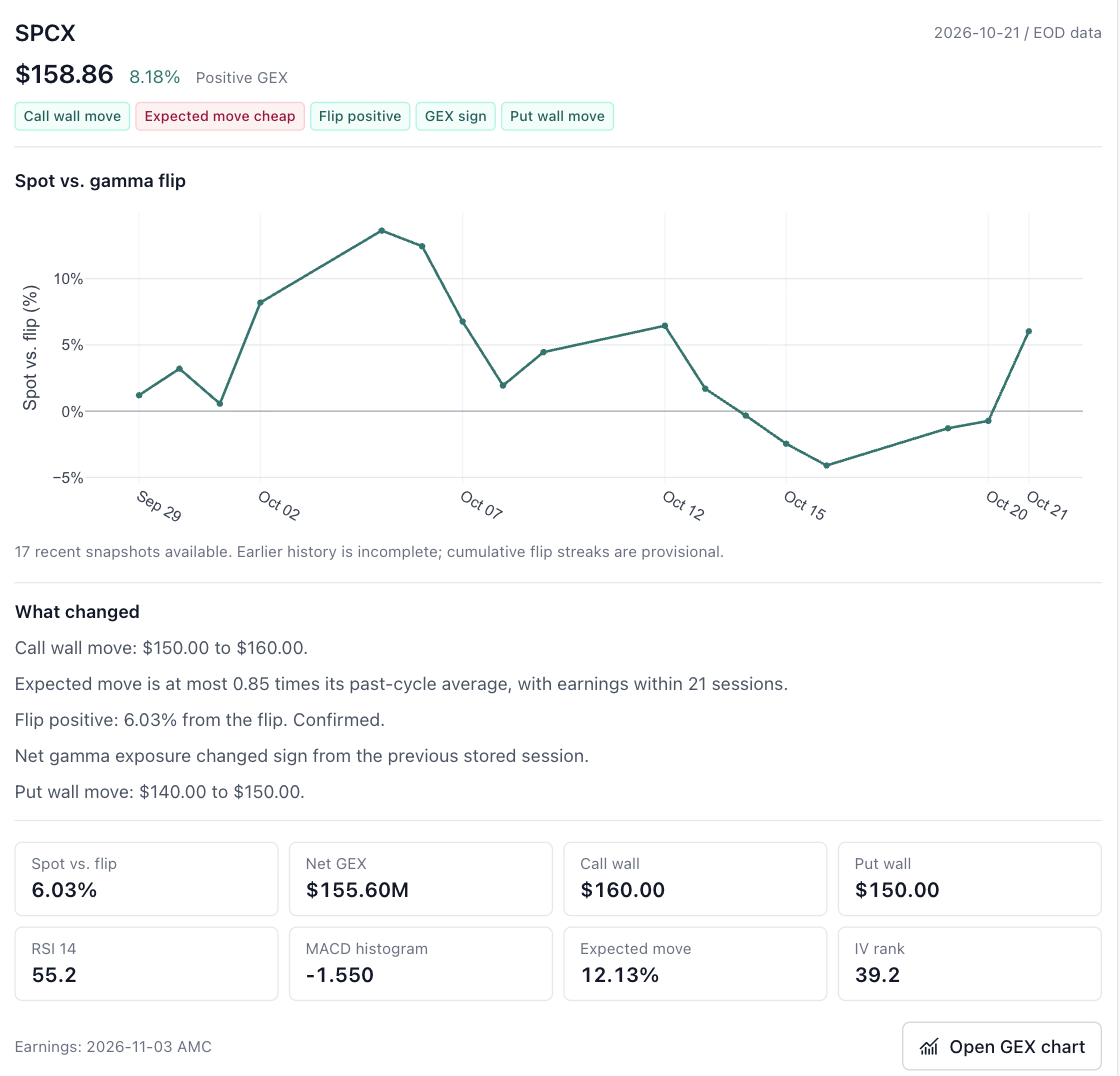
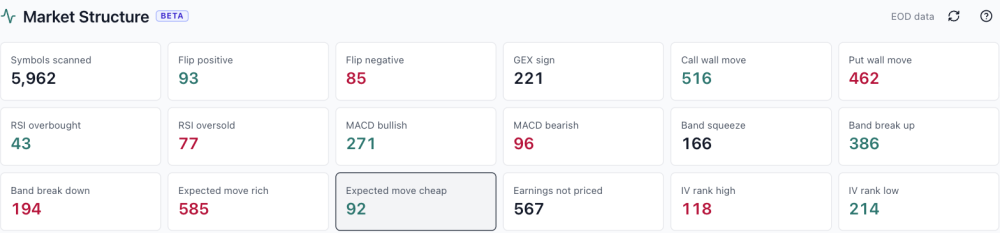
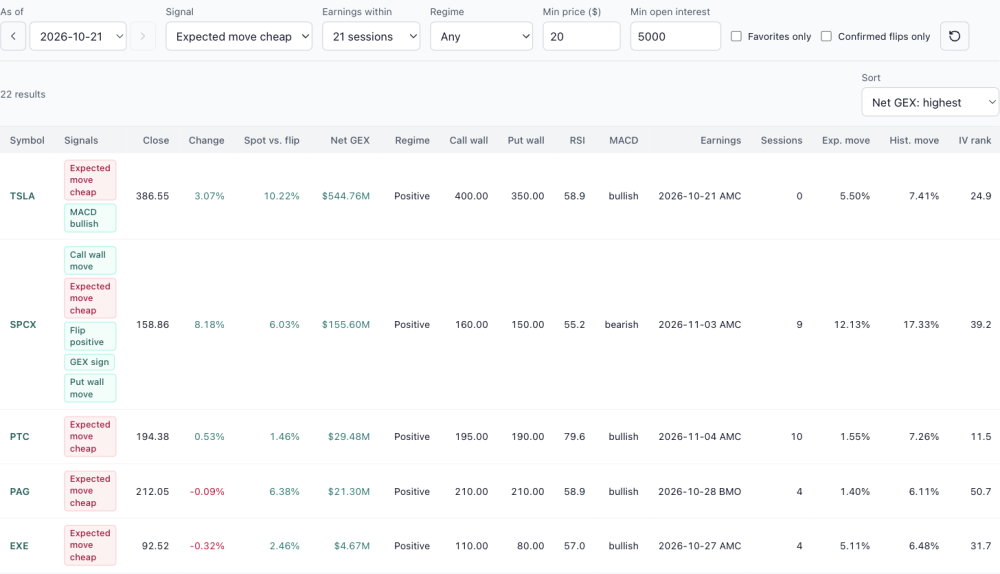
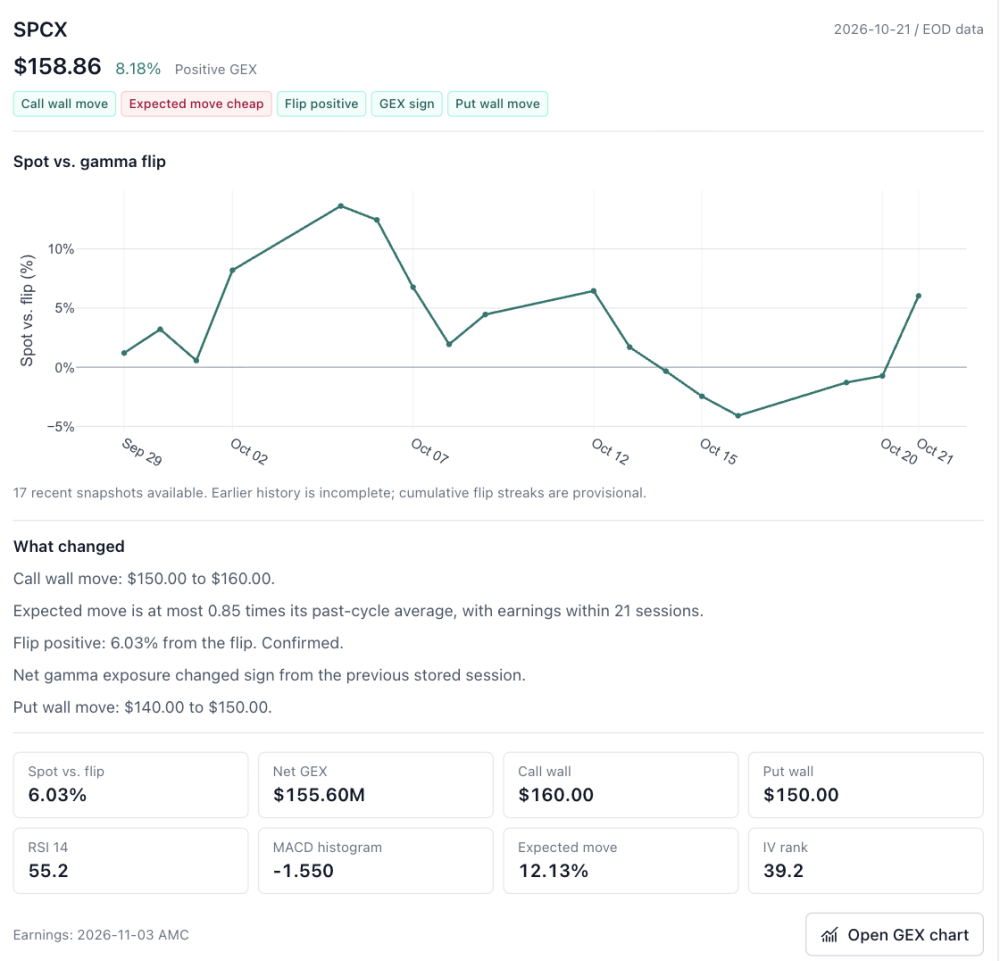
Market Structure is open (Beta) Earlier this week I said Market Structure was coming. It's open now: look for Market Structure in the sidebar, under the Market Structure section. It carries a Beta label because it's the first version. I'll keep improving the page over the coming weeks, and your feedback will shape what changes. What it does. Every evening it scans every optionable stock from EOD data (5,962 symbols on Oct 21) and counts what stood out across 17 signals in three groups: Positioning: net gamma flipping positive or negative, net GEX changing sign, and call wall or put wall moves. Momentum: RSI overbought and oversold, MACD crosses, and Bollinger Band squeezes and breaks. Earnings pricing: expected moves priced richer or cheaper than the stock's own history, reports the options haven't priced in yet, and IV rank high or low. Market Structure (Beta), EOD Oct 21. How to use it. Click any count, or pick a signal from the list. Then narrow it down: earnings within 5 to 120 sessions, positive or negative GEX regime, minimum price, minimum open interest, your favorites only, or confirmed gamma flips only. Sort by net GEX, distance from the flip, nearest earnings, IV rank or RSI. The As of control steps back through recent sessions, so you can see what the scan said on an earlier day. An example. "Expected move cheap" flags stocks whose priced earnings move is at most 0.85 times their past-cycle average, with a report inside 21 sessions. On Oct 21 that was 92 names. Adding a $20 minimum price and 5,000 minimum open interest cut it to 22. Expected move cheap, earnings within 21 sessions, min price $20, min OI 5,000. Read the Exp. move column (what the options price in for the report) against Hist. move (what the stock actually did in past cycles). SPCX, reporting Nov 3, priced 12.13% against a 17.33% history, and on the same night it flipped to positive gamma with both walls moving higher. PAG priced 1.40% against 6.11%. A gap that wide deserves a second look at liquidity before you trust it. Details on any name. Click Details on a row for the stock's distance from the gamma flip over recent sessions, a plain-English list of what changed that night, the key levels, and a link straight to its GEX chart. SPCX details panel, EOD Oct 21. Why Beta. The history behind each stock is still short (about 17 sessions so far), so flip streaks are marked provisional, and signal thresholds may be tuned as the history grows. GEX levels rest on a standard assumption about dealer positioning, since the data carries no trade direction. Treat every flag as a place to start looking, not a signal to trade. Before acting on a name, open its strategy pages and check the RV chart and History Matrix against its own past cycles. If a signal is missing, a filter would help, or something looks off, send it with the Ask button in the top bar. It attaches the page you're on. Educational research only, not trade advice. Model estimates from EOD data; past cycles don't guarantee future results.
-
Thanks for the demonstration, @krisbee. The Earnings Study tool is becoming quite feature-rich. The narration above will be quite helpful, especially to newcomers to SO who haven't had the benefit of being part of the years of forum dialog that have led to the creation of the various SO strategies and the tool itself. The Median return matrix is helpful, but the the "Reached Target" option adds a dimension that I find very useful, since it allows me to examine potential quicker in-out trades with a possibly lower target. I'm also looking forward to using the spread builder/modeler you mentioned. Keep it up.
-
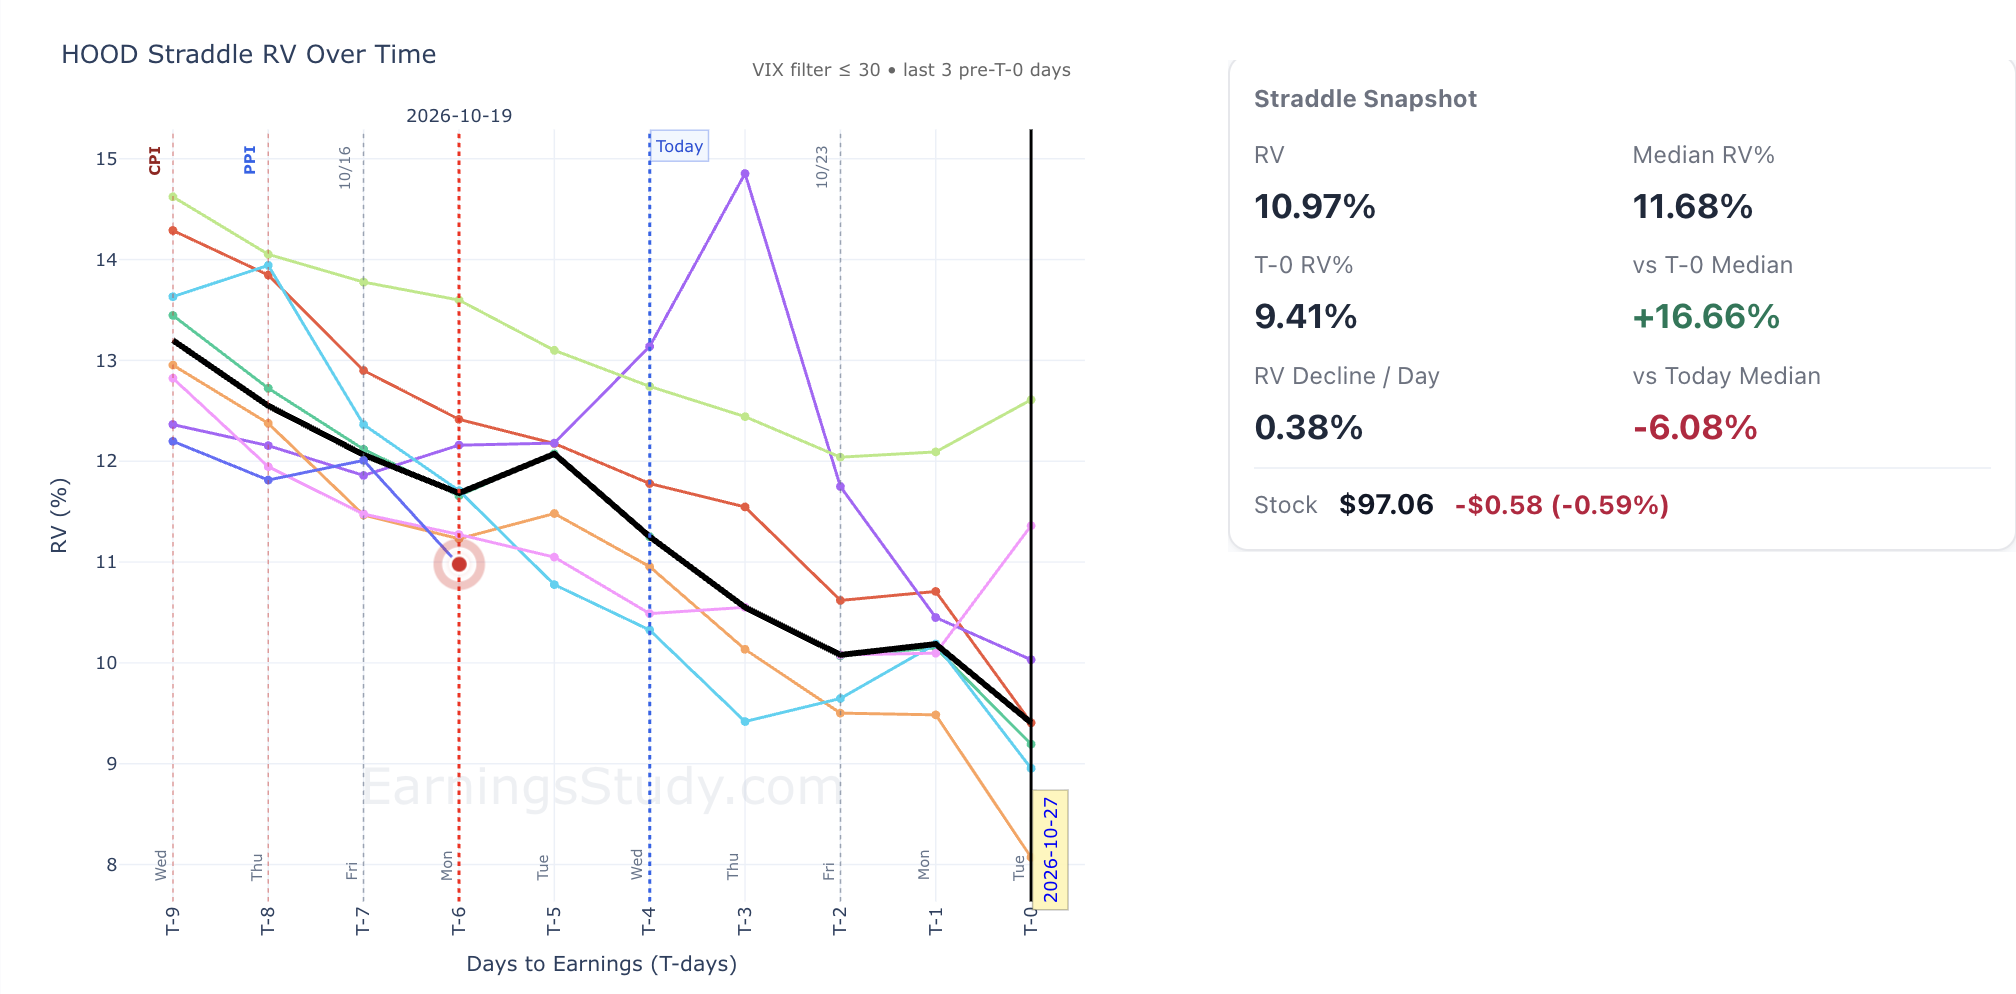
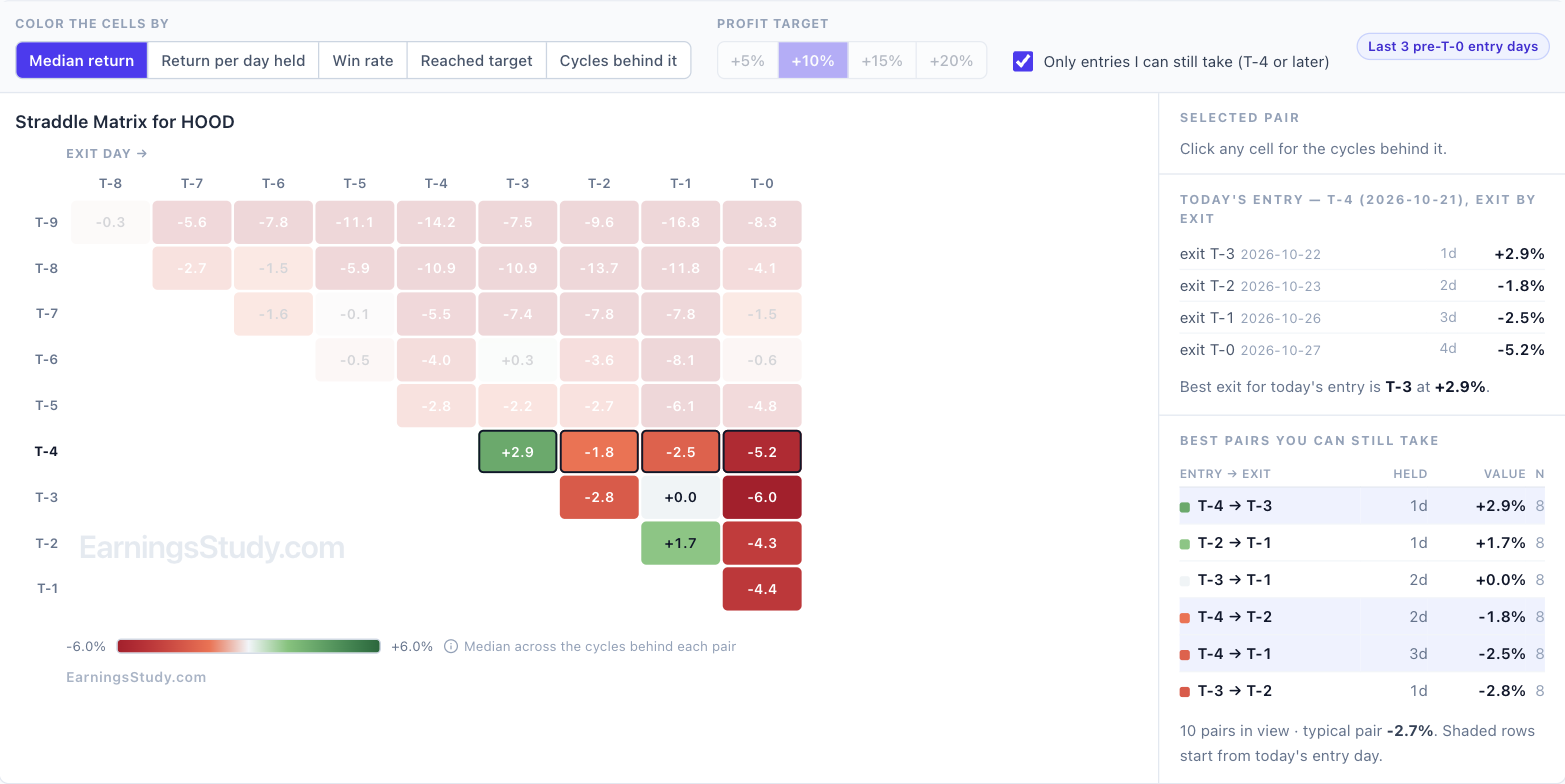
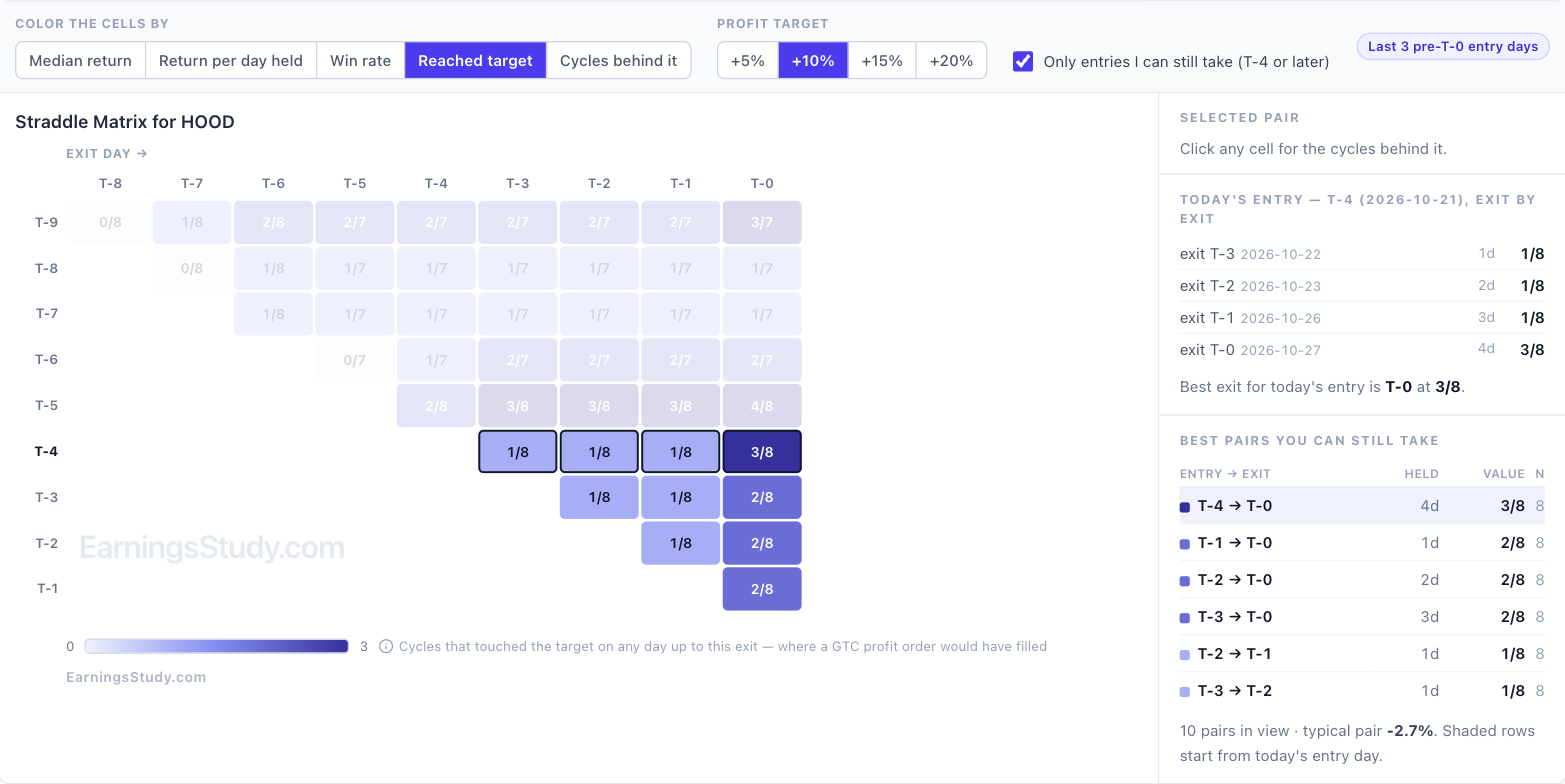
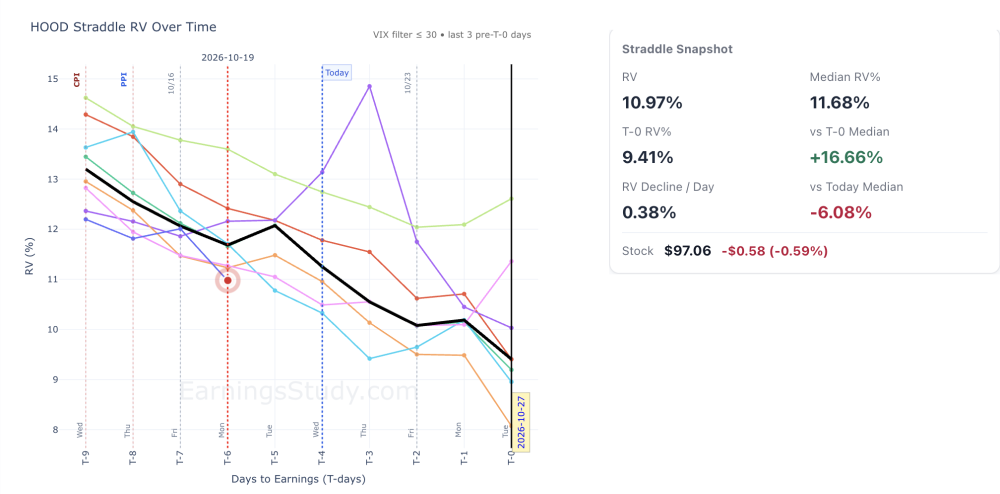
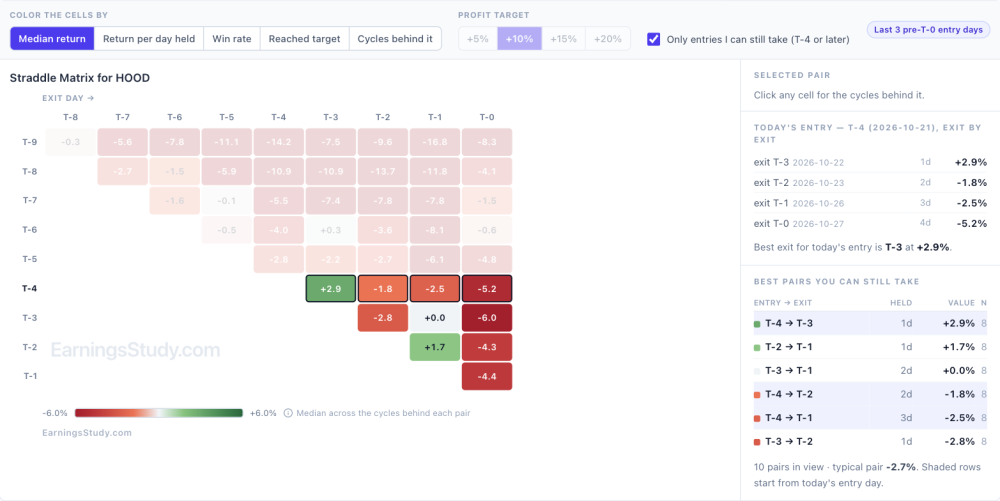
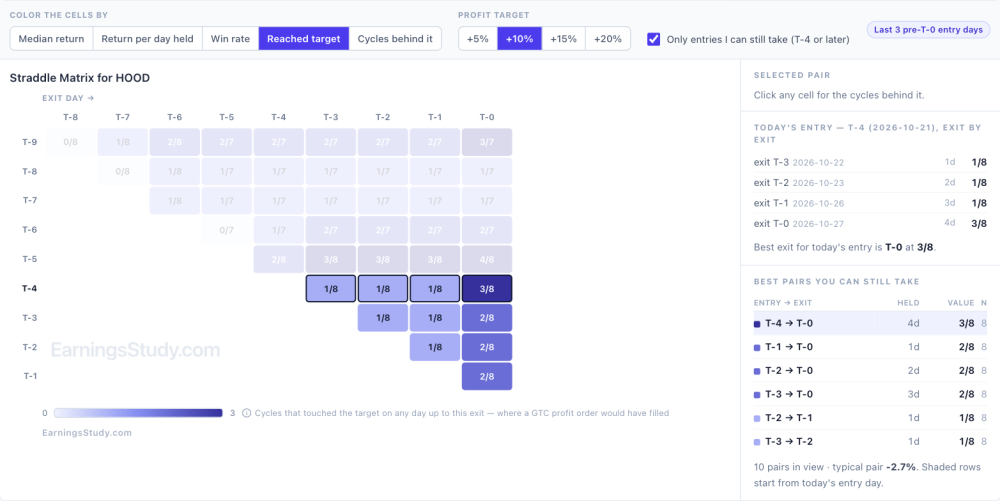
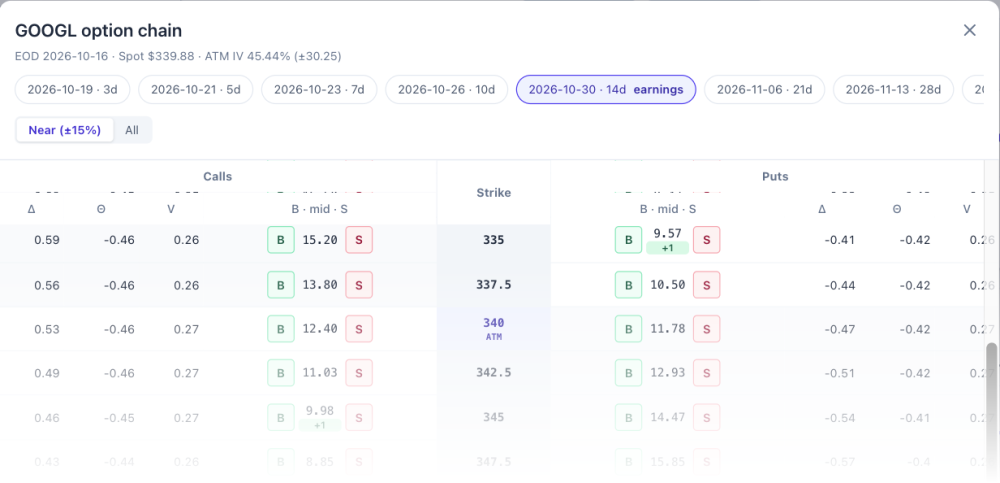
HOOD's straddle looks cheap. Is cheap enough? HOOD reports Tuesday, Oct 27 after the close, and its straddle is priced below its own history. That's where a lot of people stop and buy. It's worth three more minutes, because "cheap" only tells you what you're paying, not what that price has led to. 1. The price. The Straddle RV chart compares the straddle's price, as a percent of the stock price, with the same T-day in past cycles. At the Oct 19 close (T-6) the at-the-money straddle cost $10.65 with the stock at $97.06: an RV of 10.97%, against an 8-cycle median of 11.68% for that day. About 6% cheaper than its own history. HOOD Straddle page, data as of Oct 19 close. Black line is the 8-cycle median. 2. The path. Follow the black median line to the right. It falls to 9.41% by T-0, about 0.38 points a day. If the stock doesn't move and the straddle follows the median, it gives up about a seventh of its value relative to the stock by the report. A 6% discount doesn't cover that. 3. What entering here actually returned. Scroll down the same page to the History Matrix. Each cell is the median return of entering on one day (rows) and exiting on another (columns), across the same 8 cycles. For HOOD, almost every cell is red. Of the 10 entry and exit pairs still available from T-4 on, the typical one returned −2.7%. Only two were positive: in at T-4 and out the next day (+2.9%), and in at T-2, out at T-1 (+1.7%). Holding to T-0 lost a median 5.2% from a T-4 entry and 6.0% from T-3. HOOD Straddle History Matrix, median return per entry and exit day, 8 cycles. 4. How often it paid along the way. Switch the matrix to Reached target. From a T-4 entry, 5 of 8 cycles touched +5% at some point before T-0, but only 1 of 8 touched +10% in the first three days and 3 of 8 by T-0. From a T-3 entry, 2 of 8 reached +10%. In plain terms: small gains showed up in some cycles, rarely grew, and mostly didn't last to the report. Same matrix colored by Reached target, +10%. Put together: the price is a little below history, the median path still bleeds into the report, and the trade history from here is mostly negative with few cycles reaching a meaningful target. A cheap straddle on a stock whose straddle usually decays is still a straddle that needs a move. If you take it anyway, the matrix says it has been a quick-profit trade, not a hold-to-the-report trade. To run the same check on any name: open the Straddle page, read the snapshot beside the RV chart, then scroll to the History Matrix, choose Beta, and color the cells by Median return and then by Reached target. The Market Structure scan I mentioned as coming soon will flag cheap and rich names across every symbol; these three views are how you decide whether one of them is worth taking. One more thing. Tomorrow I'm opening a new page I've been testing with the contributors: build a multi-leg position from the option chain and see its P/L before you place it, with the stock's own earnings history built into the volatility. Here's a corner of it. Teaser. Full reveal Friday. Educational research only, not trade advice. Past cycles don't guarantee future results.
-

The Last 14 Minutes: Why We Stopped Looking at Options Closing Prices
mccoyb53 commented on krisbee's article in SteadyOptions Trading Blog
Yes. @krisbee. That makes sense and it is intuitive as well. Thanks for your reply.