All Activity
- Past hour
- Today
-
 If you’re interested in investing as a beginner for the first time or expanding your portfolio, here are some effective steps to reduce investment risks in 2026. Prioritize research Research is vital, regardless of whether you’re a new investor or a seasoned pro with an extensive portfolio. Investing is risky by nature, and it comes in many guises. Even the most experienced financial advisers and investors can benefit from undertaking rigorous research before spending money. Research will enable you to learn about patterns and trends, get to grips with how specific types of investments work, understand what options are available to you, and get an idea of the level of risk involved. When researching, it’s critical to utilize high-quality resources and access guidance and advice from people who have the relevant knowledge. In the age of online trading and 24-hour access to apps, news channels, blogs, and online magazines, it’s easy to find information. The trouble is that not all of it is useful, accurate, or trustworthy. Stick to high-profile organizations and authorities and secure websites. Utilize expert advice Investing may seem simple on the surface, but it can be incredibly complex. Expert advice can help you gain clarity, make decisions, and determine which routes are best for you. Whether you’re exploring new commodities or stocks, you want to diversify, or you’re new to investing and you have a lump sum ready to go, it’s wise to take advantage of professional financial advice and investment portfolio services provided by trustworthy, top-rated firms. Experts can help you streamline strategies and explore different pathways based on your goals, how much you want to invest, and your existing assets. It’s important to note that you don’t have to act on advice. There should be no pressure or obligation to invest if you’re seeking guidance. Take your time to make decisions. You can find investment firms and trusted advisers online or ask people you trust for recommendations. It’s helpful to read verified reviews, check credentials, and arrange consultations to learn more about organizations or individuals before you proceed. Aim to diversify Diversifying is one of the best ways to lower risks as an investor. Investors are often warned about the perils of putting all their eggs into one basket. If you have a diverse portfolio, or your money covers a wide range of stocks, for example, there’s a smaller chance of losing everything if one investment fails. It’s wise to make sure you’re not too heavily reliant on a single commodity, type of investment, market, industry, or type of asset. Before you spread your bets, it’s beneficial to consider the best ways to build a more diverse portfolio. Your decisions should reflect your personal investment goals, your risk tolerance, and how active or passive you plan to be. Having a mixture of investments with varied risk levels and different ways of generating income can protect you against unexpected crashes or volatility. Outline personalized objectives It’s common to think about multi-million dollar portfolios when you hear the word ‘investment,’ but in reality, almost anyone can invest. More than 60% of Americans have stocks, but the richest 1% of investors hold half of the total value of the stock market. Many people invest small amounts in a bid to boost their income, save for the future, or lay down foundations for a comfortable retirement. When you invest, it’s crucial to outline personalized objectives. There are multiple ways to make money, but not all of them will be suitable for every investor. Before you decide where to spend money, what to buy or sell, or how much to invest, it’s wise to consider your goals. Are you eager to make as much money as quickly as possible? Are you interested in short or long-term investments? Are you planning to use the money as an extra income source or is growth your main objective? Once you know what you want to achieve, it’s easier to figure out a strategy that aligns with your targets and preferences. It’s important not to get sidetracked by others, as they may have different aims. Review your investments regularly The picture can change very quickly and unexpectedly when you invest money. From trading to flipping real estate, investments are vulnerable to external factors and forces that impact their value. If you’re an investor, reviewing your assets regularly, tracking market trends and prices, and evaluating your goals is beneficial. It may be advisable to adjust and modify your strategy to lower risks and respond to potential hazards. You may want to explore different types of investments or adapt timeframes if prices have fallen or new opportunities have emerged, for example. Using tools and cutting-edge tech can be helpful if you’re keen to be proactive in managing your portfolio, keeping up with news, and tracking market moves without spending all of your time worrying about your investments. Look for highly rated apps and reputable websites that offer access to news articles, guides, tutorials, and market updates with expert insights. Keep an eye on your cash reserves Investing is designed to help you increase your income and grow your wealth, but it isn’t always plain sailing. One of the main risks is that investors often have a lot of money tied up, with limited access to ready cash. Keeping an eye on your cash reserves is important to lower risks, protect assets, and minimize disruption if you do need money fast. A new year is a good opportunity to think about investing. Whether you’re new to the game or you’re eager to expand or diversify your portfolio, it’s beneficial to be proactive in reducing risks. Key steps you can take in 2026 include prioritizing research, seeking expert advice, diversifying your investment portfolio, outlining clear, personal investment goals, reviewing your investments regularly, and keeping a close eye on your cash reserves. This is a contribute post.
 - Last week
-

A bit of light humour after Thanksgiving
Hossain Anan replied to TrustyJules's topic in General Board
That is genuinely brilliant. He did everything right, deep research included, and still managed to run straight into one of the best corporate rebrands ever. At least he proved he understands due diligence, even if Alphabet made it harder than necessary. - Earlier
-
I'm not sure I would agree with your assessment regarding calendars. As @Yowster mentioned, number of calendars was much lower than most prior years as this year saw the calendars for many stocks having their calendar RV significantly higher than prior cycles, and therefore trades were not opened in these cases. So the issue was not the IV, but mostly number of trades when it comes to calendars. While the average return was lower than previous years, it was still close to double digits which is very respectful. And the lesson is that we will be doing more calendars in 2026 as long as there is a pattern of rising calendar RV heading into T-0. Many stocks show a tendency for calendar RV to rise regardless of current levels, but we didn’t open trades on these stocks if the current RV was elevated. While we wouldn’t want to enter if calendar RV was sky high, hindsight showed that opening trades when RV was slightly to moderately elevated wound up being winners.
-
I’ve learned a lot from SO and appreciate the transparency and consistency behind the process. One point I’d add to the discussion is that RV works well as an analytical framework, but in execution we are trading IV. Many calendar and DD trades implicitly rely on front-month IV still building into earnings while back-month IV remains relatively cheaper. In 2025, I think that earnings IV in many underlyings was already priced in much earlier than historical data suggests, leaving little room for further front-IV expansion. In that setup, the structural edge of calendars and DDs is reduced even if RV metrics still screen attractively.
-
Hi @Djtux! Can you take a look at stockprice relative change on the straddle charts? I've run into a few tickers with missing/incomplete Q4 info (IBM, TMO, and a few others I forgot to note) Thanks!
-
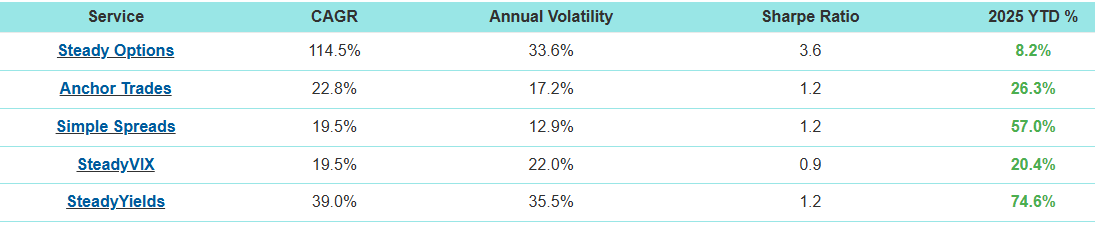
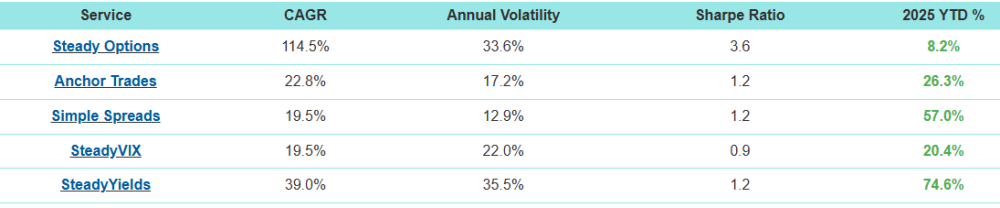
Anchor Trades 2025 Summary: Anchor model portfolio was up 22.5% in 2025 vs. 16.4% return of S&P 500. Since inception in 2019 Anchor model portfolio is up 296.0% vs. 173.1% return of S&P 500. Since the end of 2022 when both Anchor and S&P 500 were down, Anchor is up 122.6% vs. 78.3%. Anchor continues crashing the S&P 500 year after year. Thank you again @cwelsh for an amazing management of the strategy!
-
Thank you very much.
-
Recent GLD, IWM and AMZN trades traded 1 spread per $25k model portfolio (average size was around $2-2.5k per spread, close to 10% of the model portfolio). So with $1M account, you would do 40 spreads. I would say very doable for those stocks. Of course some stocks are lower prices and slightly less liquid, so for the model portfolio they traded 3-5 spreads, so you would need 120-200 spreads. Still doable, but you might experience a bit more slippage. Still, if you trade a $10 spread, even paying few cents more is not a big deal percentage wise. So the bottom line is: very easy and scalable for $100-300k accounts, a bit more difficult but still doable for $500k-$1M accounts.
-
With respect to scalability, is it possible to trade a $100,000, $500,000, or $1,000,000 account?
-
 carlos joined the community
 -
SteadyYields 2025 Summary: SteadyYields is our best performing service in 2025, producing 74.6% return. As always, we aim to under promise and over deliver. The strategies use highly liquid instruments like TLT, GLD, QQQ, XLE etc. They are fully scalable, low maintenance and easy to follow. Considering that we usually risk only 50-60% of the model portfolio at any given time, and the return includes one large loss, I consider the performance beyond remarkable. Many thanks to by our contributor @Romuald for designing the algo and our contributor @Yowster for managing the strategy. The service is only $150/month or $1,200/year and based on the performance, the price is expected to increase in 2026. This should be a $500/month service. If you started 2025 with $100,000, your portfolio would be up $74,600 by now. Not a bad return on $1,200 investment.
-
Simple Spreads 2025 Summary: Simple Spreads model portfolio was up 57.0% in 2025 vs. 16.4% return of S&P 500. We closed 41 trades in 2025 (3.4 trades per month). Since inception Simple Spreads model portfolio is up 101.7% vs. 43.6% return of S&P 500. As always, we prefer to under promise and over deliver. That means that if you started with a model portfolio of $25k, you would make almost $15k in 2025 alone. That's 15x return on $1k investment (the subscription fee). This doesn't even include all unofficial trades - those alone are worth 10+ years of the subscription fee. What a bargain! Thank you again @krisbee for an amazing management of the strategy!
-
Recent trades include GLD, IWM, AMZN, IBIT, AMD etc so I would say VERY scalable.
-
How scalable is Simple Spreads?
-
 VerticalSpread joined the community
 -
 jpomerenke joined the community
 -
 Matita78 joined the community
 -
 delrey33 joined the community
 -
 Aaronshrt joined the community
 -
 liveRobot joined the community
 -
Thank you @Yowster for an excellent summary as usual. Few comments. First, we are definitely working hard to make adjustments to our strategies in order to get back to the previous years performance. Specifically: We will do more calendars even if the RV is slightly elevated, as long as there is a pattern of rising calendar RV. We will be using our newly introduced strategy Pre-earnings Iron Condors, but use a better risk management to prevent larger losses. We will be more selective with Hedged ratios and BWBs to limit the losses. Straddles/Strangles: we will likely try to cut the loss before it reaches double digits. As a general note, no strategy can work 100% of the time. Our model portfolio was still up in 2025, just not as much as in the previous years. The market conditions have been very different in 2025, and it's unrealistic to expect any strategy to work all the time. That said, our other strategies performed very well. If you invested an equal amount of money between all our services, your portfolio would be up around 37%. As always, diversification is the key. I don't know what the future holds, but I am confident that the strategies we use are solid and are based on probabilities. Sometimes it just takes more time for the probabilities to play out. I'm also aware that some people join based on 13 years of triple digit returns but cancel after a few sideways months. This is similar to someone who entered the market at the beginning of Covid in 2020, based on ~10% yearly historical returns, and exited a few months later after 30% drawdown, just to watch the markets more than doubling in the next 5 years.
-
@Yowster thank you very much for this summary ... it was a tough year and my SO account ended up slighlty in the red (-0.31% before comms, -1.2% with comms).... but I am not deterred going into 2026 as this strategy has a risk:reward profile that I can better manage .... I have been working on improving my knowledge of the put calendar trade strategy so that I can be more proactive with my trades instead of waiting for alerts in the forum ... I will keep in mind the observation that RV's with slightly higher than previous cycles may make good trades ... thanks again to all SO members and looking forward to a prosperous 2026
-
As I do at the end of each year, I’ve broken down the Steady Options 2025 trade performance by trade type. Numbers were taken directly from the data in the Performance screen (plus some recently closed trades). Here’s are this year’s stats along with some comments from my perspective. Where applicable, I added totals from prior years for comparison. Unfortunately, 2025 was Steady Options worst performing year. I’ll try to present what I believe to be the main reasons for this as they apply to each type of trade. From an overall perspective, here are some key points that I believe factored into the performance: Most SO trades are Vega positive trades leading up to earnings events, so volatility plays a key role in the outcome of our trades. Volatility rising helps trades and volatility declining hurts trades. 2025 saw 4 VIX spikes that occurred rather quickly (not a gradual rise), most spikes were relatively short in duration with declines starting shortly after the spikes. When you look at the year in total, the vast majority of the time we were in time periods where volatility was falling. Trades that were in place prior to the spike performed well, but other trades that did not encompass a spike commonly dealt with falling volatility and RV declines bigger than prior earnings cycles. This meant that trade that would have been small to moderate gains in prior years turned into small to moderate losses this year. Losses above 10% were also more common. There were some things that worked very well this year, although they were in some of the portfolios outside of SO. Steady Yields (SY) and Simple Spreads (SS) performed very well as many of their trades were helped by the same things that hurt the SO trades. Most trades in SY and SS tended to be Vega negative, meaning that they were helped by declining IV – so both time decay and declining IV helped these trades. Pre-Earnings Calendars 24 Trades – 21 win, 3 loss (88% win) – Average Gain +8.77% 2024: 65 trades (81% win) – Average Gain +12.13% 2023: 65 trades (85% win) – Average Gain +9.56% 2022: 11 trades (64% win) – Average Loss -9.55% 2021: 110 trades (79% win) – Average Gain +12.82% 2020: 33 trades (85% win) – Average Gain +21.97% 2019: 54 trades (65% win) – Average Gain +9.27% 2018: 40 trades (78% win) – Average Gain +9.61% 2017: 31 trades (84% win) – Average Gain +13.81% 2016: 44 trades (80% win) - Average Gain +15.07% 2015: 51 trades (80% win) – Average Gain +12.67% 2014: 48 trades (71% win) – Average Gain +13.80% 2013: 24 trades (88% win) – Average Gain +20.60% Comments: Overall winning percentage was at the high end compared to prior years, but average gain per trade was at the lower end. This year lacked some larger gains that we got in prior years (likely due to volatility declines). Number of trades was much lower than most prior years as this year saw the calendars for many stocks having their calendar RV significantly higher than prior cycles, and therefore trades were not opened in these cases. There was a learning here to take forward into next year. For calendar trades entry we look to enter at lower RV levels and/or on stocks that show a pattern of rising calendar RV heading into T-0. Many stocks show a tendency for calendar RV to rise regardless of current levels, but we didn’t open trades on these stocks if the current RV was elevated. While we wouldn’t want to enter if calendar RV was sky high, hindsight showed that opening trades when RV was slightly to moderately elevated wound up being winners. Earnings calendars continue to be a core SO strategy. Straddles/Strangles 42 Trades - 21 win, 20 loss, 1 break-even (51% win) – Average Loss -0.56% Breaking down further by hedged and non-hedged: Non-Hedged – 21 win, 17 loss, 1 break-even (55% win), average gain +0.24% Hedged – 0 win, 3 loss (0% win), average loss -10.97% 2024: 57 trades (73% win) – Average Gain +4.72% 2023: 166 trades (64% win) – Average Gain +1.65% 2022: 148 trades (71% win) – Average Gain +4.89% 2021: 129 trades (68% win) – Average Gain +3.27% 2020: 118 trades (67% win) – Average Gain +2.80% 2019: 106 trades (68% win) – Average Gain +3.58% 2018: 72 trades (83% win) – Average Gain +5.40% 2017: 77 trades (79% win) – Average Gain +5.02% 2016: 18 trades (72% win) – Average Gain +5.19% 2015: 44 trades (68% win) – Average Gain +2.61% 2014: 74 trades (62% win) – Average Gain +2.54% 2013: 104 trades (57% win) – Average Gain +1.35% Comments: Lower number of straddle/strangle trades compared to prior years, due primarily to double diagonal (DD) trades which have similar gain targets to straddles and strangles but can be kept open longer. Overall winning percentage and average gain per trade were at lows. This is primarily due to the decline volatility which saw straddle RV dropping by larger percentage compared to cycles in prior years. When the stock price did moves, gains were often muted when factoring in the larger RV declines. From a downside risk perspective, we saw more losses above 10% compared to prior years with 7 of the 20 losing trades having a loss greater than 10%. 12% of trades hit 10% gain target, which is lower compared to prior years. These trades remain low risk trades as it takes RV dropping much more than their prior cycle tendencies to be significant losers – unfortunately we saw more cases of the outsized RV drops this year. Double Diagonals DD trades have the goal of having performance similar to straddles/strangles – but have the ability for the trades to be open for much longer periods of time (up to 3 weeks prior to earnings) giving the stock more time to move but still have minimal downside risk. 48 Trades - 28 win, 19 loss (60% win) – Average Gain +0.79% 2024: 52 trades (73% win) – Average Gain +4.86% Comments: Winning percentage was down from last year and average gain per trade was only slightly positive. Again, a result of RV declines more than prior years. What were small winners last year because small losers this year. Last year, all losing trades were under 10% losses (majority of losses were under 5%). This year we saw 6 losses above 10%, but all losses were under 20%. The DD trade is a low risk trade type with minimal downside risk, but this year has shown that when RV declines are more than expected then losses in the 10%-15% range can occur if the stock price doesn’t move. 25% of trades hit 10% gain target (compared to 35% last year). This is not a huge difference, it means that when the stock price moves you can hit that 10% gain target regardless of what happens with RV. Pre-earnings Iron Condors In the 4th quarter we introduced the pre-earnings Iron Condor (IC) trade as a way to get a Vega negative trade type into the SO mix of trades. We targeted stocks that have a consistent and large straddle RV decline heading into earnings whose historical straddle performance show mostly losing trades (meaning the stock price doesn’t tend to move a lot prior to earnings). 10 Trades - 7 win, 3 loss (60% win) – Average Gain +0.07% Comments: Large percentage of winning trades, but one of the three losing trades was an oversized loss when stock price made a big move corresponding to a larger market downturn. Will continue with these trades in the future, trying to limit those bigger losing trades by keeping risk vs reward near equal and by selecting stocks whose straddle RV decline is both large/consistent and happens in a relatively short period of time. Other Trades Non-Earnings RICs: 2 win, 1 loss (67% win) – Average Gain +0.00%. These non-earnings trades have higher downside risk if stock price doesn’t move. In this case the 1 loss equaled the 2 wins. Hedged ratios and BWBs: 2 win, 3 loss (40% win) – Average Loss -10.90%. These were hedged directional trades, the losses were larger when the stock price didn’t move in the right direction. S&P500 addition date trade: 1 win, 2 loss (33% win) – Average Loss -14.50%. These trades play for stock price decline (or at least staying flat) after the S&P500 addition. The pattern of prior year additions was broken this year. Several of the additions this year had much less lead time compared to prior years, so this might be a factor. Summary 2025 was a very challenging year for the Steady Options model portfolio. We used the same types of trade setups and analysis that has worked for us year after year. However, the market behavior this year yielded underperforming trade results. Going forward, we will continue to try to optimize trades and limit losses – but one underperforming year does not mean we need to re-think every type of trade as they have performed consistently well in prior years As always, I’d like to highlight and thank the SO community. We continue to have a group of very smart people that seems to grow each year who share their ideas and knowledge – this is what makes SO great. Looking forward to a better 2026.
- 4 replies
-
- 16
-

-

-

-
I found the answer with some help here. the short exp is the friday after earnings and the long exp is the monthly exp after that. I couldn't find how to delete my post so I just leave it for anybody who was wandering. I wish the expirations were editable like with the charts.
- 1084 replies
-
- 1
-
-
- volatilityhq
- volatilityhq.com
- (and 1 more)
-
I've been using your excellent service for several years now. However, the "Dbl Cal. Cur RV" and "Dbl Cal. Med Cur RV" columns in the scanner don't match my own calculations. Could you please explain what I'm doing wrong? My approach is as follows: I take the mid-price of an ATM double calendar (buying the Friday after earnings and selling the Friday before earnings), then divide it by the current stock price. Are you perhaps using different expirations in the scanner? The charts show the exact RV I'm expecting, so my confusion is specifically with the scanner values. Thank you!
-
I see this is an older video and the quality of audio is not so great. It would be nice to have an updated video on this matter and maybe have some explanations with how we can calculate the probability for the trade to be sucessful etc.
-
This breakdown reminds me why I always say performance has to be viewed across cycles, not snapshots. 2024 gave both low-vol and stress moments, and the way downside was contained during volatile periods is what really matters long-term. The DD introduction feels like a smart evolution—same philosophy, better time flexibility. That kind of gradual refinement is how real edges last.
-
Thanks, I was thinking to also test TastyTrade, if you compare this with IB, what would be the pros for using Tasty? Thank you!
-
Hello, You can go to your Portfolio > click on your Open Option Position > click on the Position size > you will now have 4 options: Roll Position, Exercise/Roll, Close Position, View lots
-
Hello, Just curious, do you use IB API to automatically trade options via API? If yes, do you use a specific application for this, or did you built your custom trading bot ? Thanks!
-
 InvestorJourneyX joined the community
 -
 Los Angeles County Inmate changed their profile photo
 -
Los Angeles County Inmate joined the community
-
Those returns are even more remarkable when you consider position sizing. The SV portfolio is $10,000. Full position is around $7k. Which means that we never ever risk more than 70% of the capital. But we typically start with half position which is $3.5k, sometimes add another quarter, and rarely go to full position. This means that the model portfolio produced 20.4% while usually risking only 40-50% of the capital. And it's properly hedged against black swan event. A remarkable achievement, considering how low maintenance and scalable the strategy is.
-
Thank you for the steady hands in the trade management