All Activity
- Past hour
-
 @Romuald The trade here depicts a Jul10/Jull17 752.5 put calendar on SPY. However, only the Jul10 expiration has this strike available - so what strike are you tracking for the Jul17 leg?
 - Today
-
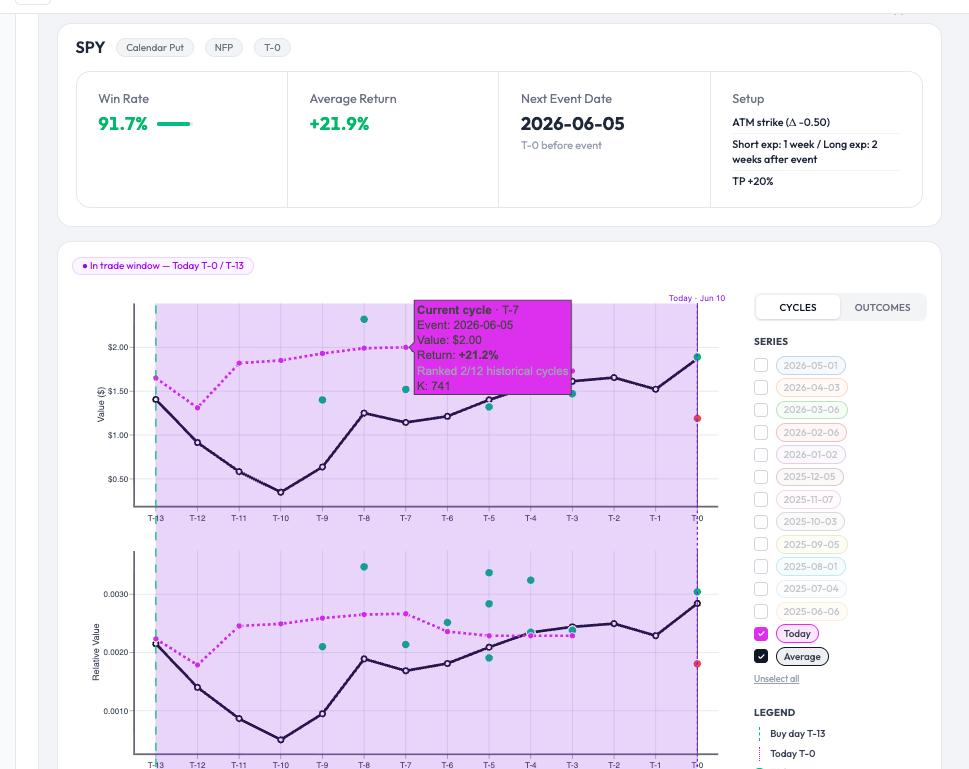
 Follow-up on the SPY calendar put from earlier today — the live mark just crossed the take-profit threshold: Return +37.2% against the +20% TP (Value $1.78, ranked 2/12 historical cycles at this stage). A couple of honest qualifications, because this depends on details: The +37.2% is referenced to the entry price the tool tracks ($1.78 here). Your own return depends on where you actually got filled. Someone who entered yesterday at a lower price would be showing a different number — higher or lower. The TP is always relative to entry, so the percentage isn't universal. A GTC take-profit order at +20% would likely have triggered — but the live valuation here is on delayed data (15-30 min) and based on the mark, not an execution quote. So crossing +20% on the delayed mark strongly suggests an intraday TP touch, without guaranteeing the exact fill price. On a calendar spread specifically, the bid/ask you cross matters. This is still an unrealized mark on an open position. NFP is on 2026-07-03; the event itself hasn't happened. The setup reaching its TP this early in the window is one cycle's path, not a rule. Net: the workflow did what it's meant to — flag the setup, track it live, and surface when it reaches target. Whether your specific entry hit TP is down to your fill. Just wanted to close the loop on the trade I showed live earlier. Past performance does not guarantee future results. OptionBench is not a financial advisor and does not recommend any specific trading strategy. Options trading involves substantial risk and may result in significant losses. This tool is for research and educational purposes only.
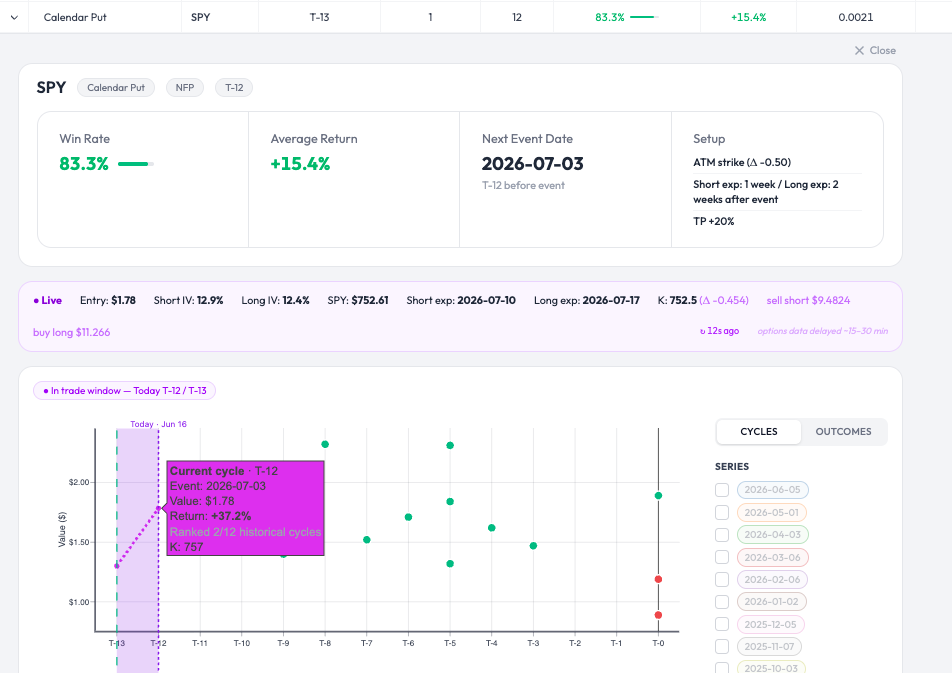
-
Live tracking demo — SPY Calendar Put into NFP (Pre-Events scanner) Quick follow-up to show a feature rather than just a backtest number: the Pre-Events scanner tracks the recommended setup live while it's open, so you can watch the position against its take-profit in real time. The setup (flagged by the scanner) Underlying: SPY Strategy: Calendar Put, ATM (Δ -0.50) Event: NFP, 2026-07-03 Entry: T-12 (entered yesterday, inside the entry window) Structure: short exp 1 week / long exp 2 weeks after the event TP: +20% Historical context: 83.3% win rate, +15.4% average return across prior cycles What the video shows The Live row updates every ~20-30s (options data delayed 15-30 min — flagged in the UI, not hidden). Over the clip, the position's live return on the open trade ticks up from +9.6% to +18.8% as the calendar put gains value, closing in on the +20% TP. Hovering the current-cycle point shows it ranked 3rd of 12 historical cycles at this stage. So this isn't a hypothetical or a static backtest screenshot — it's the actual recommended trade being marked-to-market against its target while it runs. [video: SPY Calendar Put live tracking] A few honest notes The live valuation uses delayed data (15-30 min), so it's a near-real-time mark, not a live execution quote. Your real fill on a calendar spread will differ from the mid-based mark, usually by the bid/ask you cross. +18.8% is the unrealized mark at that moment, not a closed result. The trade hasn't hit TP yet and could still reverse — NFP hasn't even happened. The historical 83.3% / +15.4% figures are the backtest context, not a promise about this specific cycle. The point I wanted to show is the workflow: the scanner flags the setup, you enter in the window, and the tool tracks it to TP instead of leaving you to babysit a spreadsheet. The platform is in beta until August: Beta site (current testers): https://app.optionbench.com/ Launch waitlist: https://www.optionbench.com Happy to answer questions on the methodology or the live-tracking logic — and as always, skeptical feedback on the data assumptions is welcome. Past performance does not guarantee future results. OptionBench is not a financial advisor and does not recommend any specific trading strategy. Options trading involves substantial risk and may result in significant losses. This tool is for research and educational purposes only. SPY-EXAMPLE-CP-PRE-NFP.mp4
-
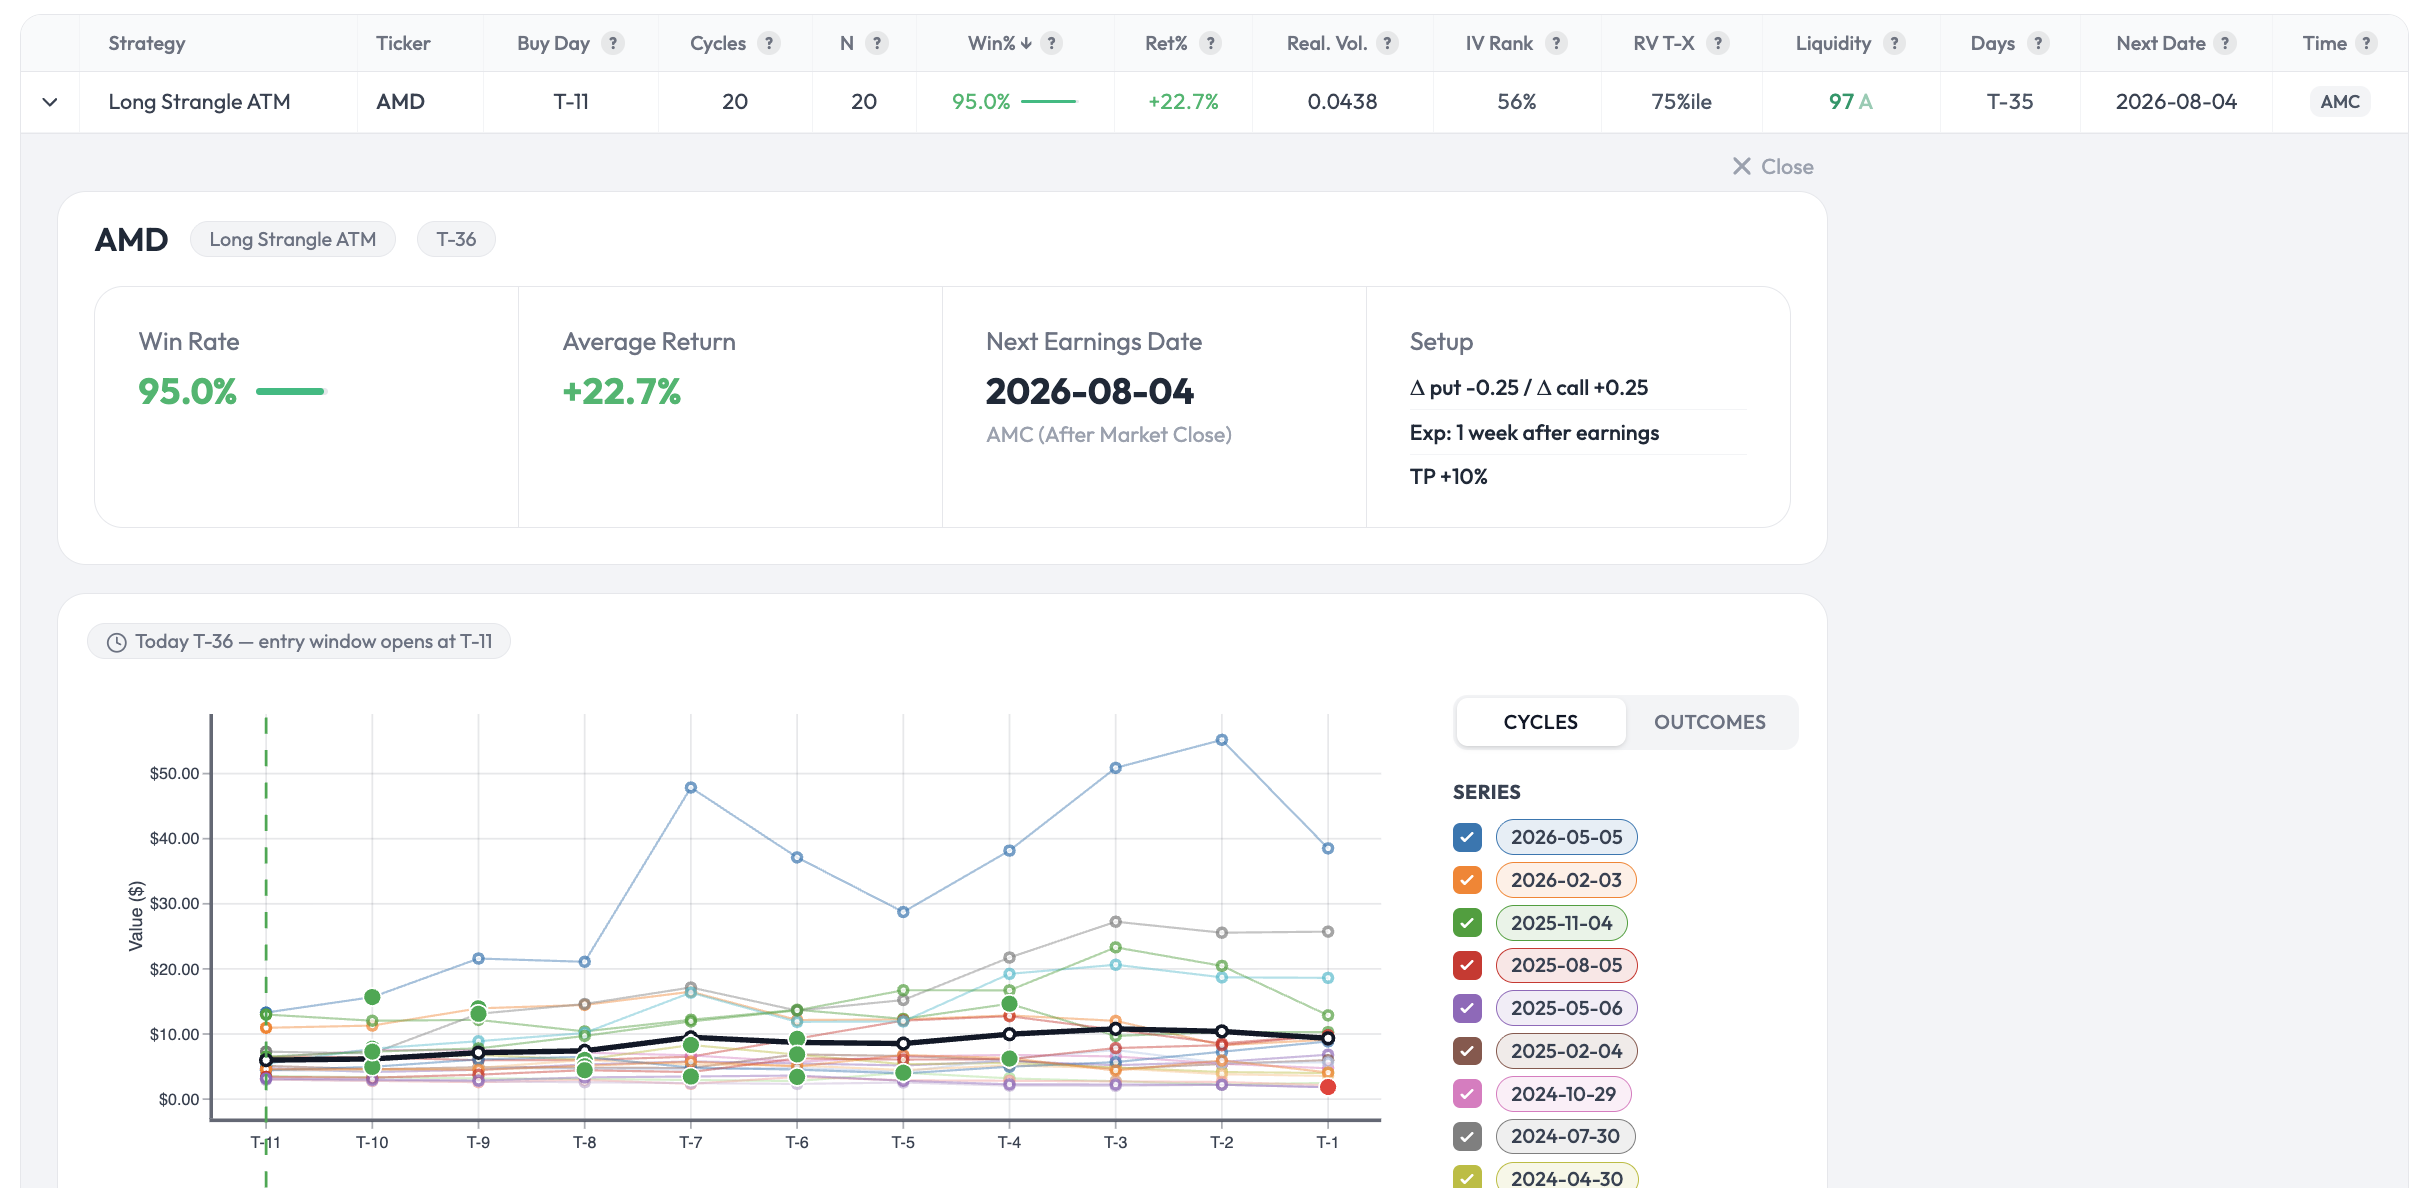
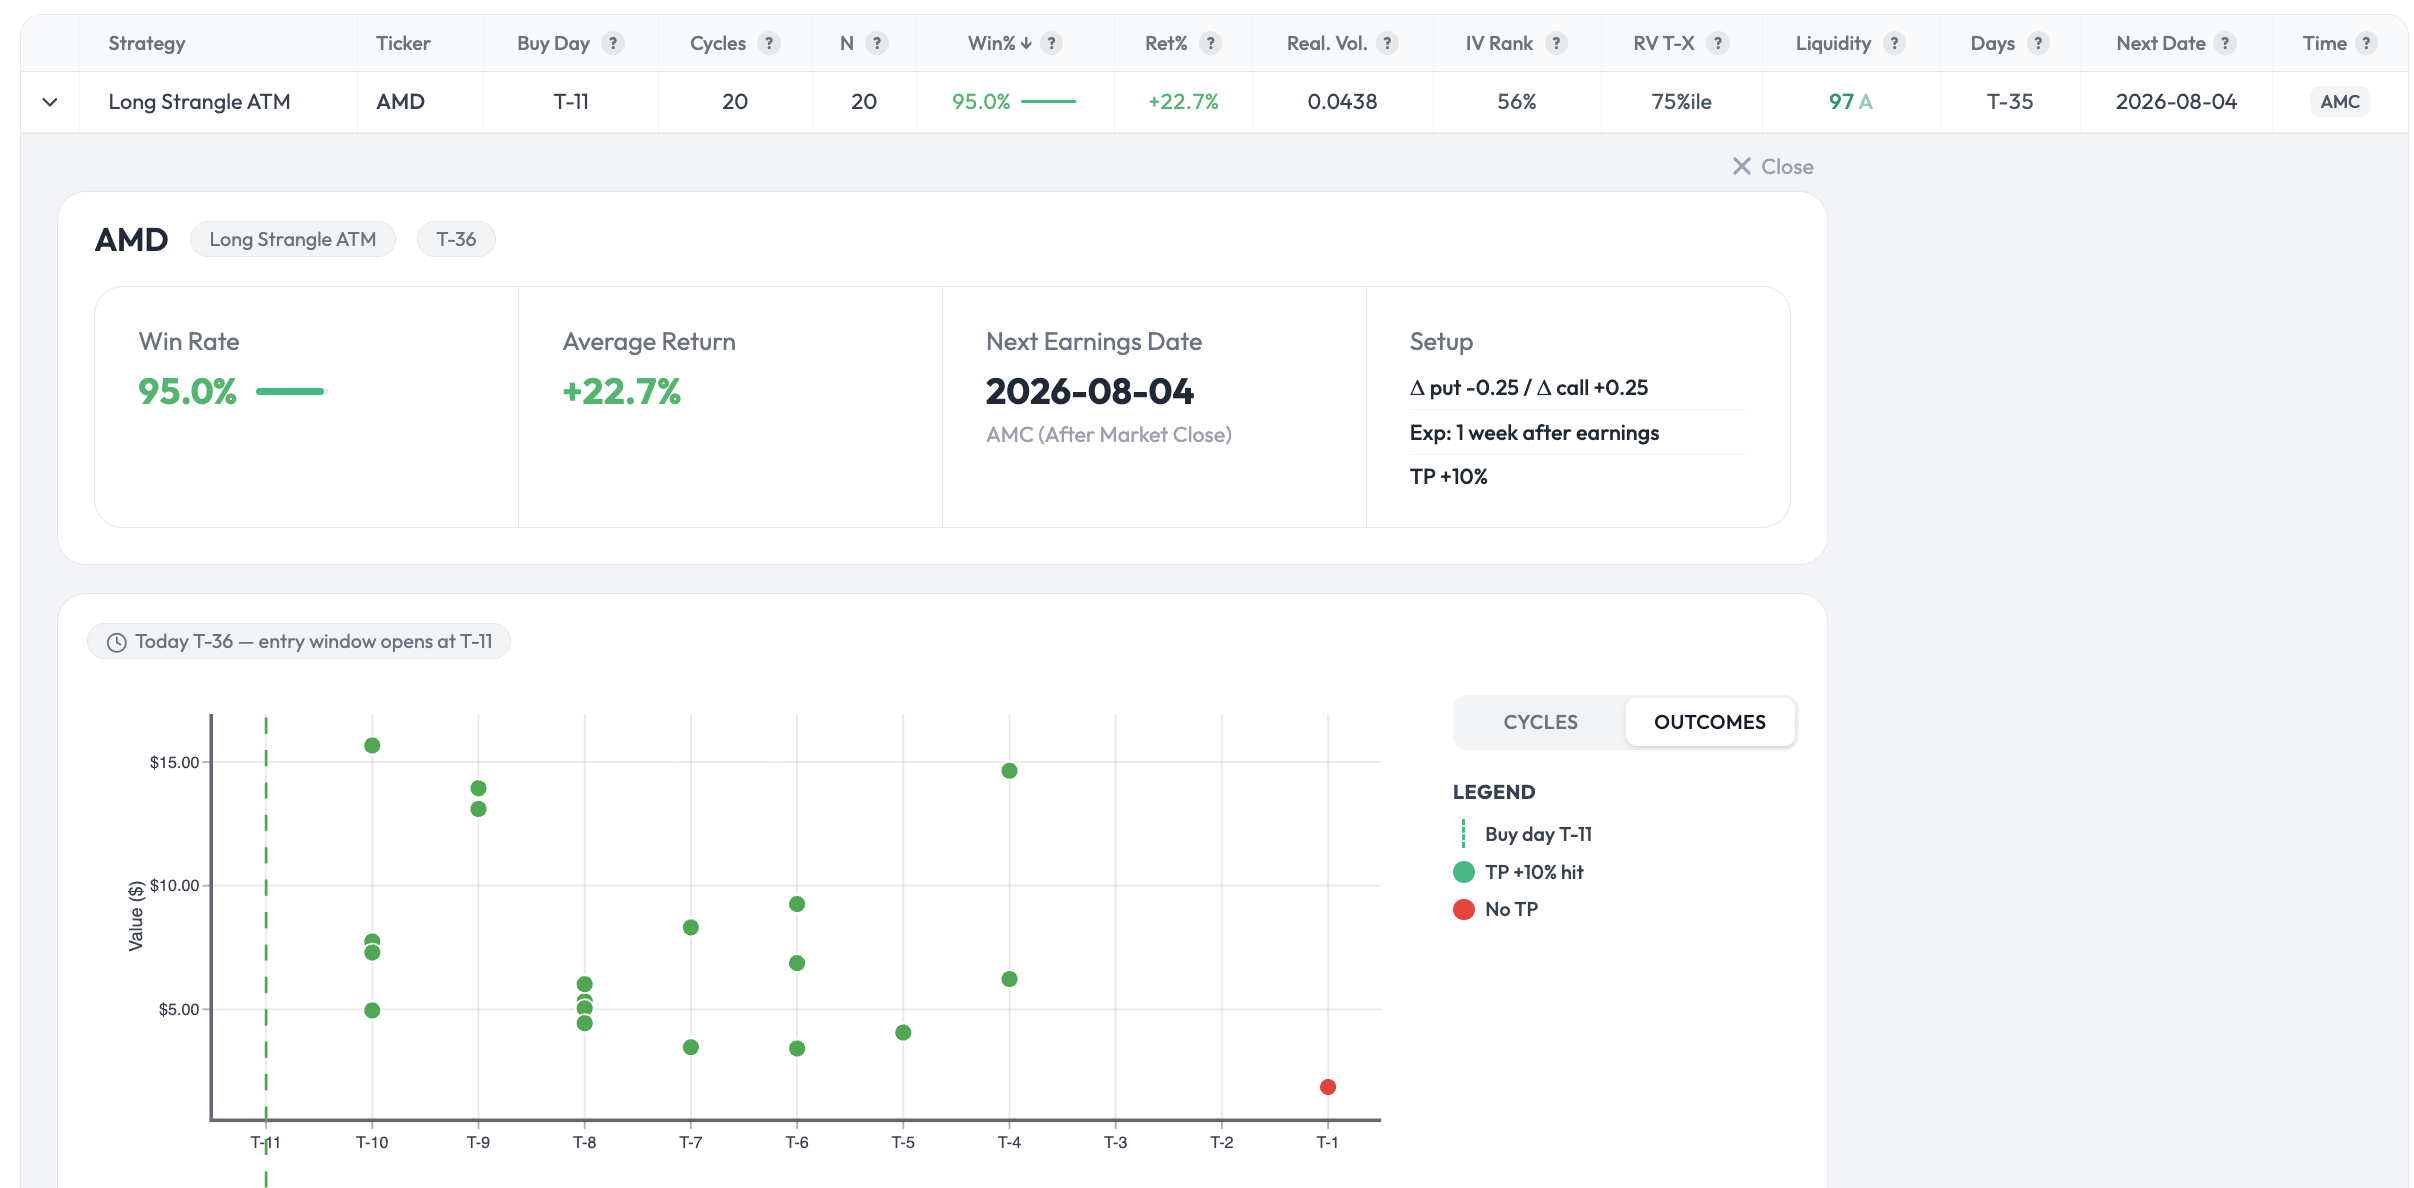
Good question — not obvious at all, and you're thinking about it the right way. Your intuition (fills above the TP) is correct; the mechanism is slightly different from morning gaps though. Two things combine here: 1. The +10% TP is a trigger, not a cap. The backtest checks the position once per day, on the close. So the exit isn't "sell exactly at +10%" — it's "the first day the position closes at or above +10%, exit at that day's actual value." On a long strangle during a post-earnings move, the position is convex: when the underlying moves hard, the value doesn't stop politely at +10%. By the time a daily close crosses the threshold, it's frequently already at +20%, +30%, or more. So most winning cycles exit well above the nominal TP. You can see this directly in the Outcomes screenshot — the green dots (TP hit) are scattered across a wide range of values, not clustered at a single +10% line. Each dot is the real value captured that day, not the threshold. 2. The average blends those winners with the one loss. 19 of 20 cycles hit the TP (most above +10% for the reason above), one didn't. Average those real outcomes together — losing trade included — and you land around +22.7%. The winners running past +10% is what pulls the mean well above the trigger level. So it's not primarily about morning gaps (though intraday a gap can absolutely overshoot even further — the daily-close method doesn't capture that, which makes the backtest conservative on that specific point). It's mostly the daily-check granularity plus strangle convexity letting winners run past the trigger before the exit registers. One honest caveat in the other direction: because the check is daily-close only, the backtest can also miss an intraday TP touch that reverses by the close — so the method isn't uniformly favorable. It's just a consistent, simple rule applied identically across all 20 cycles. Happy to go deeper on any of this if useful.
- Yesterday
-
 Apologies if I am asking about something super obvious, but how is it possible to get an average return of about 22.7% if the TP is set at 10%? Is it because many days option prices will simply gap up in the morning and you get higher than the TP fill?
 -
AMD pre-earnings Long Strangle — WinRate 95% 20-cycle backtest data (earnings 2026-08-04) Sharing a specific data point from the OptionBench Pre-Earnings scanner ahead of the upcoming AMD earnings on August 4, 2026 (AMC). Setup tested Strategy: Long Strangle ATM Buy day: T-11 (entry window opens July 20) Strikes: Δ put -0.25 / Δ call +0.25 Expiration: 1 week after earnings Take-profit: +10% Backtest result over the last 20 earnings cycles Win rate: 95% (19 / 20) Average return including losing trades: +22.7% Liquidity grade: 97 (A) — fills should not be the constraint The first screenshot shows the per-cycle value curves from T-11 to T-1. The black line is the average across cycles; green dots mark cycles that hit TP +10%, the single red dot the one that didn't. The second screenshot is the Outcomes view, which strips the cycle curves out and just plots when each historical TP was hit — useful to see the time-to-TP distribution. What this is and isn't This is a statistical observation across 20 historical earnings cycles on AMD with that exact setup. It is not a prediction for the August 4 trade, and I'm not a financial advisor. A 95% historical win rate does not mean the next trade is a winner — it means that if the underlying behavioral pattern continues to hold, the setup has had favorable historical expectancy. The pattern can break at any cycle, and earnings outcomes are path-dependent on factors (guidance surprises, macro tape, IV crush dynamics) that no backtest can fully encode. That said — a documented pattern across 20 real cycles is more useful than vague intuition. Two caveats worth flagging explicitly: 20 cycles is a meaningful but not large sample. Confidence in the 95% point estimate is bounded accordingly. The backtest uses synthetic (Black-Scholes) option pricing. Actual fills on real spreads will diverge from the modeled P&L — typically lower realised return than the +22.7% figure suggests. Where this comes from This is one row in the Pre-Earnings scanner on OptionBench. The platform is in beta until August: Beta site (current beta-testers): https://app.optionbench.com/ Public launch site (waitlist for August launch): https://www.optionbench.com If you'd like to join the launch waitlist, the form is on the homepage. Happy to discuss the methodology in this thread or by PM — especially if you're skeptical about the backtest assumptions, that's exactly the kind of feedback I want to hear before the public launch. Past performance does not guarantee future results. OptionBench is not a financial advisor and does not recommend any specific trading strategy. Options trading involves substantial risk and may result in significant losses. This tool is for research and educational purposes only.


-
 adi d joined the community
 - Last week
-
Hello does anyone use robinhood for steadyoptions service trades? how has the experience been? thanks
-
Does anyone use Robinhood for steadyoptions? thanks
-
 melhamy8 joined the community
 -
 sheeraznabi joined the community
 -
 P-Rao joined the community
 -
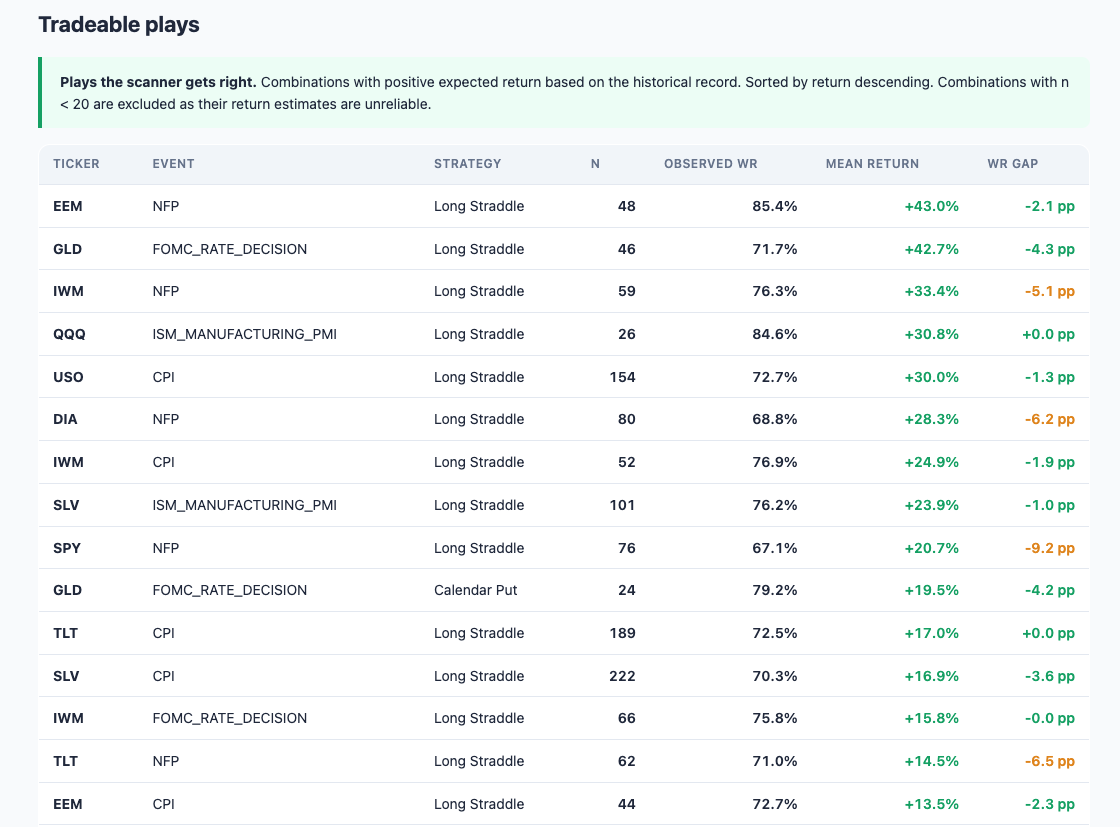
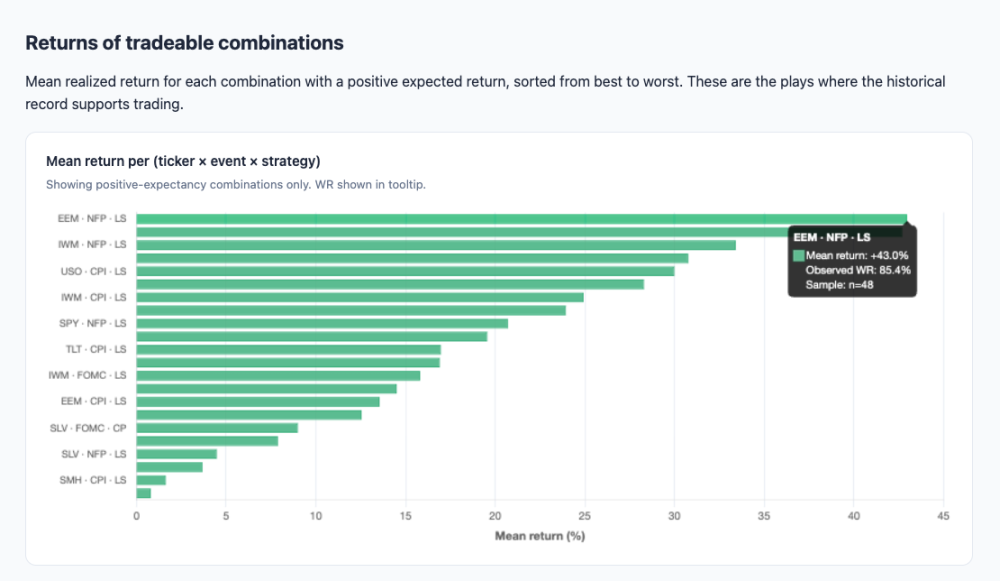
I have made some backtests on my tool "Pre-Events Scanner on ETF" from my website OptionBench. Here are some results : Opening a Long Straddle on EEM pre-NFP has worked 85.4% of the time and goe a +43.0% return. And here are some interesting tradeable plays :

-
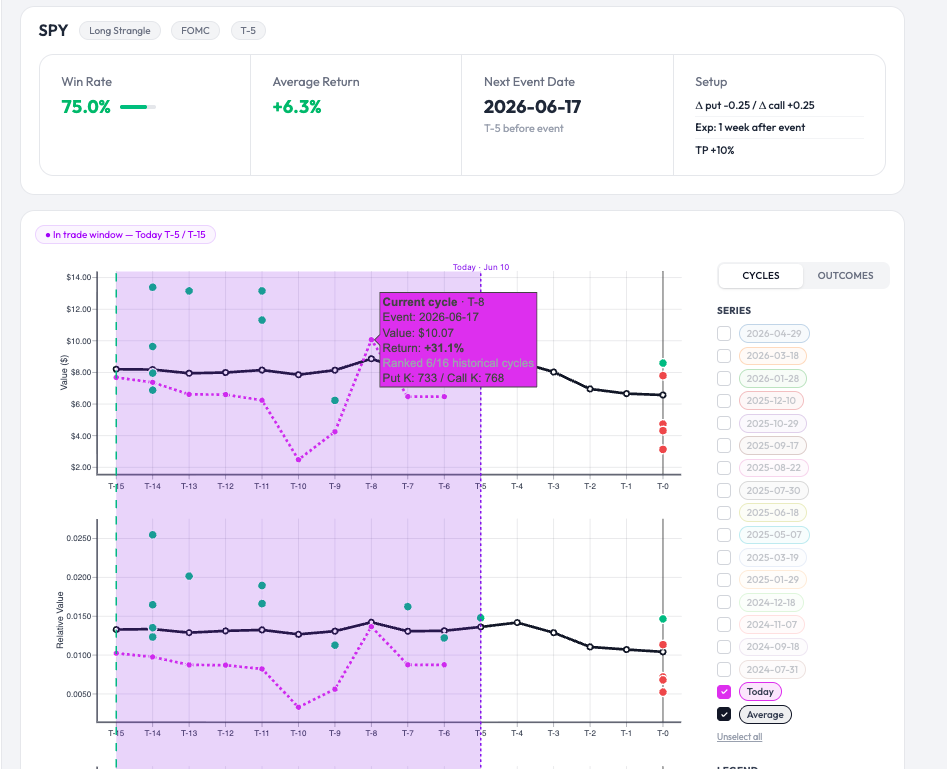
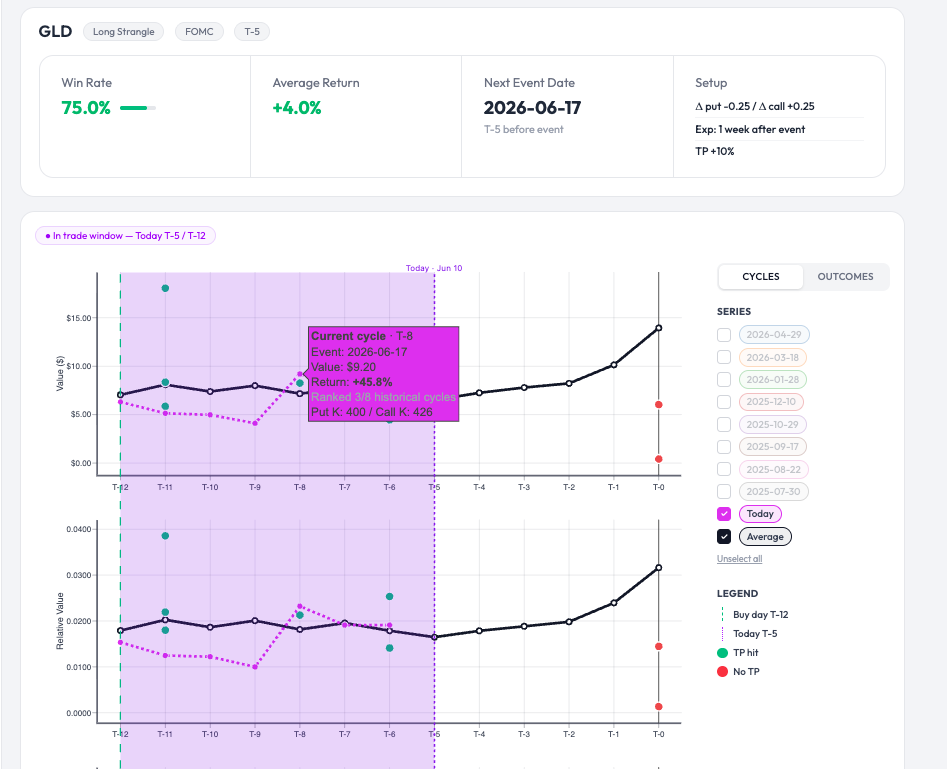
Here is an example of a presentation on Option Bench showing the evolution of the value and the relative value of a Long Strangle on SPY (fuchsia line) taken on T-15 before the FOMC. A return of +31.1% was achieved on T-8. The green dots represent winning trades over the last 16 cycles, the red dots represent losing trades, and the black line is the average curve. An another one on GLD : Or this other one : Calendar Put T-13 before NFP :
-
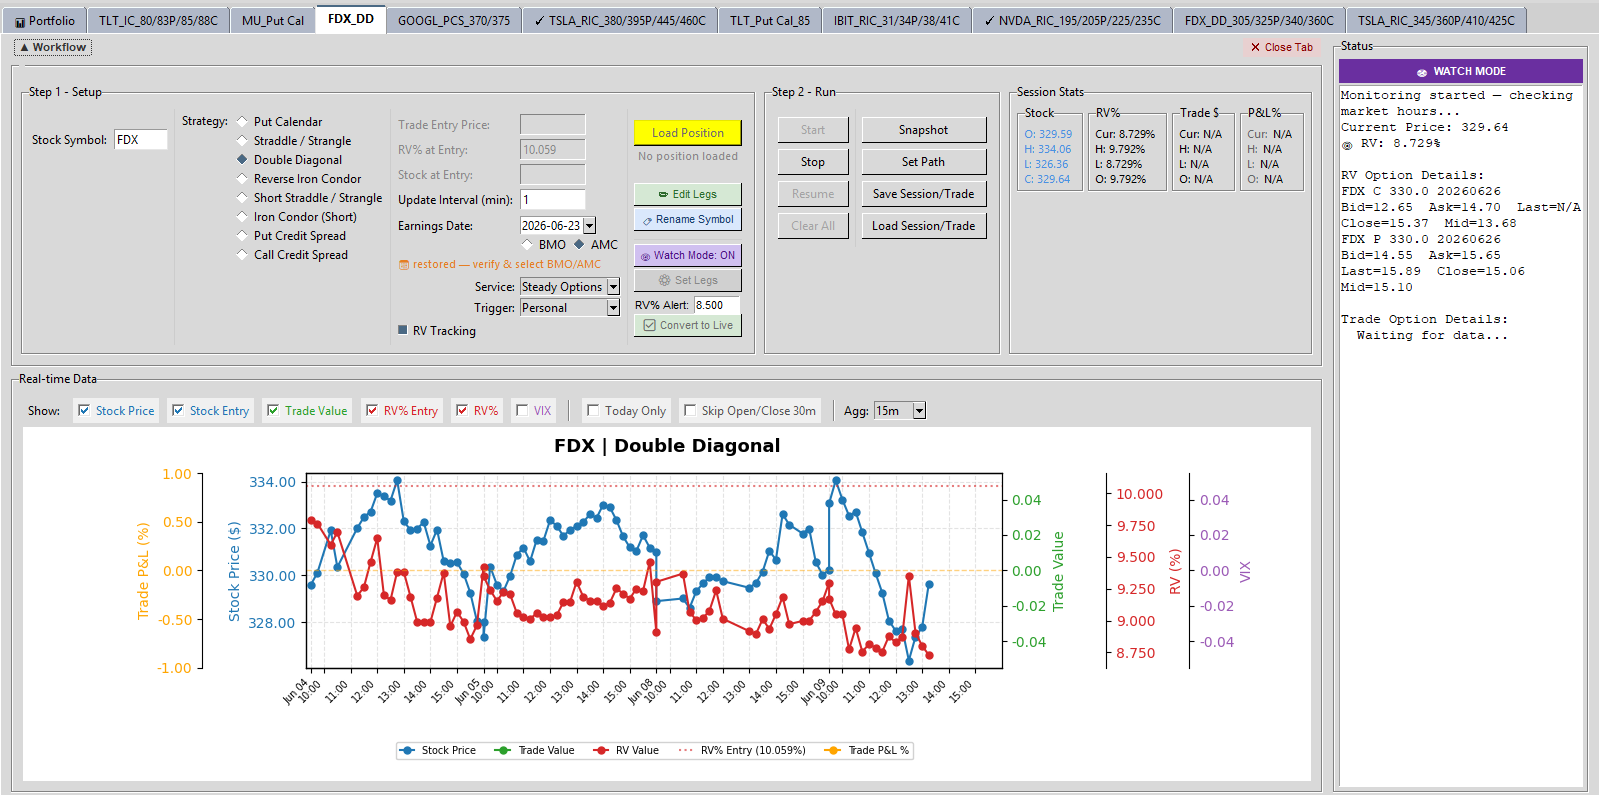
@krisbee thanks for that note ... I have been able to track it with the code @Bhavan1986 and I worked on and went with a DD when RV% went below 9 this morning

- Earlier
-
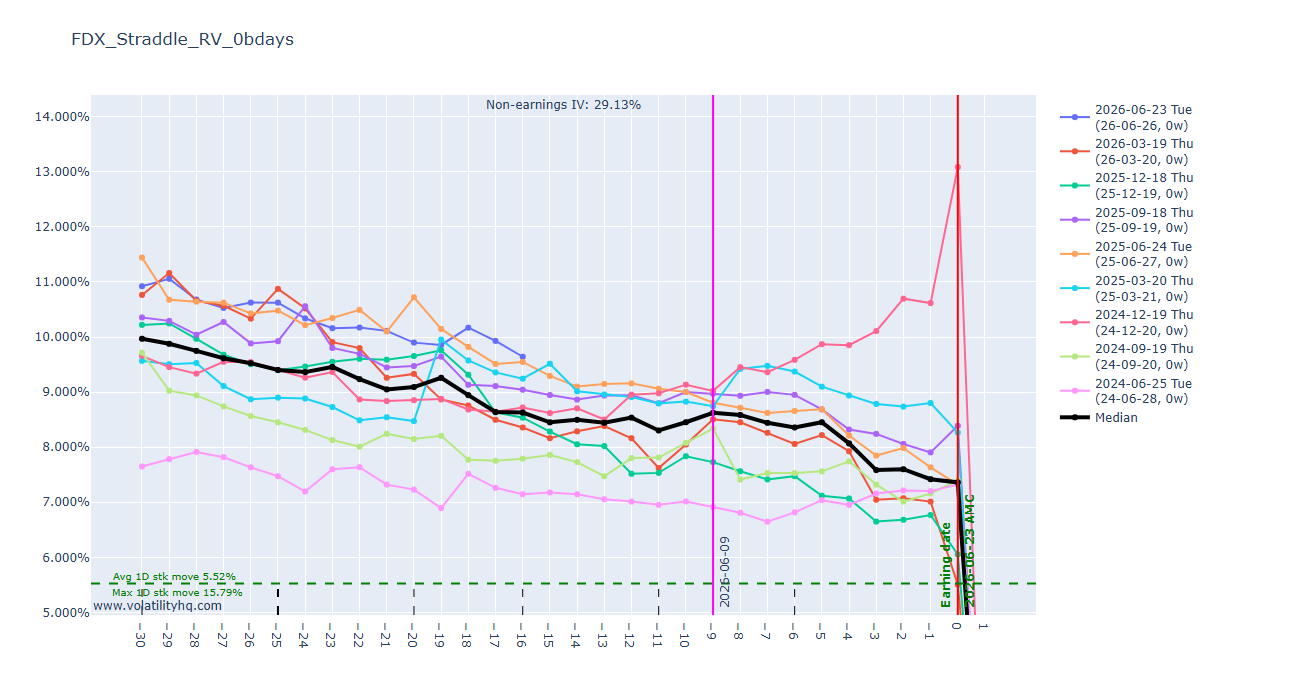
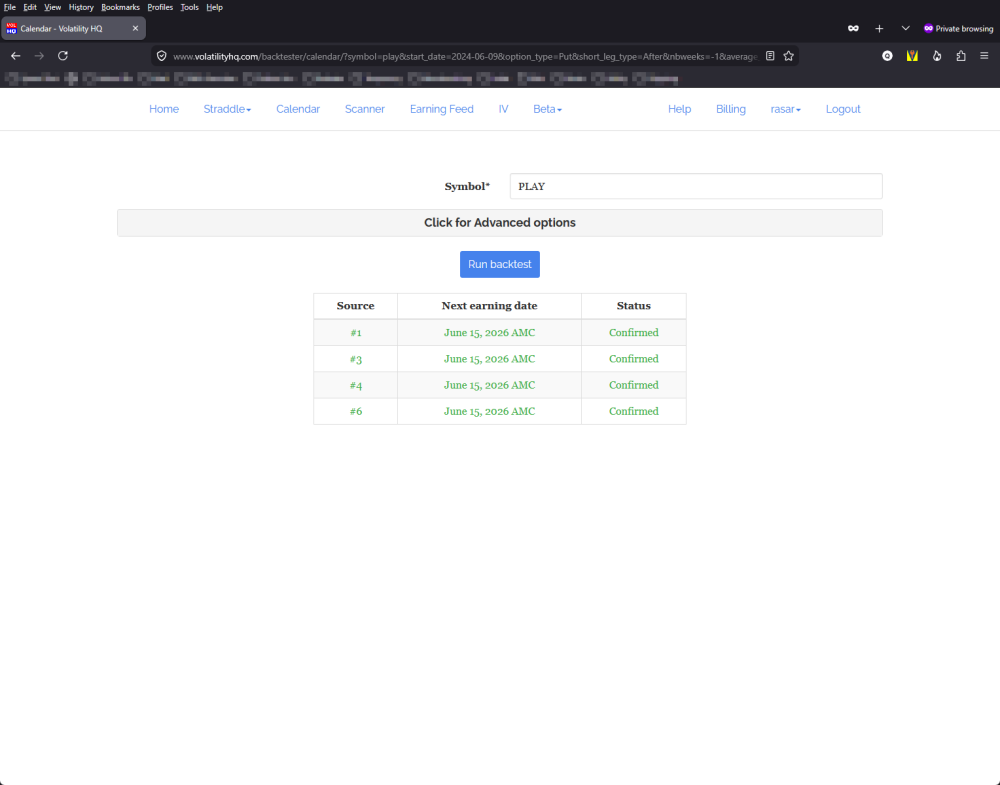
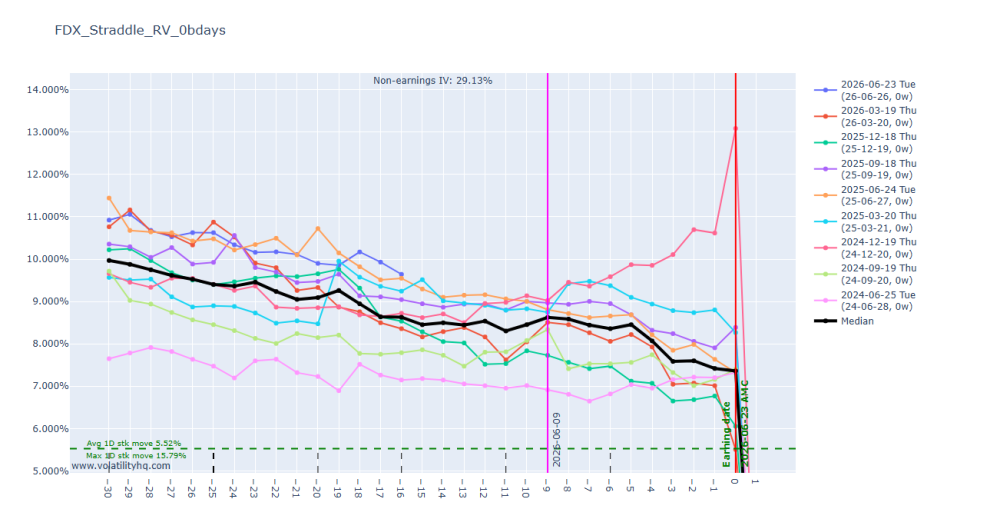
FDX is because they split the company to FDXF and stopped options data for FDX (atleast for now).
- 1137 replies
-
- 1
-

-
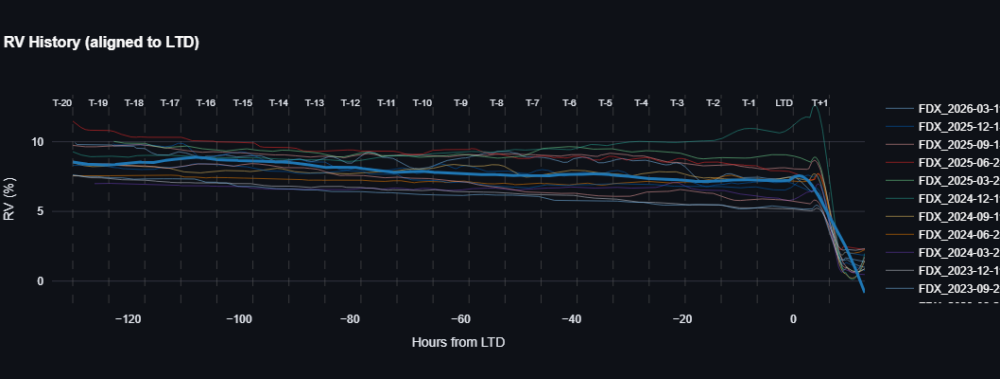
- rv chart
- volatilityhq.com
- (and 1 more)
-
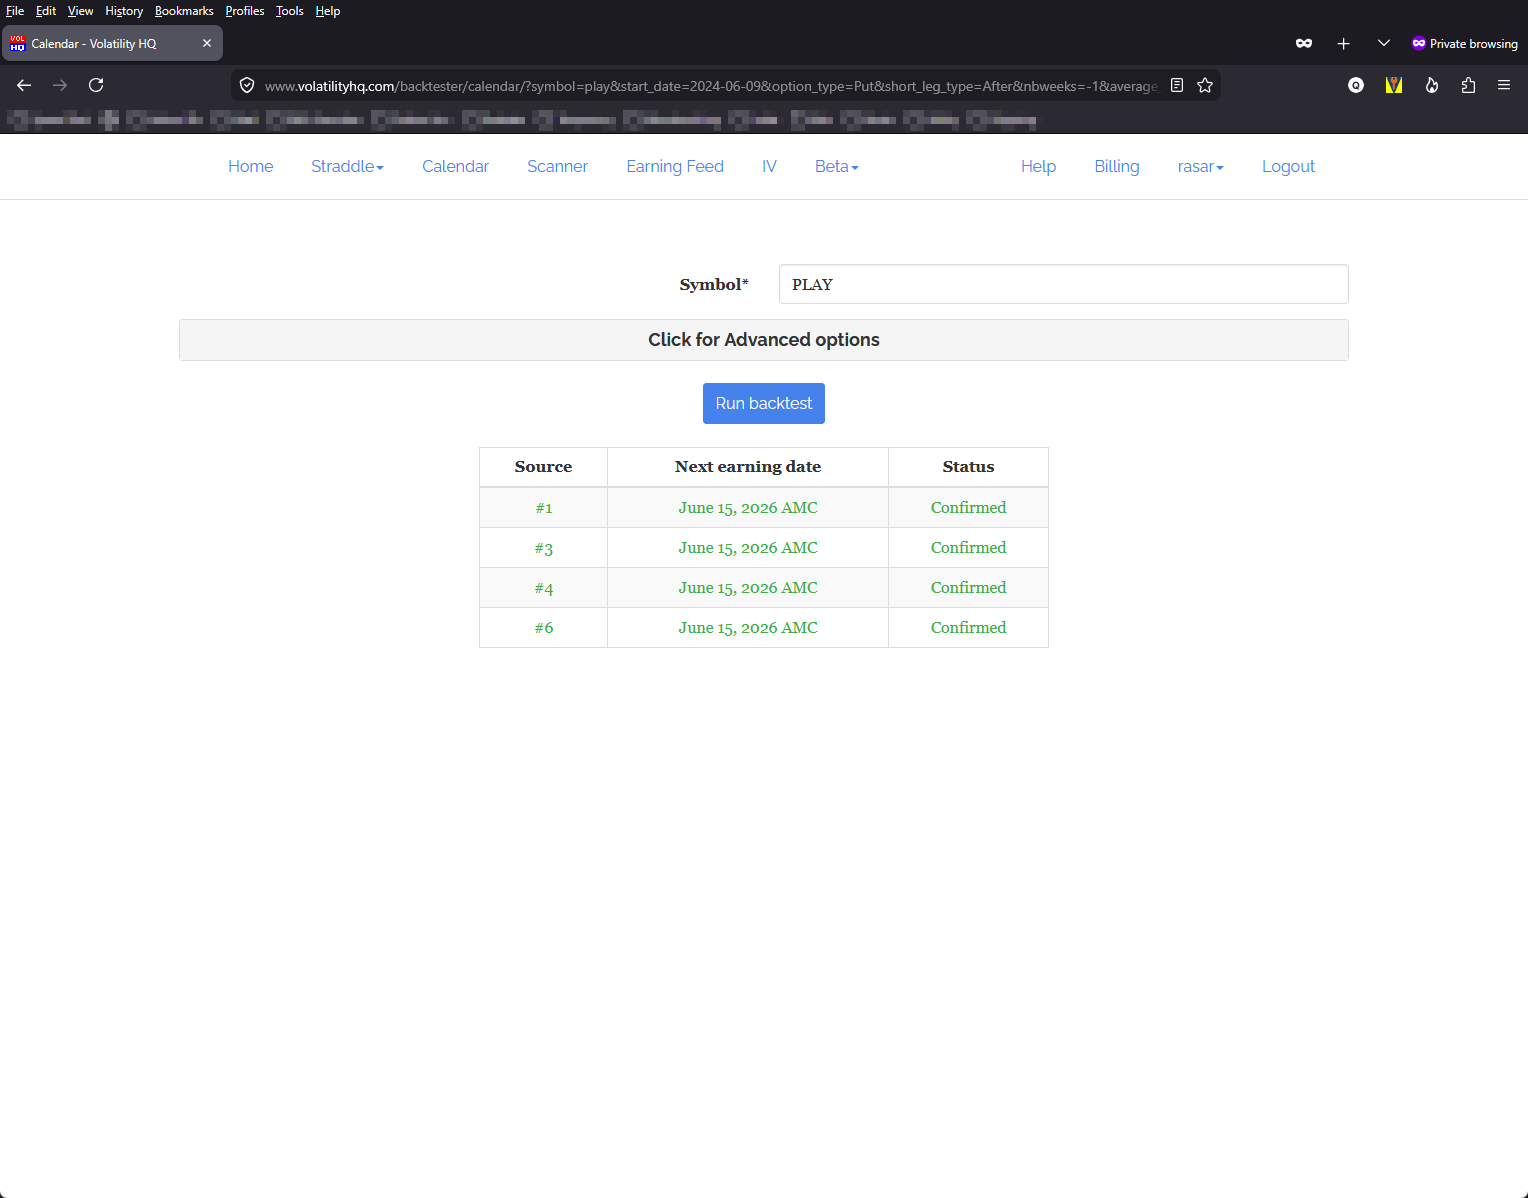
Seems to be across the board. I tried TSLA, PLAY and FDX, both Straddles and Calendars. I also tried it on MS Edge with the same result.
-
Maybe this chart will help
- 1137 replies
-
- 1
-
-
- rv chart
- volatilityhq.com
- (and 1 more)
-
It seems only FDX has stale data for some reason. I see the same chart as @Canuck_Dave. @rasar is it just for FDX that you have a blank screen ?
-
At least you got a chart. Mine doesn't plot anything - just a blank screen. The Tables work fine, just not the charts. I wonder if you're getting the cached version. @Djtux - Looks like you may have a problem with plot.ly... I think.
-
@Djtux something off witht the FDX straddle chart hasn't plotted a value for past several day
-
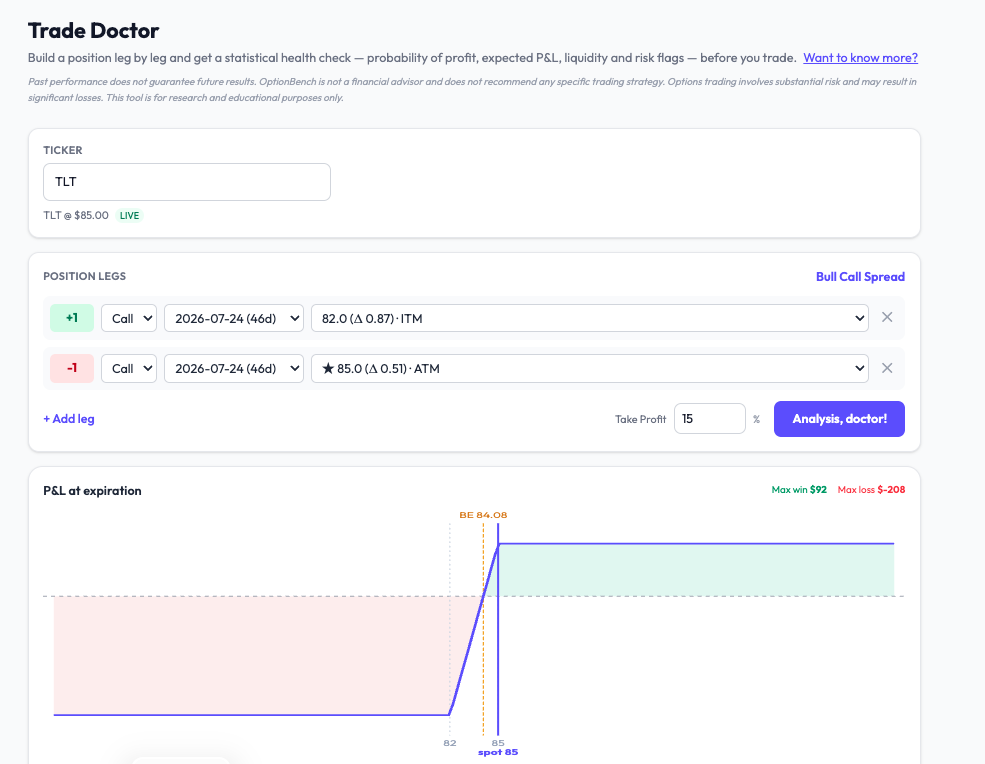
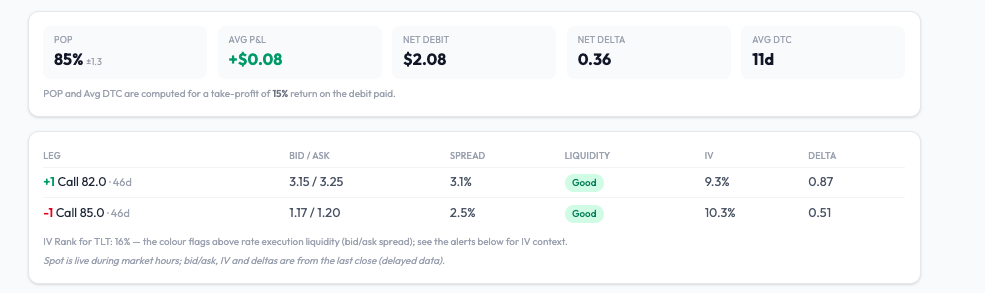
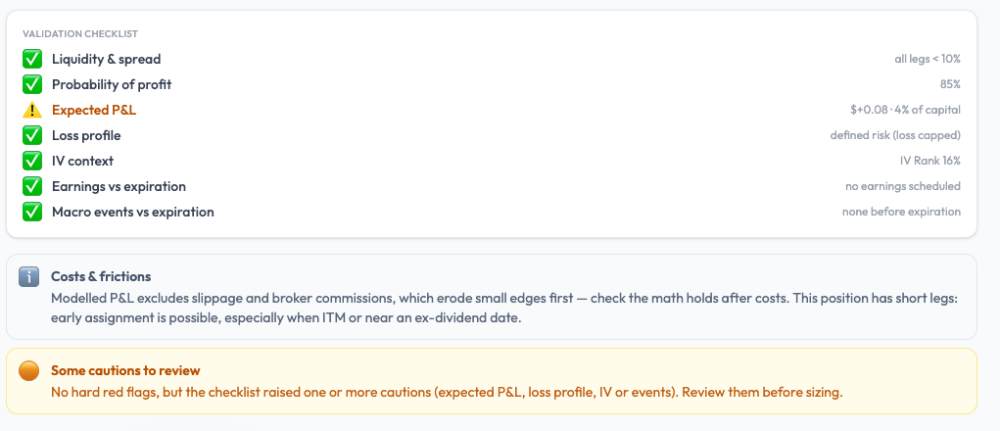
An 85% win rate. Would you take this trade? Here's a setup that came up on TLT this week — the kind that looks like the sensible, high-probability play. A bull call spread, built defensively: buy the 82 call (deep in the money, delta 0.87), sell the 85 call (at the money, delta 0.51), 46 days out. Spot is sitting right at $85, your breakeven is down at $84.08, so you're already through breakeven before the trade does anything. This image is from the Trade Doctor of my upcoming website https://optionbench.com/ After clicking on "Analysis, doctor!", here are the resuts (a few seconds later): The simulation gives it an 85% probability of profit. Eighty-five percent. Deep in the money. Breakeven already behind you. Would you take it? I almost did. Then I ran it through the diagnostic I've been building, and it asked three questions the win rate doesn't. Question 1 — What's the payoff? The spread costs $2.08. Its maximum win is $92. Its maximum loss is $208. Read that again. You're risking $208 to make, at best, $92 — you can lose more than twice what you can win. And it gets tighter, because the plan is to take profit at +15%, which on a $2.08 debit is about $31. So the reward you're actually reaching for is roughly $31, against $208 at risk. That's the deal hiding behind "85%": win small, win often, and when you lose, lose several times the size of a win. Question 2 — What's the expectancy? Run the Monte Carlo and the average P&L comes out at +$0.08 per share — about 4% of the capital at risk, over an average holding period of eleven days. It's positive, which matters. But it's thin. You're committing $208 of capital to harvest a few dollars of edge, and the 85% win rate is most of what makes the trade feel like more than that. Question 3 — Is this even a good version of this trade? This is the one that got me. I ran a few neighbouring strikes on the same underlying, same expiration. Some of them carried a similar 85%-plus win rate with two to three times the expected value. Same probability of profit on the surface. A completely different edge underneath. If you sort your ideas by win rate, these trades look interchangeable. They aren't. The number that ranks them — expected value relative to capital — is the one that never makes it onto the headline. The point To be clear: this isn't a blow-up trade. It's defined risk — the loss is capped at the debit, and the tool says so. The danger here isn't ruin. It's quieter than that: a high win rate, a tiny payoff, and a thin edge you can't see if "85%" is the only number you look at. Win rate is the most seductive statistic in options and the least informative on its own. It tells you how often you'll be right. It says nothing about how much you make when you are, how much you lose when you're not, or whether the trade two strikes over is quietly three times better. How many "high-probability" trades have you taken that looked exactly like this one? To help you, the Trade Doctor shows up a validation checklist and some advice: Where this comes from This is Trade Doctor, one of the tools at OptionBench. You build a position leg by leg and it runs a statistical health check before you trade — probability of profit, yes, but also the expected P&L relative to the capital you're risking, the loss profile, liquidity, implied-vol context and event risk. Probability is one line on the checklist. This shows you the rest of it. OptionBench is entering beta. Beta testers get free access to every tool — Trade Doctor, the BOSS strategy scanner, and the rest — for June and July. If you've already signed up to test, you'll receive an email shortly inviting you to log in. We've had a great response and the beta list is well filled, but if a few more of you would like to put the tools through their paces, send me a DM and I'll get you in. — Romuald Figures are from a live TLT options chain (TLT @ $85.00) and are for research and educational purposes only. OptionBench is not a financial advisor and does not recommend any strategy. Options trading involves substantial risk and may result in significant losses.
-
 Jgodni joined the community
 -

Could This Strategy Be The Holy Grail Of Investing?
DataDan commented on Kim's article in SteadyOptions Trading Blog
I see it has to do with Anchor Trading. I looked at this and remember you need a pretty good size portfolio. I would never criticize what the team is doing here and that's what I think happened. They are pretty experienced. Here's one Anchor statement about portfolio size to keep in mind. What is the minimum account size for this strategy? Our model portfolio is $100,000. The trade alerts will be posted with regular SPY options. To implement the strategy, exactly as presented in the weekly trades, the minimum size account recommended is $50,000 (this is a total account size including all components). -
Could This Strategy Be The Holy Grail Of Investing?
DataDan commented on Kim's article in SteadyOptions Trading Blog
Not much talk today but I got to tell you this Holy Grail conversation completely confused me. I only skimmed it but didn't who was saying what. I have enough trouble keeping up with just with the normal SO Trades. -
@Hany Curious to know if you have noticed any degradation in your fills?
-
 Sujatha joined the community
 -

Could This Strategy Be The Holy Grail Of Investing?
Kim commented on Kim's article in SteadyOptions Trading Blog
No idea. And I'm not sure how VIX buying method is related to Anchor lol.. but some people just like to troll. -

Could This Strategy Be The Holy Grail Of Investing?
TrustyJules commented on Kim's article in SteadyOptions Trading Blog
So where is that VIX Call buying method? /s -
Could This Strategy Be The Holy Grail Of Investing?
Kim commented on Kim's article in SteadyOptions Trading Blog
And here is a comment from someone I highly respect, a long time SA contributor who actually knows what he is talking about.
-
Could This Strategy Be The Holy Grail Of Investing?
Kim commented on Kim's article in SteadyOptions Trading Blog
I went back and read some of the comments. All skeptics and naysayers were proven wrong, once again. Anchor strategy keeps crashing the S&P year after year.