SteadyOptions is an options trading forum where you can find solutions from top options traders. Join Us!
We’ve all been there… researching options strategies and unable to find the answers we’re looking for. SteadyOptions has your solution.
All Activity
- Past hour
-
Please be advised that Simple Spreads subscription rates will be adjusted on October 15 as following: Monthly - $150 Quarterly - $375 (save 17%) Yearly - $1,200 (save 33%) Please note that the increase will only apply to new subscribers. Existing subscribers will be grandfathered at the rate that they signed up for originally, as long as they maintain an active subscription. We hold rates for our existing subscribers as a reward to them for their loyalty to us, which we very much appreciate. As long as you join before October 15th, you will continue to pay the current rates. Bundle prices will remain the same for now, but are expected to increase soon. If you wish to join before the price increase, please use one of the links on the Subscription page. Please make sure to read the Frequently Asked Questions to make sure the service is a good fit for you.
- Today
-
Please be advised that Steady Yields subscription rates will be adjusted on October 15 as following: Monthly - $150 Quarterly - $375 (save 17%) Yearly - $1,200 (save 33%) Please note that the increase will only apply to new subscribers. Existing subscribers will be grandfathered at the rate that they signed up for originally, as long as they maintain an active subscription. We hold rates for our existing subscribers as a reward to them for their loyalty to us, which we very much appreciate. As long as you join before October 15th, you will continue to pay the current rates. Bundle prices will remain the same for now, but are expected to increase soon. If you wish to join before the price increase, please use one of the links on the Subscription page. Please make sure to read the Frequently Asked Questions to make sure the service is a good fit for you.
-
Please be advised that Anchor subscription rates will be adjusted on October 15 as following: Monthly - $150 Quarterly - $375 (save 17%) Yearly - $1,200 (save 33%) Please note that the increase will only apply to new subscribers. Existing subscribers will be grandfathered at the rate that they signed up for originally, as long as they maintain an active subscription. We hold rates for our existing subscribers as a reward to them for their loyalty to us, which we very much appreciate. As long as you join before October 15th, you will continue to pay the current rates. Bundle prices will remain the same for now, but are expected to increase soon. If you wish to join before the price increase, please use one of the links on the Subscription page. Please make sure to read the Frequently Asked Questions to make sure the service is a good fit for you.
-
koorosh joined the community
- Yesterday
-
mccoyb53 started following OptionNET Explorer Backtesting
-
I think ONE just uses the spot price of the options at the end of each 5 minute window, I don't think its an average over that timespan. For stocks whose options are less liquid its common to see this type of thing as the width of the bid/ask spreads widen and narrow throughout the day.
-
Makes sense. Does it mean these mid points are within that 5 min window, since we are looking at moment in time?
-
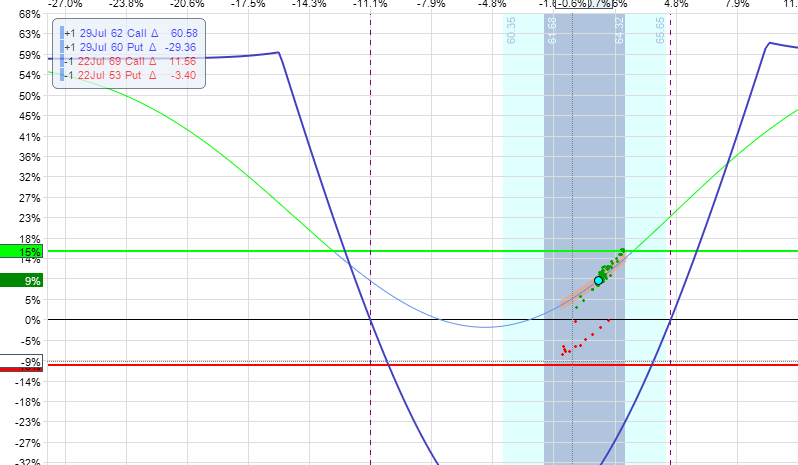
As you probably know, each dot represents the midpoint price of the position at different points in time throughout the day. When you see bigger variations like this with the dots when the stock price stays around the same level its likely that the bid/ask spreads are wider so the midpoint price is jumping around a lot. It can also be a bigger change in RV but that is less likely.
-
@Yowster I was backtesting a DD and am getting these dots (Green and Red) all over the place. What can we possibly conclude from this?
-
richfischer joined the community
- Last week
-
Got it. Thanks!
- 1071 replies
-
- rv chart
- volatilityhq.com
-
(and 1 more)
Tagged with:
-
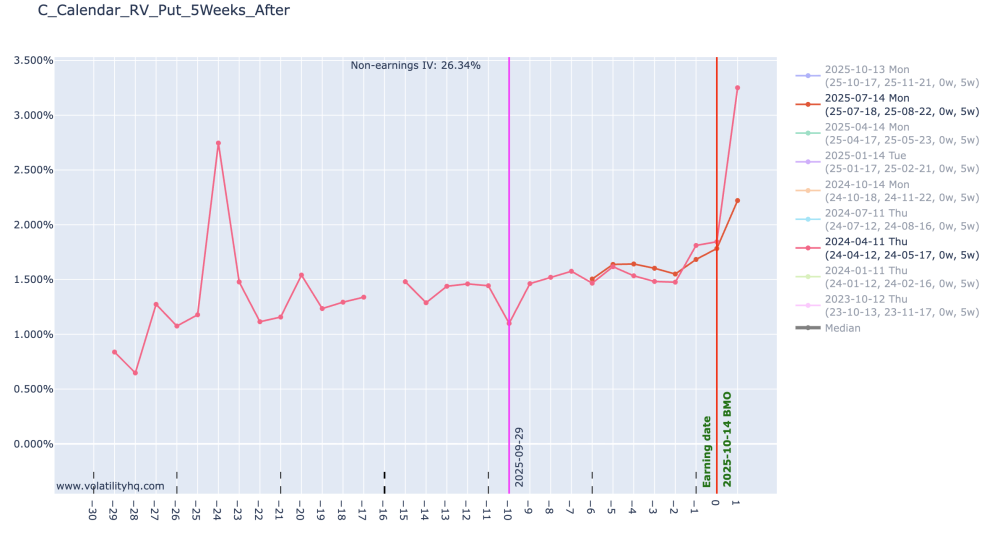
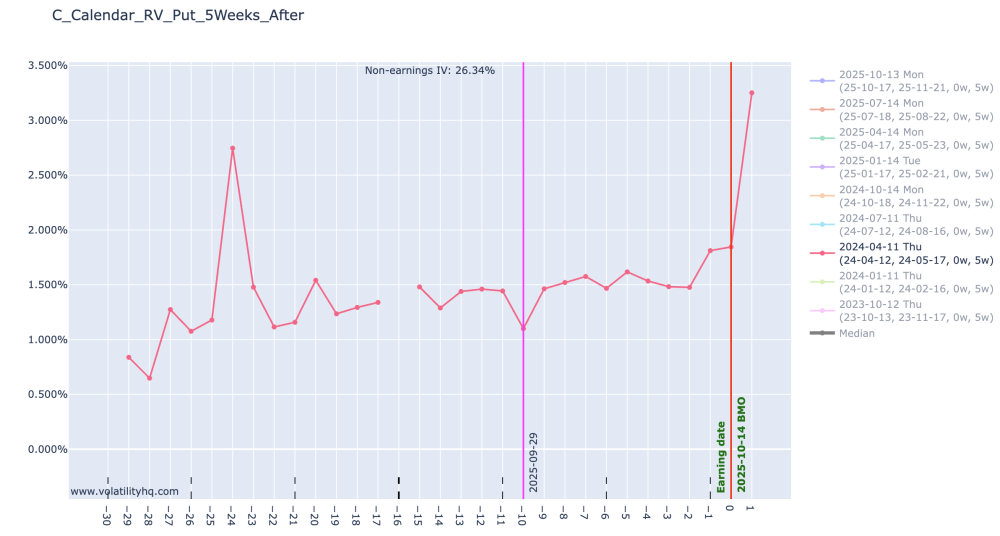
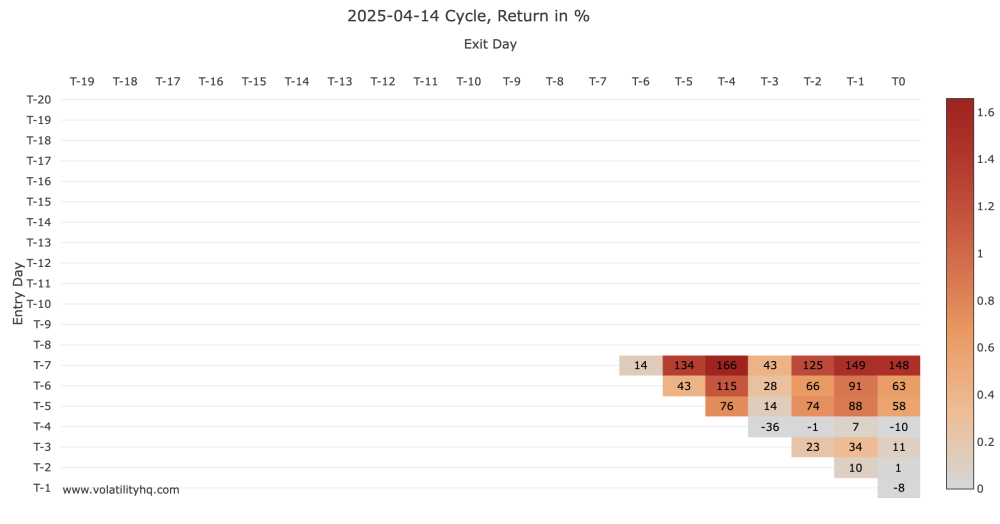
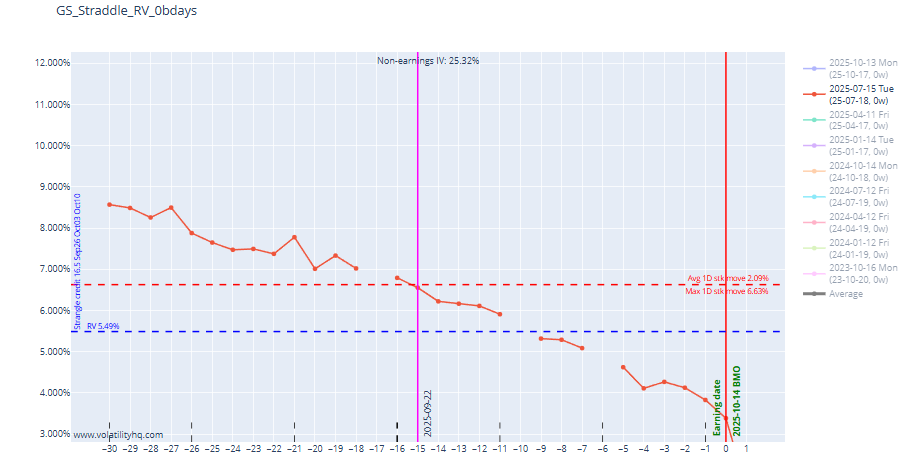
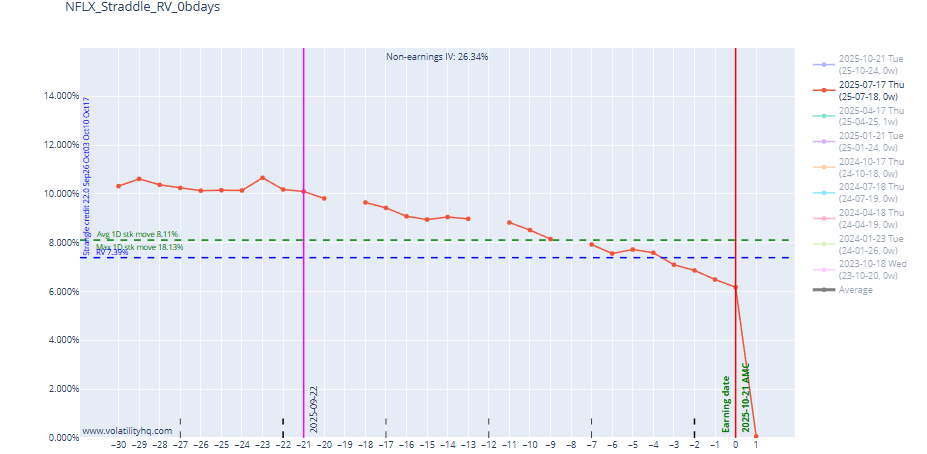
The return matrix cycle is 2025-04-14. Year 2025 and month april. In the RV chart, you display 2024-04-11 (year 2014 and month april) and 2025-07-14 (year 2025 and month july). They are not displaying the same cycle, unless i'm missing something.
- 1071 replies
-
- rv chart
- volatilityhq.com
-
(and 1 more)
Tagged with:
-
vappa joined the community
-
No, I enabled only 2024 earlier. 2024-04-11 line to be specific. Below chart is both 2024 and 2025 (RED COLOR lines)
- 1071 replies
-
- rv chart
- volatilityhq.com
-
(and 1 more)
Tagged with:
-
They are not the same cycle. One is 2024 and the other one is 2025.
- 1071 replies
-
- rv chart
- volatilityhq.com
-
(and 1 more)
Tagged with:
-
For the ticker "C", choose monthly, by default it is 5 weeks, the data for the line for the chose expiration is not available before T-7th day as it shows in the return matrix. How the RV line shows data when it is not available?
- 1071 replies
-
- rv chart
- volatilityhq.com
-
(and 1 more)
Tagged with:
-
jacky00358 joined the community
-
Hello, I'm interested in the Steady Options service. Please, add me to the wait list. Thank you!
-
dariskytrader joined the community
-
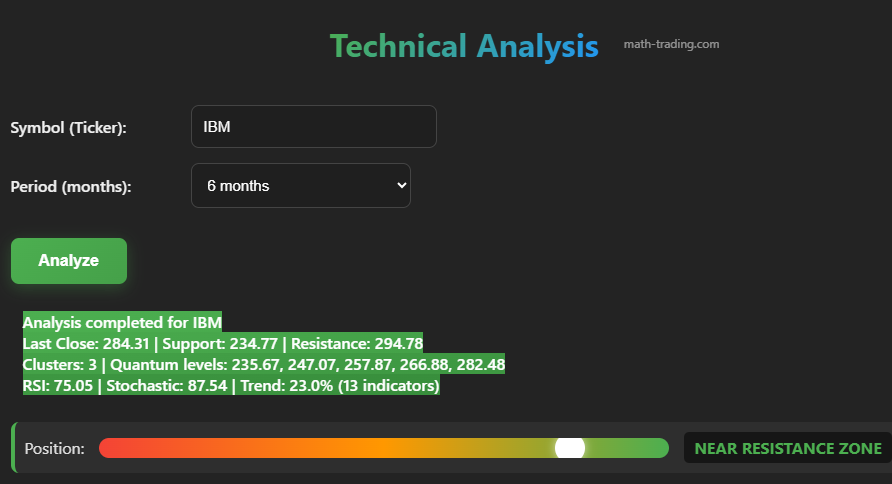
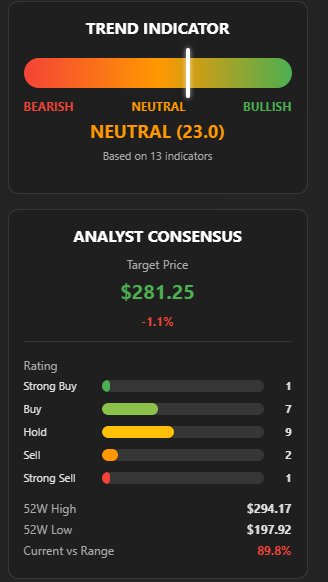
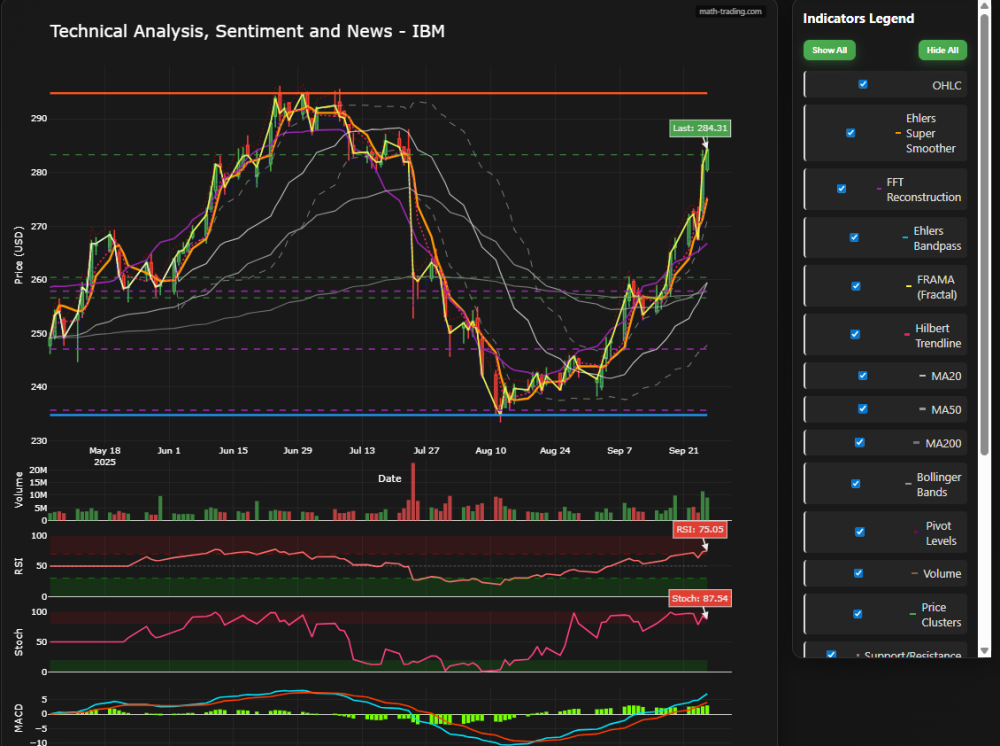
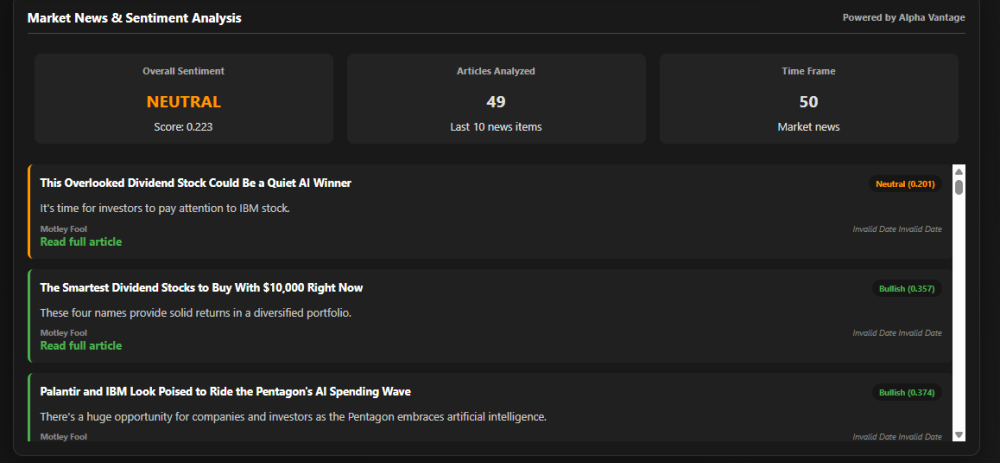
Following numerous requests from subscribers to my site math-trading.com, I have added a technical analysis tool. I am not a big fan of technical indicators because I have never found effective backtests for any of the 100 most common indicators. However, I understand that, outside of any predictive model, they can give an indication of trend, or at least of positioning relative to the history of the ticker in question. So I have synthesized in a tool the indicators for which I have had the least bad backtests. Subscribers can access it via the "Technical Analysis Sentiment and News" button: Here is what it looks like. You enter the ticker and the historical period to be analyzed (up to 6 months of history), then click on the "Analyze" button. The calculations are done very quickly. You immediately have an analysis of the ticker's position in relation to two support and resistance zones which have themselves been calculated based on the indicators. On the right of the chart you have a trend indicator based on 13 indicators and, below, an analyst consensus indicating summaries of what financial analysts think about the evolution of this ticker: strong buy, buy, hold, sell or strong sell, as well as the Highest and Lowest over the last 52 weeks and the ranking of the last close in relation to these points (here 89.8% indicates that IBM is in its "very high" zone compared to the past, therefore overbought) : Then you will find an OHLC chart over the requested period with some interesting indicators. By clicking in the legend you can choose to hide certain indicators, or even all of them. Finally, at the very end, you'll find a summary of all the news and sentiment currently published about the ticker. The algorithm reads all of its articles and establishes an overall sentiment. I hope this new tool meets your various needs. Of course, as promised, the price does not change with the addition of new tools. All subscribers automatically have access to newly released tools. I am currently working on a new tool that will be a database of the history of Long Straddle ATM Pre-earnings for around 100 tickers, a database that I hope to publish by the end of the month. Happy trading!
-
The end of an era... https://www.youtube.com/watch?v=aAN69ARdBo0
-
- 1
-

- Earlier
-
raineorshine changed their profile photo
-
I just got the following message from one of my contacts: https://www.pacermonitor.com/public/case/60218423/Sheridan_Options_Mentoring,_LLC https://businessbankruptcies.com/cases/sheridan-options-mentoring-llc https://www.pacermonitor.com/public/case/60218431/Daniel_Gerard_Sheridan
-
- 1
-

-
I sent you a PM with the coupon code.
-
I'm considering subscribing but I don't see where you have listed the Coupon code for the 15% discount. Have I just missed seeing it somewhere?? Wondering, Glenn
-
Nickel joined the community
-
-
@TradeBobby @Bhavan1986 I think I have found the issue, but it's going to take many hours to reimport and recalculate everything.
- 1071 replies
-
- 2
-

-

-
- rv chart
- volatilityhq.com
-
(and 1 more)
Tagged with:
-
Steady Yields and Steady Options are different portfolios.
-
Why am i getting emails touting this program with a 91% truth? How can it have a 91% return YTD, as per the email I just got, when the model portfolio of $10K shows it is just over $10K with a YTD return of 5%. What am I missing?
-
- 1071 replies
-
- rv chart
- volatilityhq.com
-
(and 1 more)
Tagged with:
-
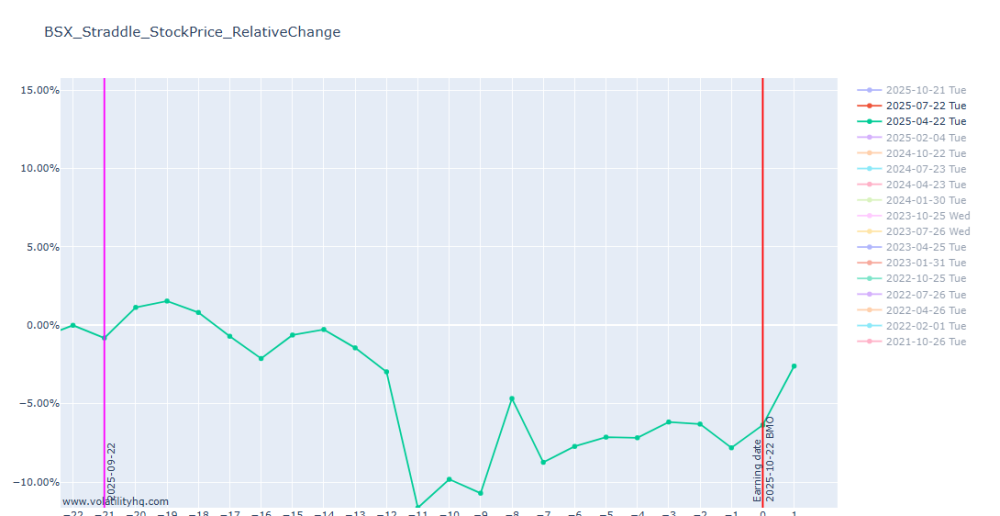
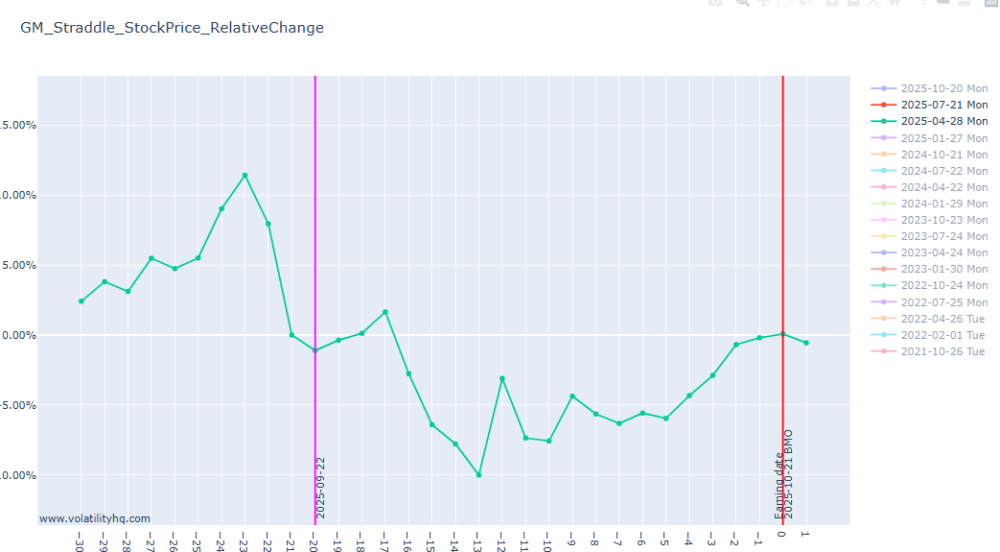
Hi @Djtux I noticed when I'm checking for relative stock movement for Q3 2025 (where earnings has already occurred) the data line is missing. Just wondering if I may be doing something wrong. Thanks!
- 1071 replies
-
- rv chart
- volatilityhq.com
-
(and 1 more)
Tagged with:
-
alison joined the community
-
CCB001 joined the community
-
kevin669 joined the community
-
Yes, most of the time it is possible to enter hours after the trade has been posted, sometimes even the next day. Of course the entry will depend of the underlying price - if the price moved significantly, sometimes the trade price can change as well. But for the most part, those are very slowly moving trades. The implementation is very different from the previous one. Yes, June 2024 performance would be very different from the previous implementation. In fact, it is possible it would actually make money in June 2024.


