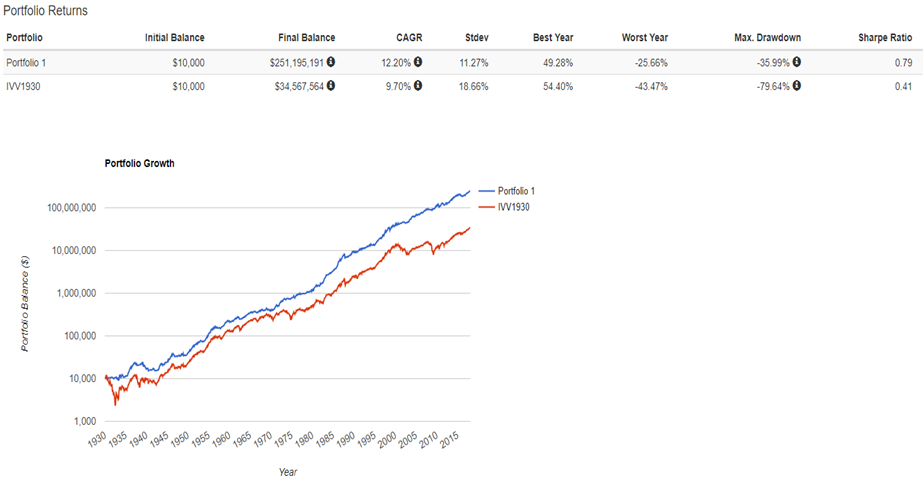
A principle of quantitative investing is that the more data you have, the better. Below is an example of trend following the S&P 500 with a combination of 6 to 12 month absolute momentum since 1930. Individuals interested in recreating this simulation on their own can contact me directly at jblom@lorintine.com. A hypothetical rules-based backtest this long includes the greatest crash we’ve ever seen in US stocks where the S&P declined 80% during the great depression. Some may get distracted by the discussion on how the markets were “different” then vs. now. The objective here is only to see how well a simple model holds up on as much historical data as possible. We’re looking for robustness.
Portfolio 1: Momentum (Either in the S&P 500, bonds, or a combination of both based on absolute or "time series" momentum)
IVV1930: This is a custom built dataset of S&P 500 total returns where index data is used prior to modern day investable products like the iShares ETF, IVV, which are used when they became available.
Click on all images for greater clarity.

Every statistic is improved, except best year, which is expected, because during positive outlier years the best a single asset trend system can really be expected to do is match the buy and hold return. The most notable improvement is the reduction in volatility and drawdown, which is a common trait of simple trend following systems like this. 35% is still a large and very uncomfortable maximum drawdown, which is why diversification is always recommended and how we actually implement these concepts in our firm for our clients.
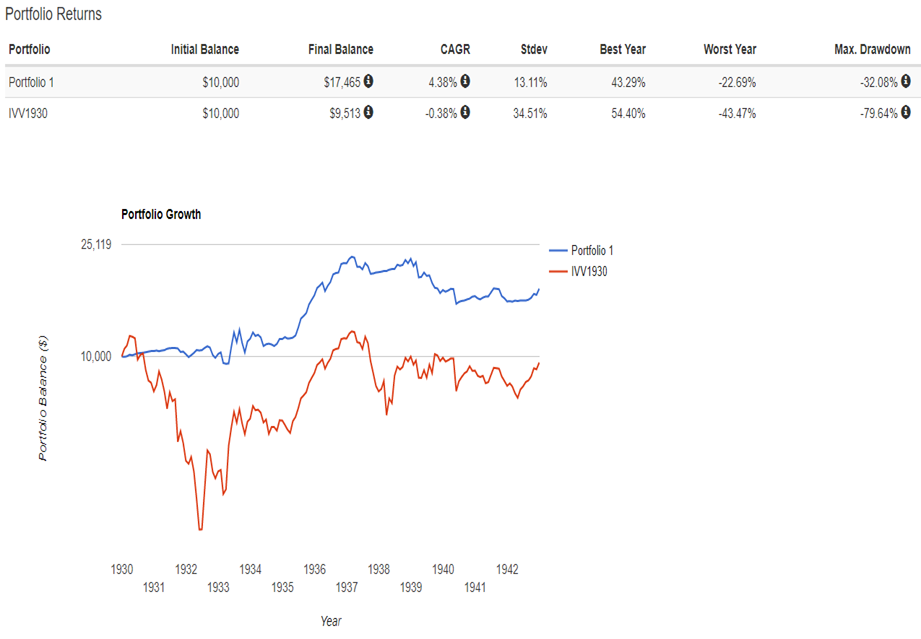
I find it interesting to actually zoom in on the great depression period because backtesting does a great job of simulating everything about past performance EXCEPT how it would have actually felt to live through it. Cliff Asness says it well in his description of what he calls time dilation:
"Well the single biggest difference between the real world and academia is - this sounds overly scientific - time dilation. I’ll explain what I mean. This is not relativistic time dilation as the only time I move at speeds near light is when there is pizza involved. But to borrow the term, your sense of time does change when you are running real money. Suppose you look at a cumulative return of a strategy with a Sharpe ratio of 0.7 and see a three year period with poor performance. It does not phase you one drop. You go: “Oh, look, that happened in 1973, but it came back by 1976, and that’s what a 0.7 Sharpe ratio does.” But living through those periods takes — subjectively, and in wear and tear on your internal organs — many times the actual time it really lasts. If you have a three year period where something doesn’t work, it ages you a decade. You face an immense pressure to change your models, you have bosses and clients who lose faith, and I cannot explain the amount of discipline you need."

Based on my decade of experience in working with investors, I can imagine the fear being so strong during this kind of period that investors would have bailed on the trend system even when it was doing its job of preserving capital. Certainly there was something else in the world that was making money during this period for investors to compare performance to and chase after the fact returns. When it comes to stocks, as prices go lower and therefore future expected returns increase…for some reason investors become less interested. Perhaps this would be different if stock prices were quoted in yields instead? I don't know, but behavioral biases are actually part of the academic explanation of why trend following has held up for so long, including well after its discovery.
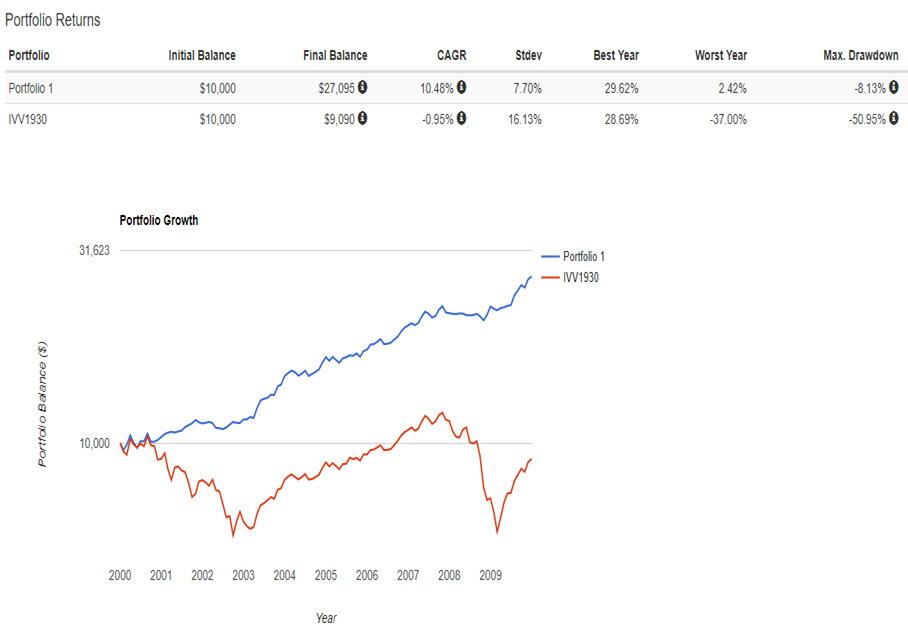
In more recent history, we saw a similar stretch in markets from 2000-2009, now referred to as “the lost decade” for the S&P 500. Trend following performed extremely well during this period, probably even better than should be expected during the next bear market due to how relatively stable both the up and down trends were during this period and also how strong the performance of US aggregate bonds was as a risk-off asset.

Trend following does tend to under perform during strong bull markets like we've seen since 2010, so investors must manage expectations accordingly. The only way to get 100% of the upside is to accept 100% of the downside. Also, trend following is going to generate turnover that will make it less tax efficient than buy and hold and should therefore be favored in tax advantaged accounts for high income earners. All of these things are what we can assist clients with in designing a comprehensive asset allocation plan that suits your personalized situation and needs.
Jesse Blom is a licensed investment advisor and Vice President of Lorintine Capital, LP. He provides investment advice to clients all over the United States and around the world. Jesse has been in financial services since 2008 and is a CERTIFIED FINANCIAL PLANNER™. Working with a CFP® professional represents the highest standard of financial planning advice. Jesse has a Bachelor of Science in Finance from Oral Roberts University. Jesse oversees the LC Diversified forum and contributes to the Steady Condors newsletter.


Join the conversation
You can post now and register later. If you have an account, sign in now to post with your account.
Note: Your post will require moderator approval before it will be visible.