
Ratio trading the earnings
Everyone knows what a ratio trade is right? A ratio can be found in many shapes, forms and directions, the SO beloved Hedged Straddle is a ratio whereby a larger number of long positions are offset (in part) with short positions that are closer in time. Its a more sophisticated version of the humble sell 1 short ITM (In The Money) and buy 2 long ITM (whether with calls and puts) for zero cash outlay (or even a minor cash+ or cash -) except margin.
This article is my own reflection of the use of this option strategy but inspired partially by what I learnt here on SO. I give it to you for criticism and suggestions - so agree or disagree with me, I look forward to the debate. The classic trade described above works both for calls and for puts, in the article I stuck to calls for illustrative purposes but it works just as well with puts.
Now you may ask why would you want to do a ratio trade ahead of earnings?
- there is a large portion of stocks which will run-up in price ahead of earnings;
- as we know from the SO long calendar, IV will rise ahead of the earnings announcement. An option that is ITM is less affected by IV rising than one that is ATM or OTM and so the mere rise in IV benefits the trade;
-
black swan protection - if the market were to tank really badly, the stock would end up below the short strike (if calls) and the whole trade would be a safe wash.
To put it simpler, the ratio trade ahead of earnings is a way to be in the market without risking your shirt - your losses tend to be mitigated if the trade is managed well. Anyone who has bought long calls before earnings will have known the joy of a 100%+ rise but of course also the bust of losing 100% when the market is adverse to you. Certainly if you are long and right on direction, nothing beats the simple long position however the ratio trade allows you to attempt this multiple times without losing your shirt if you are wrong. And you will be wrong occasionally even if you follow the process I describe below, the trick is to minimize the times you are wrong and the size of the loss whereas you rake in the profits when you get it right.
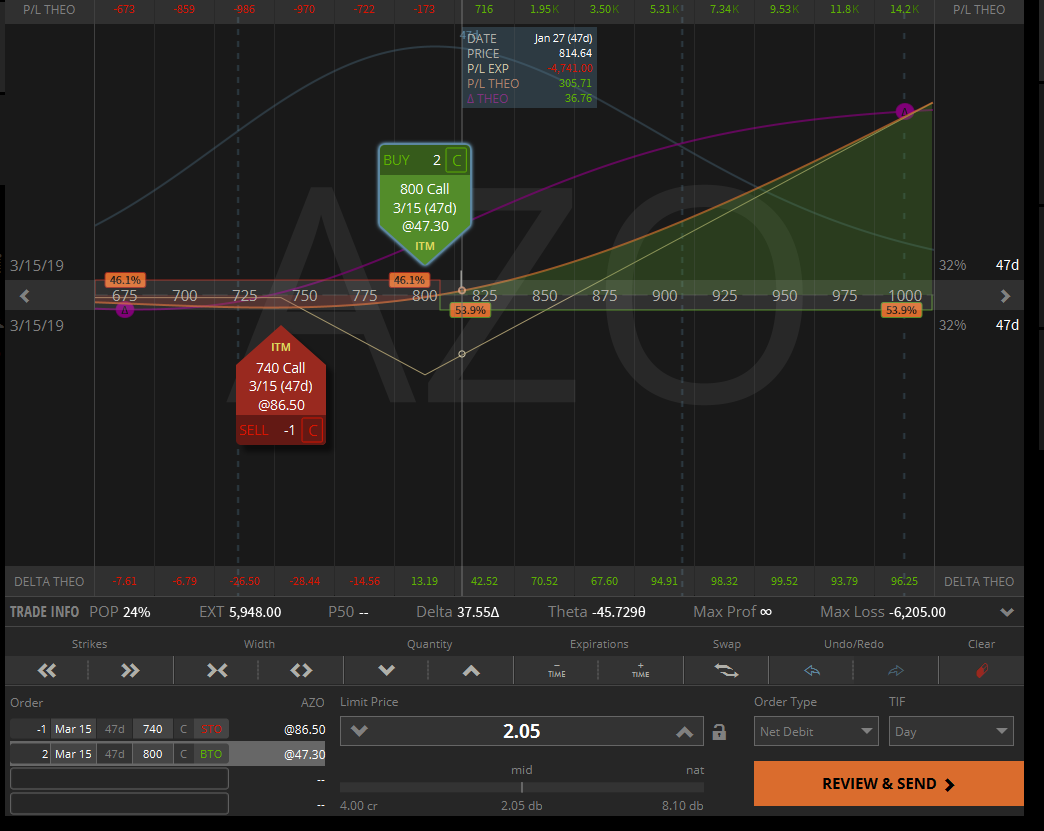
Now already some of you may be skeptical about the IV effect but believe me it is massive, below I will use AZO as an example. Why AZO? Well its a stock that seems to be rise before earnings but its not a perfect example and because its stock price is high the margin requirement makes it somewhat less practical to execute. Its an example and not meant to be followed, but it is a real live one, in any series of earnings a week there are never fewer than half a dozen potential candidates. Anyway, here is the schematic of an AZO 1:2 ratio based on 80 (short) and 60 (long) delta calls 15 March (i.e. after earnings which are unconfirmed for 29-Feb or 5-Mar).
Now I know that the IV of this position will rise to 112% the day before earnings so if I were to input that IV today you would see the position gain 10K right away:
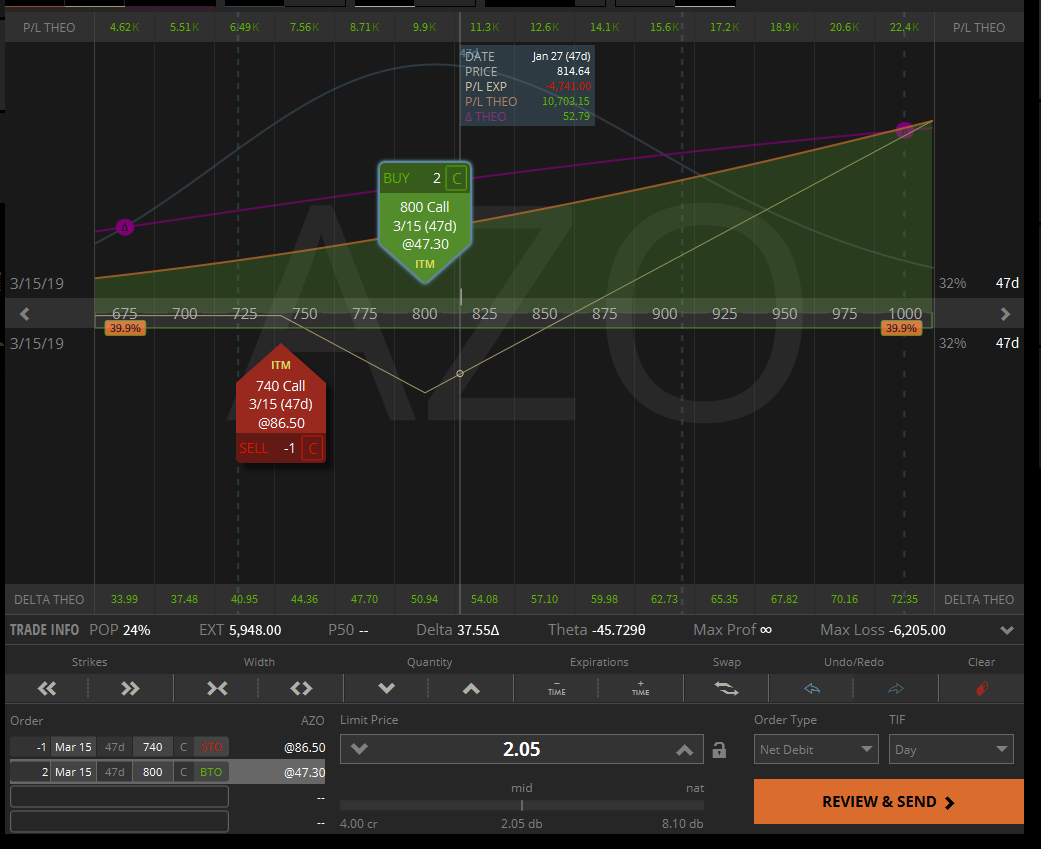
That's pretty impressive eh? Of course its not really fair because that is the IV value right before earnings so lets bring the date forward to 1st of March - kind of a guess of the right date seeing we are not sure what the earnings date actually is.
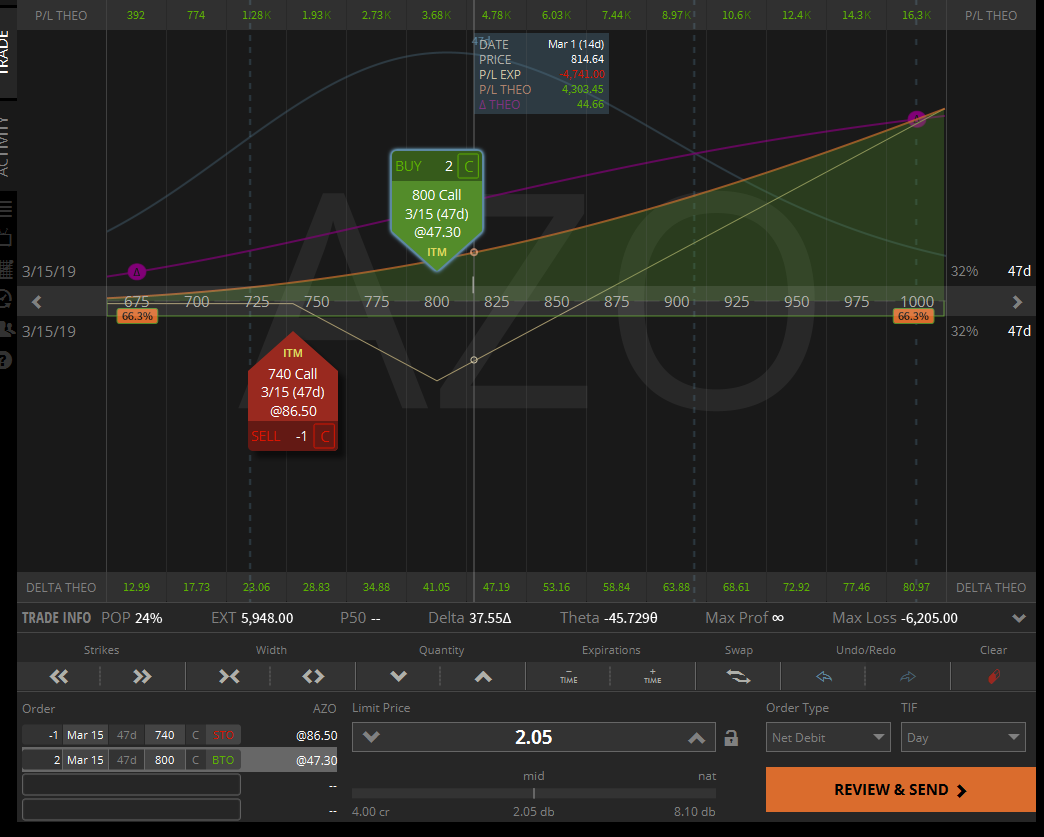
See how cool that is? Even if the stock would not budge, theoretically under these parameters our position would have GAINED in value. Note that reality tends to be more fractious than the juicy look of these charts but the effect really is there. The increase in IV is a buffer against theta losses and meanwhile we could make a bundle if the stock moved in the right direction.
What do I need to choose my trade?
When we are looking for a stock suitable to trade we need to clarify the following questions:
- Is this a stock that rises before earnings?
- When should I enter and when should I exit the position?
- What are the ideal deltas of the short/long position to maximize profits (and what is that profit target)?
- What ratio should I use? (this is much related to the previous question as we will see)
- What will the IV be on the planned end time of my trade?
- What stock price would allow me to break-even at the planned end-date of the trade and what stock price would get me (theoretically) to the planned profit?
If we have the answer to all these questions we can make a trading plan and if on the day everything looks good then execute it and follow the plan. It also allows us to have a guideline to decide to take the winnings or cut our losses because we have set the most important parameters. So lets take these questions one by one, using the tools that are commonly used by everyone on SO - true some of these are paying tools but I think they are well worth it. A little hardwork with charting software can probably also get you to most of the outcomes without the need to use paying services.
Which stock rise before earnings?
Well you could just look at stocks and check back previous earning dates and find them - however thanks to SO I have found VolHQ really useful here - they have a return scanner matrix. To use one example that has worked very well in the past and that I have traded successfully consistently: SBUX. See the heat map that have:
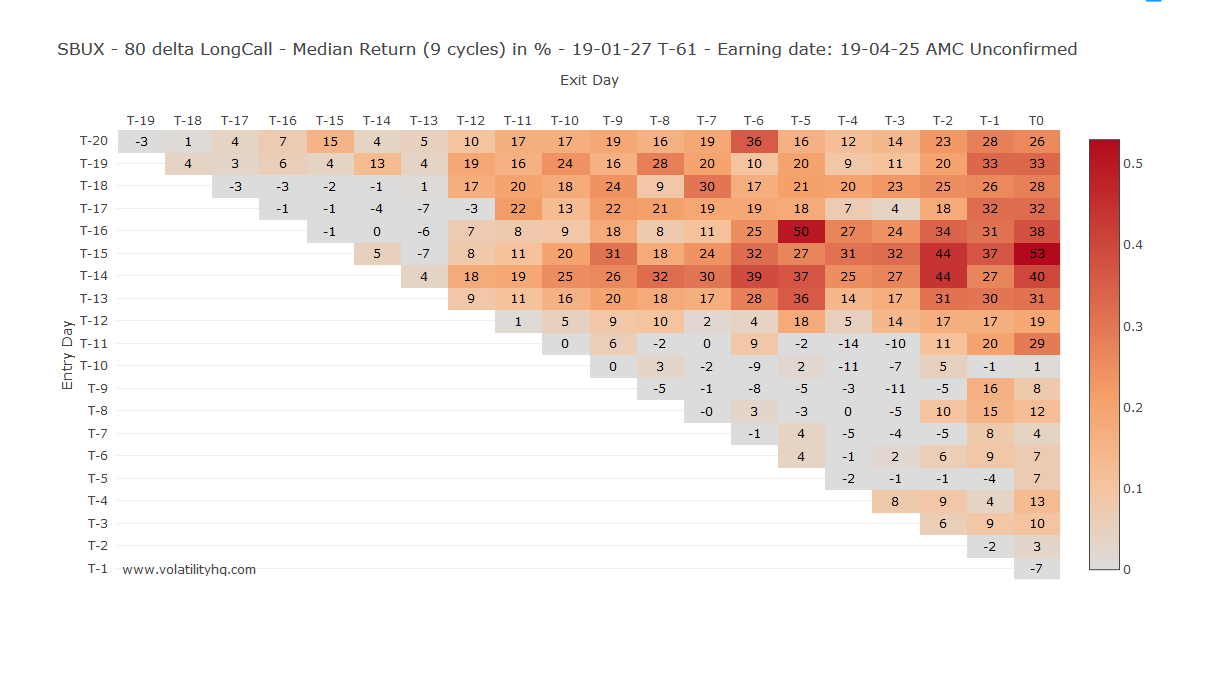
This is the sort of heat map you want to see - as you can see there are a couple of crossings where there are substantial profits. I always start out looking at the 80D one because I need to have a stock that actually rises and the 80D option is pretty close to the actual stock value. To show you the reverse type chart see UAA:
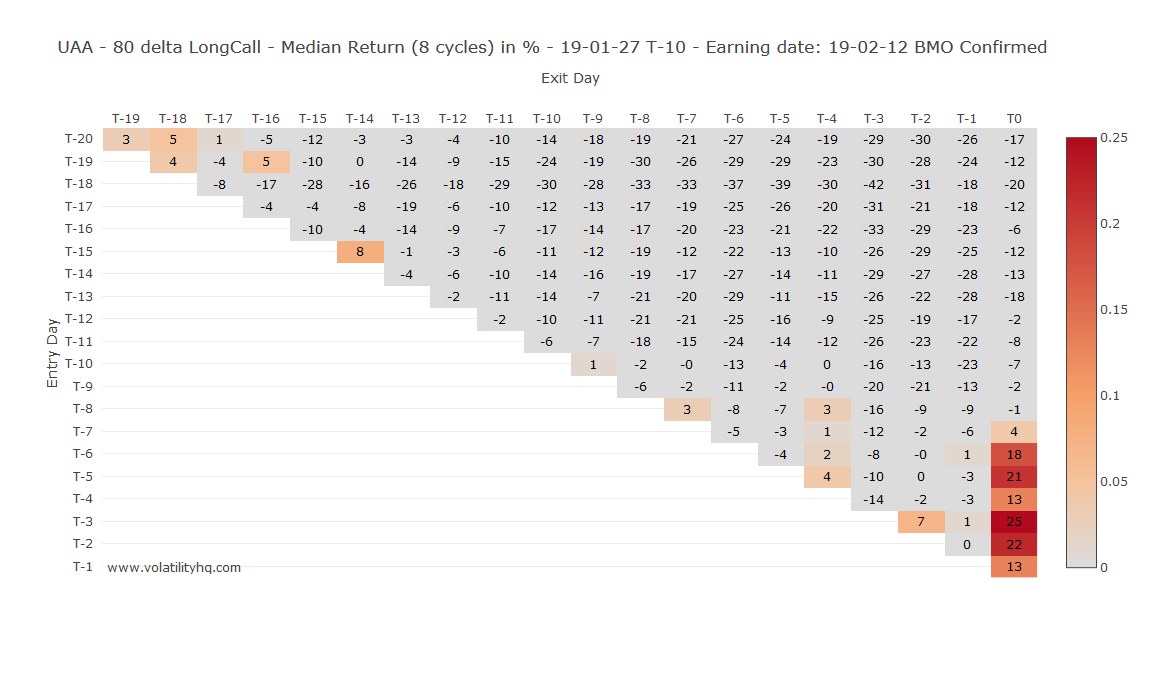
UAA is not a good candidate for this strategy the few red bits notwithstanding, in fact UAA is a good candidate for a ratio put trade - but that's another story.
When should I enter and exit the position?
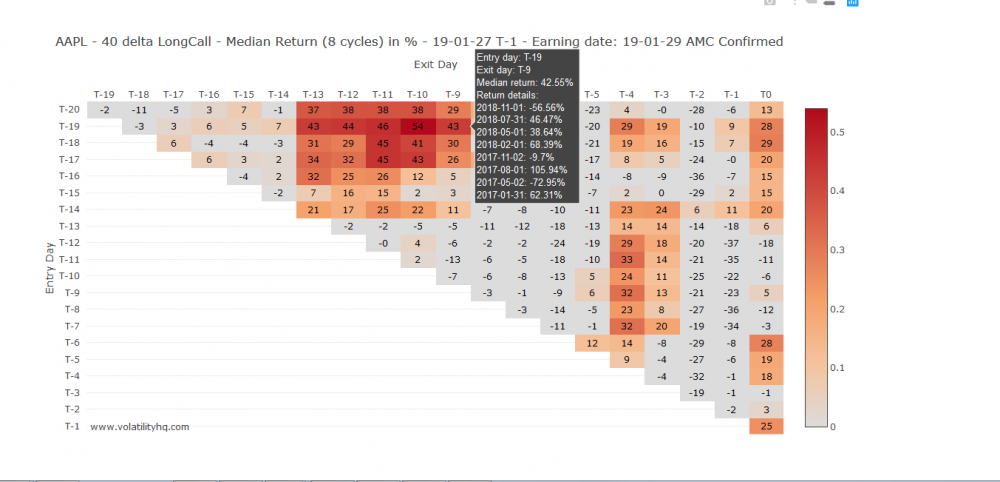
Now like I said we would look at AZO - the 80 Delta Return matrix of AZO looks like this:
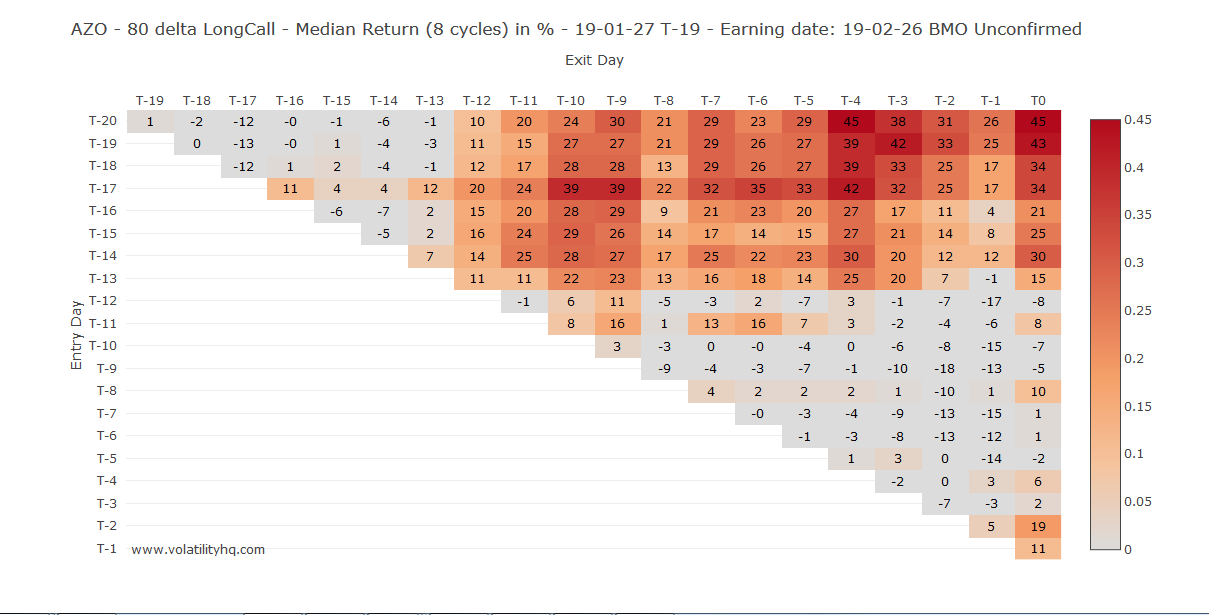
This is actually pretty good - so we should check out the 60,40 and 20 D long call returns as well:
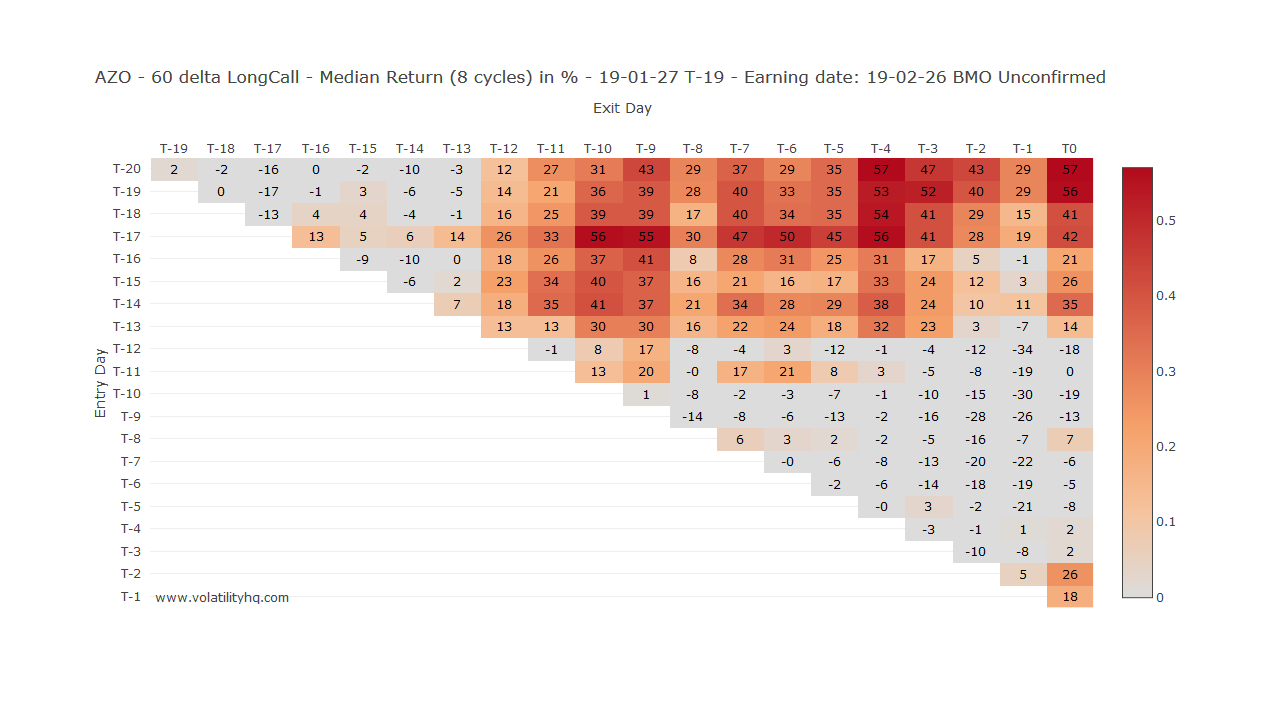
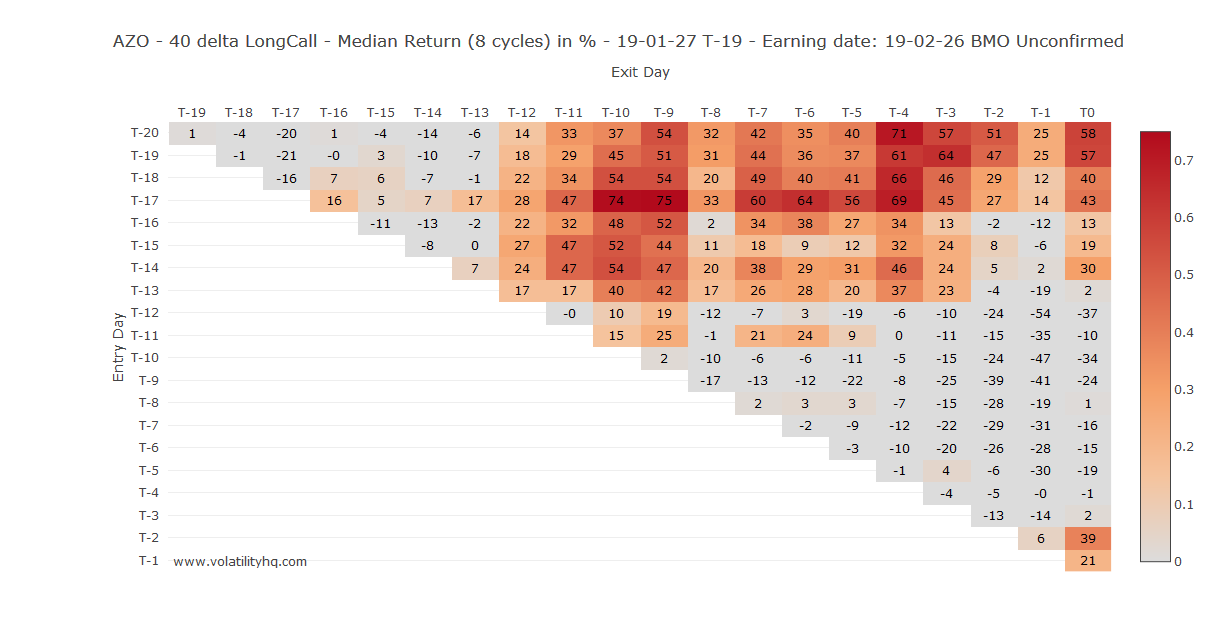
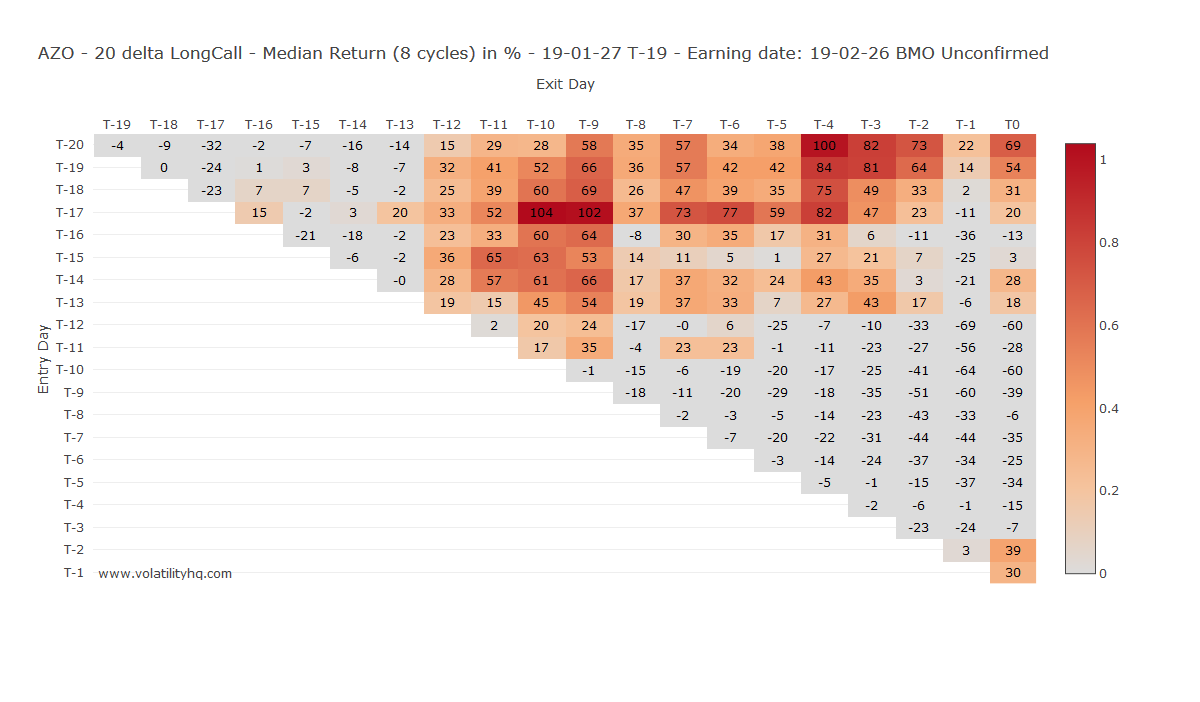
Now immediately you can see a sort of possibility here - somewhere between T-20 /T-16 opening and closing between T-12/T-8 seems to have the most consistent warm areas in the heat map. In fact when you look in detail there are probably several opportunities but the highest returns for all the options regardless of delta appears to be T-17 open and close T-9 (give or take a day depending on the option). Some other variants are conceivable and worth looking at - but this early one has the additional comfort that we have time to adapt if necessary before earnings hit us. That means presuming the earnings are announced somewhere in between the two dates currently mooted that we should open on or around 8th of February and close the trade on or around the 18th of February, In any case we shouldn't hold the position too long because it seems to worsen thereafter.
What are the ideal deltas for the options to be used in the ratio?
Here is where I think I can claim some originality - for a long while I presumed a one strike ITM, one strike OTM was the best approach or that possibly to be effective the ratio had to be 1:3 - but in fact nothing is further from the truth. It depends on the stock, the IV and the timing - there is no hard and fast rule though it is somewhat more common to have higher delta ratios being effective. This calculation is quite complex because you have to compare like for like. Practically speaking the comparison must take differences of capital outlay due to margin into account as well as the other parameters of option pricing. I made a spreadsheet for this and you need to fill the highlighted sections in yourself to get results (all other parts are filled automatically):
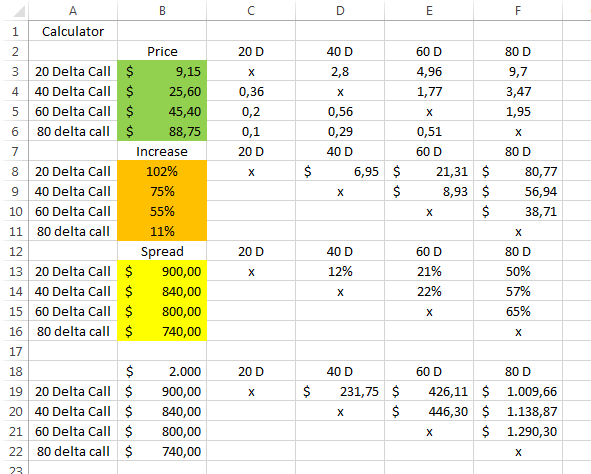
You need to determine the stock price corresponding to the 80/60/409/20 delta calls respectively for the option series ending soonest after earnings announcement. In this case as it was uncertain I chose the regular 3rd Friday expiry because this series would be more liquid and relevant in terms of option pricing. The relevant strike prices are not exactly corresponding but close enough for my purposes - stocks with lower prices the gaps tend be linear 5$ from delta to delta, but not here as they are 740/800/840/900$ respectively for the 80/60/40/20 Delta call series. I input these in the yellow highlighted section.
The orange section has the return as per volatilityHQ return matrix based on our timings above. The green section is simply last Friday's mid-price of the options in question. To determine which is the ideal delta combination with the above factors we look at the third and fourth set of table marked SPREAD and $2000 respectively. They are in fact the same except the first one gives a return in % and other the return based on a hypothetical 2000$ investment for each of the positions. In this case the 80 delta short and 60 delta long appears to be the winner as has the highest return of 65%.
What ratio should I use?
Well my excel sheet tells us that in the first section of the table marked PRICE - if we look at the 60 DELTA Call and match that against the column of the 80 Delta call we find a 2:1 ratio to be appropriate.
Great you will say, can I trade now?
Nope. There are a few more things to do and a few more caveats to address before you press that trade button.
What will the IV be at the end of the trade?
For this I return again to volatility HQ and let it run its normal calendar function. This is useful anyway because you can check at the same time whether the stock is suitable for a calendar. However I am looking at the third chart down on the calendar plots from vol.HQ:
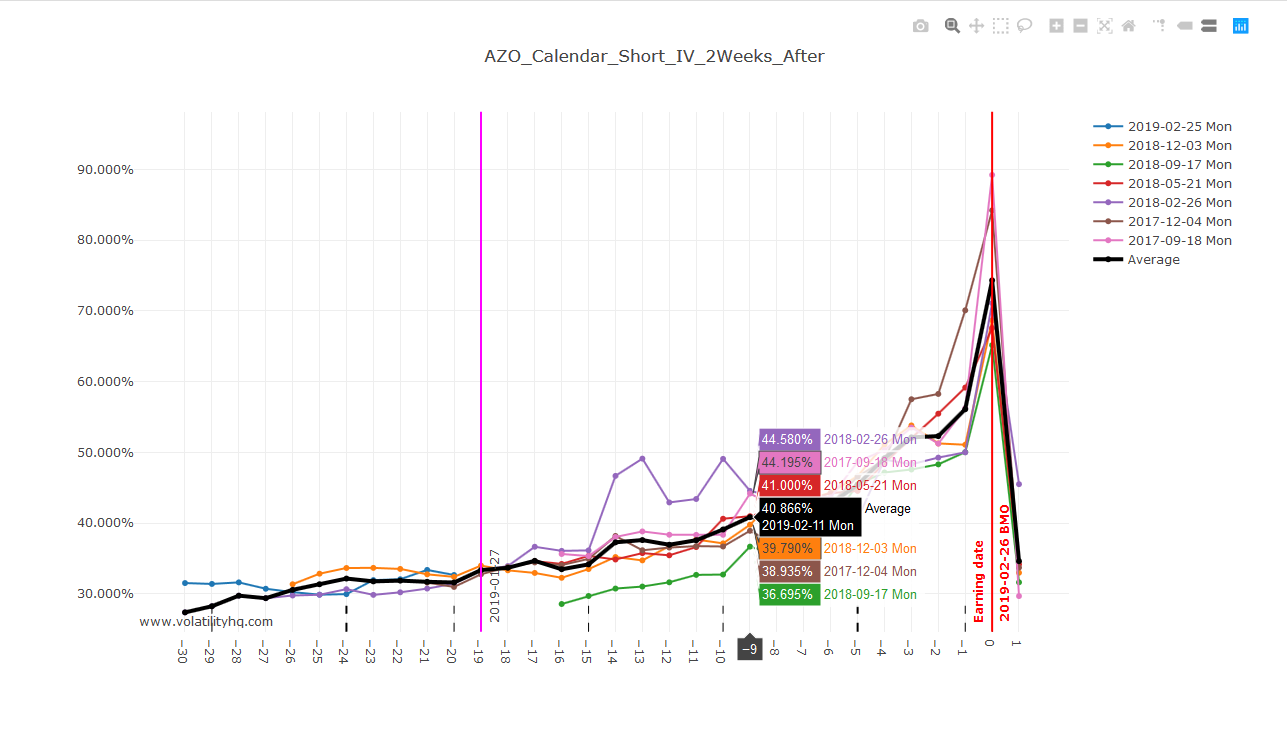
So at T-9 - our proposed exit date for the trade IV would be ca. 41%, this we can now input into our option valuation as we have entry prices (admittedly based on today's option prices) and we know our exit date and the IV at that time.
What is my breakeven/target profit stock price at exit day?
It turns out our break-even price is today's stock price - that's pretty cool - even if nothing happens we should be okay(ish), the projection is for the exit date at T-9:
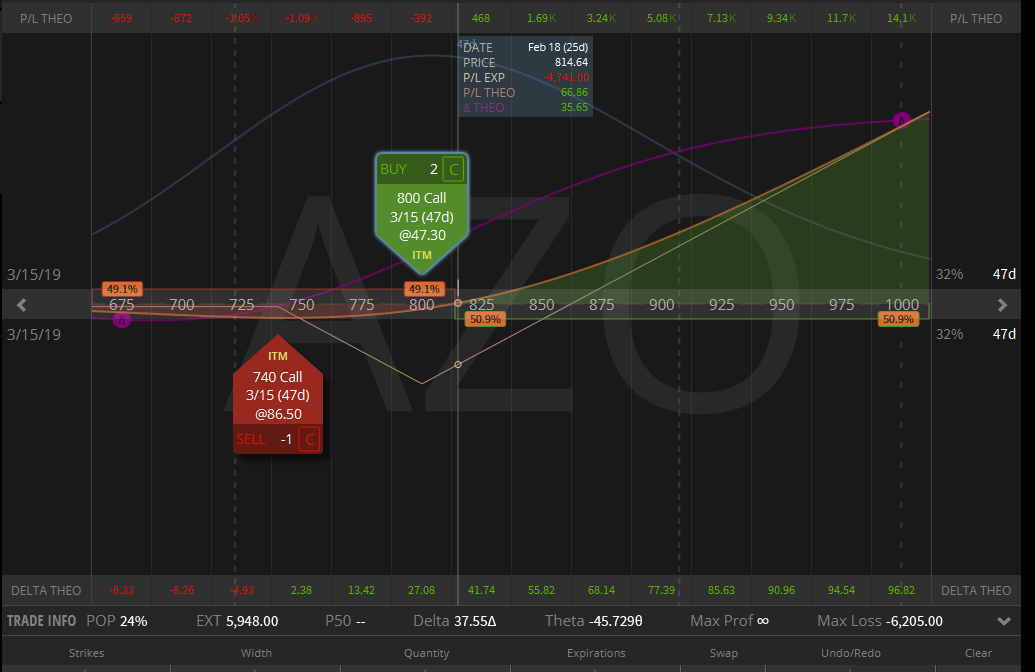
In terms of our profit - lets say we aim at 50% - for reasons I explain in the caveats below its better to be conservative and grab the money and run when you can. This would already be a great success - in this case the trade would have required 6K+ margin so I would look for 3K profit. As it turns out that is around the 871.50$ mark for AZO. Now you might say that is quite a climb but it is in fact only +7% compared to today - not at all out of the question and well within previous iterations of this stocks earnings run-ups.
Ok now we have a plan:
- we plan to enter the trade on 8th of February on 2:1 ratio of the 740/800$ 15-Mar call options;
- we plan to exit at the latest on 18th of February
- if at any time the stock should hit 870$+ we liquidate because that would be our end game if it was the final day of the trade as well;
-
if during the trade the option threatens to stick below 814$ we might have to cut our losses. In fact for this particular ratio it doesnt look too problematic as the cushion of IV is very large.
Houston we might have a problem? (caveats)
Ok so what are the downsides and tricky things regarding this trade?
-
The black swan protection is a bit of a false security. Many people think that the trade will be ok if the stock tanks because in that case at expiry we would have the small credit (or debit) left over from the ratio. However this trade must NOT BE HELD THROUGH EARNINGS - therefore the IV will remain elevated and if the stock tanked you may find that the market prices your option well below the price at the end. Yes - WELL BELOW - even when the stock is ways under the short option. This is a real pain because unless you take the trade through earnings because the market tanked so massively it couldn't possibly pop up - it could just inconveniently rise to exactly your worst point (long strike). In that case you have the max. theoretical loss and no time left to adapt the position. There is no free lunch - the trade can lose money - certainly much less than an outright long but occasionally I have lost as much as 50% of the max. theoretical loss;
-
Finding the right stock is not so easy and the heatmaps on vol. hQ are averages - it is very important to hover your mouse over the crossing of entry date v. exit date and see what the average is based on:
-
Liquidity remains important - you cannot do this with stocks with very wide spreads. The ratio is more forgiving than the calendar in that there is no limit to do this on low value stocks but you cant have a spreads widening too much as you need to buy and sell twice;
-
This prep work that you do - you have to repeat it all over before you actually commit to the trade. Between then and now some of the parameters (not all) will have changed and therefore be prepared to have a long hard look before pressing that COMMIT button;
-
You have to watch these trades and adapt sometimes - do not forget to double check actual earnings dates - this is one reason why even very consistent but time narrow successful past experience is not enough. You could easily be a few days off and like I said whatever you do dont take the trade through earnings, the IV crush post earnings will wipe out even profitable positions pre-earnings that benefit from a post-earnings move in their direction. I am NOT KIDDING - I have lost money on Netflix going up 30$ over my long strike on a ratio trade held through earnings.

Ok you scared me - any soothing words?
No system is perfect and I am interested to hear feedback. However my experience has been very good so far and it is improving in particular as I have now nailed down better what sort of ratio to enter for every stock I go on. Including the periods when I was still finding my way (which included some clunkers I can tell you), I have roughly the following batting ratio:
- profitable on target (or near enough/over - always more than 10% on average 18%): 26
- on or around 0% (includes +5/-5% but most frequently just +1/-1%): 18
- losers on average about -20%: 10
Since I started selecting the deltas more carefully my hit ratio has improved with no real losers at all but the sample size is too small in my opinion. Right now I am trading blocks of around 2-3K in value though I have gone over 6K on occasion. I think they are ok for the retail investor - it would be quite hard to open a 100 calls and short a 100 calls in most stocks that are suitable. Generally though for lower volumes you get good prices - institutionals in fact have bad prices because they buy so much volume they influence the market price directly.
Would you like to learn in real time how to identify those opportunities and trade them? Click the button below to get started!
Join SteadyOptions Now!
Related articles:
- Long Call Option Strategy
- Long Put Option Strategy
- 4 Alternatives To Buying Call Options
- Options Spreads: Put & Call Combination Strategies


There are no comments to display.
Create an account or sign in to comment
You need to be a member in order to leave a comment
Create an account
Sign up for a new account. It's easy and free!
Register a new account
Sign in
Already have an account? Sign in here.
Sign In Now