SteadyOptions is an options trading forum where you can find solutions from top options traders. Join Us!

We’ve all been there… researching options strategies and unable to find the answers we’re looking for. SteadyOptions has your solution.

Selling Puts: The Good, The Bad And The Ugly


Hardly a day goes by that I don't read an article or hear some pundit extol the merits of selling puts (put-write).This article will discuss various variations of put-write strategies. What accounts for put-write strategies under-performance? How to fix put-write underperformance? Why "easy money" isn't so easy.

image.png


Selling puts seems to be of such interest that there are even ETFs, such as Wisdom Tree's Put-Write ETF (PUTW) that offer an easy path for the inexperienced investor to compliment their portfolio with put-write exposure. 


Over the years I've written scores of articles with the goal of trying to help investors use options intelligently. My perspective has always been to lay the fundamental groundwork that investors need before they go "jumping in" to areas that are complex. I hope this article will add to the reader's knowledge base. If the reader knows more, they can make better choices.


Let me start off with a qualification. Many investors use options on a "one-off" or "hit-and-run" style. They are using options as a trading vehicle ... not as an investing vehicle. I can't and won't address this type of option usage because I'm an investor not a trader. Instead, I will concentrate strictly on the investor that is looking to supplement their portfolio. These investors typically sell puts as a substitute for direct stock ownership; an adjunct to portfolio protection; a "wait and see" and similar objectives. They are not "in-and-out" but more permanent in nature.


Additionally, let me add that I will contain this article to selling puts on the S&P 500. Personally I use SPX options on the S&P 500 because of some tax benefits. However, position size and some other factors of SPX make it impractical for many investors. The concepts are easily transferable to options on the SPDR S&P 500 ETF (SPY) which tracks the SPX index pretty closely. Furthermore, though the principles put forth here are restricted to the S&P, they can be extended to almost any stock.


The Selling Point

No, I'm not starting out with the point at which one should sell puts. Instead, I'm referring to how options are "sold" or marketed to investors. For we must, at some stage, reconcile what investors are told with reality.


The allure of selling puts is derived from the perception that they are less volatile and offer some downside protection as opposed to outright ownership of the underlying. This is mostly true. Selling puts can be less volatile and will out-perform in a steadily down market or a steadily flat market. At least in theory. 


The Theory

The basic theory that attracts investors rests on the prospects of pocketing extrinsic value. If there were no extrinsic to pocket then one might just as well own the underlying. Now the amount of extrinsic varies with the strike, the expiry and volatility. So, though no one rule is universal, ATM puts extrinsic value ... with average volatility and weekly expiry ... usually ranges around .40% to .50% of the underlying price(and can be much higher at extreme volatility). So, if SPY is trading at, say, $290, one can expect the average weekly ATM extrinsic premium to be around $1.20 to $1.45. So if we extrapolate the potential gain using the .50% number and assuming the market is flat for one year ... one can make 26% by collecting .50% x 52 weeks. Pretty good considering investing in the underlying returned nothing.


So, we start with a potential upside of 26% but we have to modify the potential return by accounting for losses incurred when the market drops. But 26% is a big cushion for absorption.


The problem with this theory is there is no such thing as a steadily flat market ... or a steadily up market ... or a steadily down market. Markets are not steady. They unpredictably move in whatever direction they are headed in fits and spurts ... ups and downs ... zig-zags.


I've been  tracking the S&P weekly for the last four years. During this period the S&P has moved upward from $1,968 to $2,914 ... a gain of close to 50%. By all accounts a bull scenario. So, with a strong bull one would assume that down-movements that would otherwise erode the cumulative extrinsic would be modest.


But if we looked at a chart .... not the usual chart of the actual S&P  climb ... but rather of its weekly "fits-and-spurts" the picture is not as clear.


Here's a chart that details how the S&P has performed ... weekly ... over the last four years ... from October 2014 through last week.
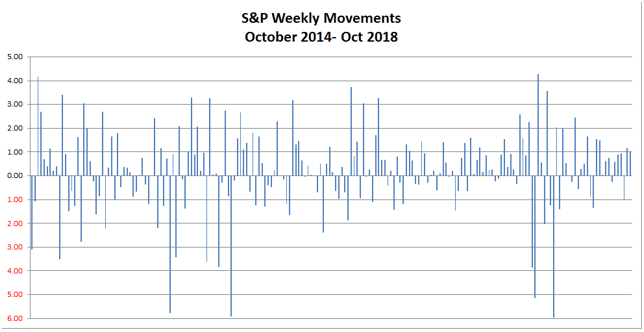

image.png
 

So, looking at this chart at first blush and without further calculation, it is unclear if the S&P is net up, down or flat. Imagine ... in a strong bull market ... up 50% in 4 years ... a weekly chart doesn't look like that's the case. There are certainly many down weeks and many large down weeks. 

Now, if we further analyzed this chart ... not for its end gain of 50% .. but for how it got there ... we'd find the following:

                                   Number of Weeks
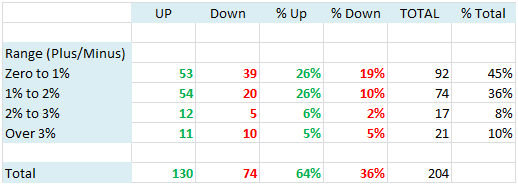
image.png


If we broke this down even further we'd find:

1) over 1/3rd of the time (36%) the market is down,

2) When the market is down, almost half the time the drop is more than 1%.

3) 20% of the time the market is down it falls by more than 2% 


And remember ... this is on a weekly basis.


So, even in a strong bull, down movements are common and substantial. It's just that up movements are more plentiful and overcome the down movements.


What these charts also highlight is every strategy ... put writes, or not ... is dependent upon how successfully the investor manages the up and down swings as well as the over-riding direction. For surely, if one positions on the assumption of a down market and the market is actually headed upwards they will under-perform. Even if they guess the direction correctly, is a drop a reversal or a buying opportunity? Is a rise a bull indicator or a "dead cat"? Do they react emotionally and go the wrong way?


What should one do? Should they go out-of-the money ---OTM; at-the-money ---ATM or in-the-money ---ITM? For surely, results will vary widely depending upon the accuracy of these decisions. So, let's take a look.


At the Money (The Bad)

Selling puts ATM means that on each expiry one simply rolls forward the put at the current price. If the market goes up, one chases the strike up and if the market goes down, one chase the strike down.

Seems simple, but is it advantageous? Fortunately we can look to the performance of the Wisdom Tree Put-Write ETF (PUTW) for a simple comparison. Here goes: 
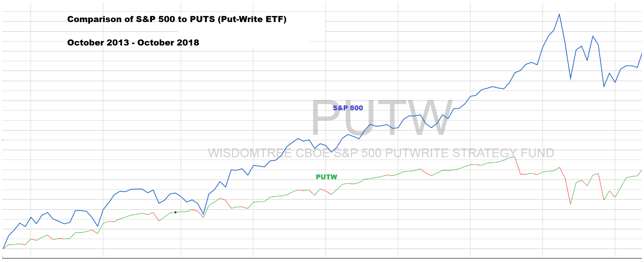

image.png
 

What we see is that PUTW was less volatile. But, most importantly, it also under-performed ... and under-performed substantially.


Back in June 2016, I wrote an article on PUTW. In that article I explained that it suffered from a flaw ... that it is susceptible to volatility swings and can be "whip-sawed" in up/down markets. I suggested investors considering PUTW need to supplement their positions after a drop to avoid the "whip-saw".


Now, I can't manipulate PUTW data to a "what if scenario" --- it is what it is. So, instead, let me go to my previous 4 year chart of the S&P weekly. Here's what an ATM strategy, sold weekly (PUTW uses monthly but it's conceptually the same) would have looked like:
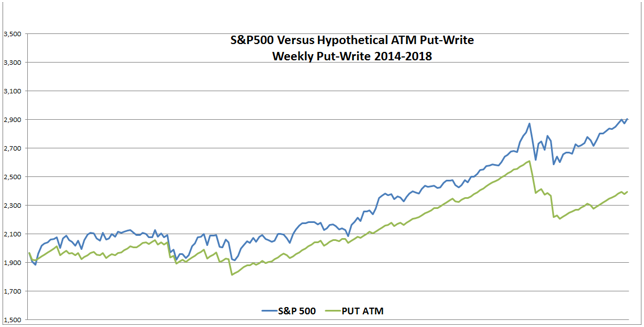

image.png


As is evident, the result parallels the performance of PUTW. So we see consistent result that would lead one to examine why such a huge nonperformance. Is the concept of selling puts wrong or is the execution wrong?


But before I go into a deeper examination of the issue, let me be fair and illustrate that in a down market put-writes would outperform the underlying as this hypothetical chart reveals (for this purpose I simply reversed the actual S&P values ... starting at $2,914 and dropping to $1,968)
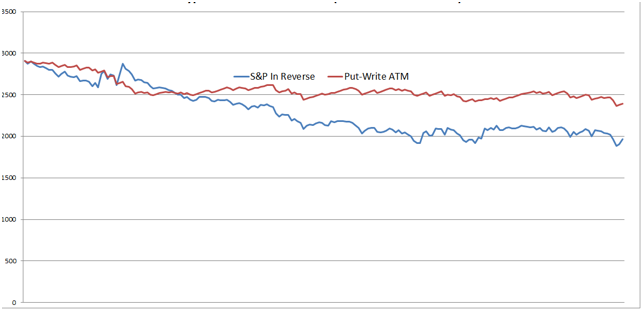

image.png
 

Selling Puts ATM in a down market will do better than owning the underlying. But it still loses.


Hold The Strike (the Good)

The problem with selling ATM puts is the "whip-saw". One must move away from the thought that the market will be "steadily" anything and accept that it will zig-zag up or down. So, 36% of the time the hoped for extrinsic gains will be reduced. Over half those times it will not only be reduced, but completely wiped out and thrown into losses.


This raises a dilemma ... if in a bull scenario, the investor losses substantial extrinsic value ... and extrinsic value is all they have to gain ... what does one do? The answer to this dilemma is to Hold The Strike. What this means is that if there is a drop, do not chase the drop by selling the next put ATM at the lower price. Sell the put ITM at the previous strike and hold it there --- as long as necessary --- until the strike is recovered. You'll earn a little less extrinsic but avoid the "whip-saw". 


So, if SPY is at $290 when you sell the first ATM strike and it falls to $$288 ... do NOT roll the put ATM at a $288 strike but hold it at $290 strike. Most importantly ... keep holding that strike until SPY recovers and then go back to ATM ... until such time as it drops, again. It may recover in a week, a month or a few years. But just keep at it.


What this does is recover any loss of extrinsic value that occurs on a drop when the inevitable bounce occurs.


Here's a chart that shows the results of a "hold the strike" put-write strategy, employed weekly over the last four years.
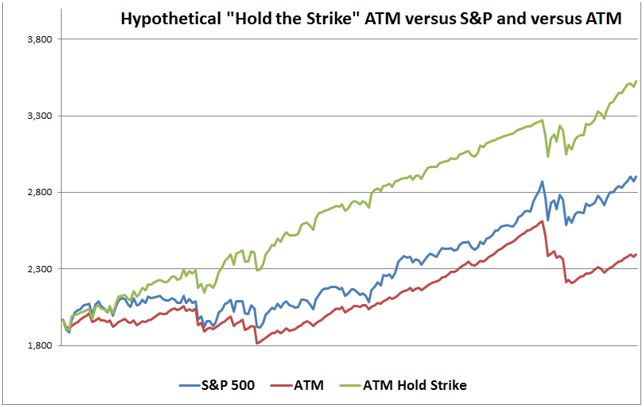
image.png


Wow !!! Let's make sure we read this right:

1) The S&P ended up $947 to $2,915 a 50% gain

2) ATM (such as PUTW) ended with just a gain of $440 ... up 22%

3) Hold the strike gained $1,568 ... up almost 80%


Now I certainly realize that this must be astonishing to many readers. It's impossible to put all the numbers in plain sight or share the algorithms. So, instead, let me give you some simple resultant math.
 

ATM: The total amount of potential extrinsic was $2,744 ... or an average of $13.45 per week. There are no gains if S&P rises above the strike. However, there are intrinsic losses on dips that were NOT recovered (whip-sawed) that totaled $2,304. So, the net gain was only $440 ($2,744 extrinsic gain  less $2,304 intrinsic loss on down weeks).
 

ATM-Hold the Strike:The total amount of extrinsic was $1,568 ... about $7.68 per week. Though the full $13.45 extrinsic is earned on every ATM strike the extrinsic is reduced for every ITM "held" strike. So we have less extrinsic but more upward intrinsic. One loses $1,176  extrinsic as compared to selling ATM ... but the sacrifice of extrinsic means one recovers the down move loss on the bounce and that zeroes out the losses.


So. with the down loss zeroed out ... one is left with 100% net extrinsic gain. The sacrifice of $1,176 in extrinsic regained $2,304 in intrinsic. So, that means a net gain of $1,128. That's the difference between up 22% and up 80%.


And that's why hold the strike is so successful. 


Out of the Money (the ugly)

I seem to always hear about selling deep OTM puts ... so deep that they have a 90% chance of winning. It's the "easy money" play. I need to address the "90% win" mentality. As we saw from the previous weekly up-n-down chart ... over the last four years ... in a raging bull market .. the win ratio would have actually  come in at around 93% for DOTM put-writes. Right around where the "easy money" player was planning. Hurrah !!! ... or maybe not.

Let's see what would have happened for weekly DOTM put-writes over the last four years after accounting for the 7% of the time they lose. I've illustrated 2% and 3% DOTM.
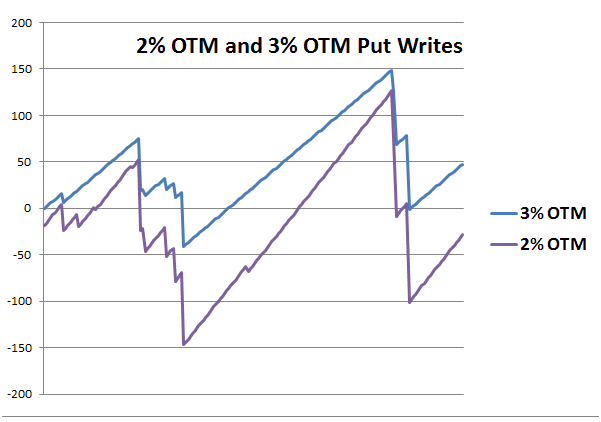

image.png
 

Now I won't go into detail other than to make these observations:


1) 2% DOTM shows a net loss but 3% DOTM a gain of $50. That $50 gain represents ONE SPX option and translates to $5,000 in actual monetary gain. However, it is not without a price ... the exposure is between $200,000 and $300,000 if one uses cash secured puts and utilizes about $75,000 in margin, otherwise.


2) One could do better if they entered at different points, but the future will even that out. 


3) Trading costs are not included. Assuming just $7.95 per trade ... 204 trades .. and it reduces the gains by over $1,500 for a net gain for the 3% DOTM of around $3,500. Had the "easy money" player just put the $75,000 in margin in a CD would have returned more. Not to mention the huge differential in favor of putting a cash secured $200,000 in a CD for four years


4) However, all the dynamics change in a positive way simply "holding the strike" on every over-run. I guess there's a difference between "easy money" and "smart money"


In The Money (more good?)

In all three of the strategies so far presented the investor is simply trying to earn extrinsic value. S&P rises earn nothing more. Now, that leads to whether one should try to gain some upward intrinsic as well. In essence, sacrificing even more extrinsic by going ITM and looking to gain from upward movement.


If someone could actually have placed the strike exactly at the most opportune level ... week in and week out ... they would have increased their overall gain by about another 45%. Nice to dream about ... impossible to achieve. 


However, this begs the question ... how far ITM should one go?


Frankly, I don't know. That said here's a chart that shows the results if one went 1% ITM and held the strike.
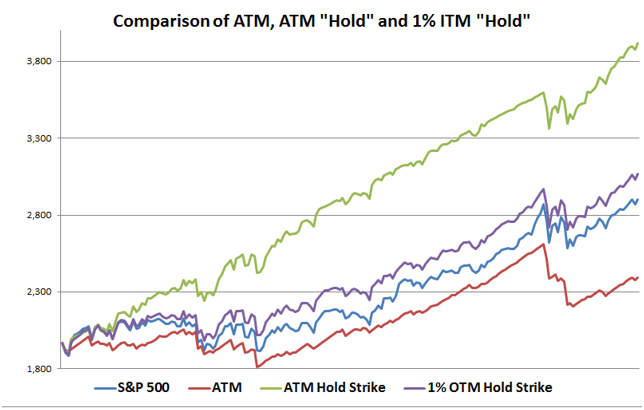

image.png


So, what one sees is that ATM "hold" is still the most lucrative. Next in line is going 1% ITM and "holding". Third place is outright ownership of the underlying and in last place is ATM.


Now, of course, there must be some optimum level that will improve the ITM and move it further up the chart and perhaps some level that will overtake ATM "hold". My guess is that the optimum level lies somewhere between 1/2% and 3/4%. But I haven't found the precise level.


And, of course, none of these charts account for applied intelligence and adjusting the strike up or down based upon one's market acumen. Keep in mind that this is general principles only. Even so, unless one has market foresight that is better than average, playing with and trying to improve on fundamentals can be a mistake.


But, let me stress, no matter what ... whatever one does ... they MUST "hold the strike".


Summary

What I've tried to do here is illustrate various put-write strategies. Of course they are based upon past results in a bull market. By illustrating these different strategies it becomes apparent that the flaw in selling puts is failure to account for "whip-saw". But this failure can be easily overcome by "holding the strike".


Now, I won't argue that one could do better "timing the market". There are always "experts" that can brag about how they make perfect decisions and have a 6th sense about these things. However, studies have shown that for most investors, timing the market is dilutive and not accretive to returns. I'm hoping to speak to a broader audience than the "trader".


With all that said, this article leaves out another strategy for put-writes. A strategy that requires more than an "add-on" to an otherwise long enough article.  Though I don't like cliff-hangers, readers will have to wait till my next article to round it out.

Ken Reel is a well known and respected Seeking Alpha Contributor with over 100 articles. He has worked in the financial service industry for 40 years. Ken's area of expertise is risk management and complex financial products. He has been a frequent speaker, on behalf of many financial firms, to financial professionals across the country. He has extensive experience in statistics and actuarial science.

What Is SteadyOptions?

12 Years CAGR of 129.0%

Full Trading Plan

Complete Portfolio Approach

Real-time trade sharing: entry, exit, and adjustments

Diversified Options Strategies

Exclusive Community Forum

Steady And Consistent Gains

High Quality Education

Risk Management, Portfolio Size

Performance based on real fills

Subscribe to SteadyOptions now and experience the full power of options trading!
Subscribe

Non-directional Options Strategies

10-15 trade Ideas Per Month

Targets 5-7% Monthly Net Return

Visit our Education Center

Recent Articles

Articles

  • The 7 Most Popular Cryptocurrencies Right Now

    There are thought to be 20,000 cryptocurrencies currently in existence. While a lot of these are inactive or discontinued, a lot of them are still being traded on a daily basis. But just which cryptocurrencies are most popular? This post takes a look at the top 7 most traded cryptocurrencies.

    By Kim,

    • 0 comments
    • 2,739 views
  • Harnessing Monte Carlo Simulations for Options Trading: A Strategic Approach

    In the world of options trading, one of the greatest challenges is determining future price ranges with enough accuracy to structure profitable trades. One method traders can leverage to enhance these predictions is Monte Carlo simulations, a powerful statistical tool that allows for the projection of a stock or ETF's future price distribution based on historical data.

    By Romuald,

    • 10 comments
    • 7,441 views
  • Is There Such A Thing As Risk-Management Within Crypto Trading?

    Any trader looking to build reliable long-term wealth is best off avoiding cryptocurrency. At least, this is a message that the experts have been touting since crypto entered the trading sphere and, in many ways, they aren’t wrong. The volatile nature of cryptocurrencies alone places them very much in the red danger zone of high-risk investments.

    By Kim,

    • 0 comments
    • 2,643 views
  • Is There A ‘Free Lunch’ In Options?


    In olden times, alchemists would search for the philosopher’s stone, the material that would turn other materials into gold. Option traders likewise sometimes overtly, sometimes secretly hope to find something which is even sweeter than being able to play video games for money with Moincoins, that most elusive of all option positions: the risk free trade with guaranteed positive outcome.

    By TrustyJules,

    • 1 comment
    • 17,669 views
  • What Are Covered Calls And How Do They Work?

    A covered call is an options trading strategy where an investor holds a long position in an asset (most usually an equity) and sells call options on that same asset. This strategy can generate additional income from the premium received for selling the call options.

    By Kim,

    • 0 comments
    • 3,026 views
  • SPX Options vs. SPY Options: Which Should I Trade?

    Trading options on the S&P 500 is a popular way to make money on the index. There are several ways traders use this index, but two of the most popular are to trade options on SPX or SPY. One key difference between the two is that SPX options are based on the index, while SPY options are based on an exchange-traded fund (ETF) that tracks the index.

    By Mark Wolfinger,

    • 0 comments
    • 7,626 views
  • Yes, We Are Playing Not to Lose!

    There are many trading quotes from different traders/investors, but this one is one of my favorites: “In trading/investing it's not about how much you make, but how much you don't lose" - Bernard Baruch. At SteadyOptions, this has been one of our major goals in the last 12 years.

    By Kim,

    • 0 comments
    • 4,371 views
  • The Impact of Implied Volatility (IV) on Popular Options Trades

    You’ll often read that a given option trade is either vega positive (meaning that IV rising will help it and IV falling will hurt it) or vega negative (meaning IV falling will help and IV rising will hurt).   However, in fact many popular options spreads can be either vega positive or vega negative depending where where the stock price is relative to the spread strikes.  

    By Yowster,

    • 0 comments
    • 6,809 views
  • Please Follow Me Inside The Insiders

    The greatest joy in investing in options is when you are right on direction. It’s really hard to beat any return that is based on a correct options bet on the direction of a stock, which is why we spend much of our time poring over charts, historical analysis, Elliot waves, RSI and what not.

    By TrustyJules,

    • 0 comments
    • 3,950 views
  • Trading Earnings With Ratio Spread

    A 1x2 ratio spread with call options is created by selling one lower-strike call and buying two higher-strike calls. This strategy can be established for either a net credit or for a net debit, depending on the time to expiration, the percentage distance between the strike prices and the level of volatility.

    By TrustyJules,

    • 0 comments
    • 5,099 views

  • Upvote 1
  Report Article

We want to hear from you!


Great Article.  For these examples am I assuming correctly that...

* an ATM put is bought each week regardless of market? 

* Each put is sold weekly if it's up?

* If a put is down it is held until break even or better, no new put is bought until the old is sold?

* What is the recommended life for the new puts being sold?  

Share this comment


Link to comment
Share on other sites

Hi Crazy,

First, the article illustrated an ATM put being SOLD, not bought. But, I think that's what you meant, anyway.

The puts can be sold weekly, monthly or at whatever interval one wants. I sell them with weekly expirations and roll anew each week. Some might find it less troublesome to trade less frequently. The market dictates what works bets and the market doesn't tell us its secrets.

Now, one sells the put at expiry .. not before. So, weekly is sold every week and monthly every month, etc..

If the market drops below the strike of the put, when it is rolled, at expiry, it is rolled at the same strike, until the market works its way back up. Then the put is sold ATM.

The recommended life span is every week, selling and rolling a weekly. However, some would like to do less wrk and longer durations can work just fine .. but I wouldn't sell an option more than one month out.


Whatever one chooses, the important point to remember and execute s to not abandon when the market goes down, not "run scared" .. just hold the previous strike and have patience. Sometimes your patience will be rewarded in a week, sometimes a month and sometimes a year. But his is along term strategy and it requires sticking with it. Keep in mind it is a version of "buy and hold", except the "buy" is a put-write.


Share this comment


Link to comment
Share on other sites

Thanks Ken,

Yes, I meant sell a put, not buy.  

Do you have a standard day Monday/Friday that you sell the weekly puts?

If you have a significant gain mid week, do you set a price target to get out early, or hold them until expiry regardless?

Share this comment


Link to comment
Share on other sites

The roll is usually done on expiration Friday by closing the short puts and opening the next week short puts. Or you can do it couple days before expiration if thee is very little time value left.

Share this comment


Link to comment
Share on other sites
On 11/3/2018 at 1:01 PM, Reel Ken said:

If the market drops below the strike of the put, when it is rolled, at expiry, it is rolled at the same strike, until the market works its way back up. Then the put is sold ATM.

I understand that it’s a bad idea to roll out and down if it has to be done for a debit, as this basically locks in intrinsic losses that can’t be recovered. But if there’s an opportunity to roll out and down one or two strikes (maybe not to ATM, but nearer to the money) for a net credit, is there a compelling reason not to do that? As long as it’s for a net credit, it increases the total extrinsic value received and doesn’t create an intrinsic loss. It also moves down the price above which the market needs to move to bring the trade back into positive territory. 

I know it’s not always possible to roll out a single week and down for a credit, but it’s often possible to do so if you go out two weeks. Since this is a longer-term process (as you said, it can take months or weeks to recover from a big drop in the underlying), why not take an extra week of risk if you can lower your strike for a credit?

Even during the big drop in October, I was able to do this with a put on QQQ for a credit without going out more than two weeks. I know the increase in IV helped make this possible, but if IV is lower, and thus premiums are lower, then aren’t you less likely to be in this situation in the first place (because low IV means there hasn’t been a big price drop recently)?

The main concern for me with not rolling down is the potential for early exercise if the put gets too far ITM. I understand this isn’t a concern if you’re trading SPX options, since they’re European-style and can’t be exercised early. But for SPY, if you keep holding a strike that’s deeply underwater, the put may get exercised prior to expiration unexpectedly, and then you’re guaranteed a big intrinsic loss, no? Pushing things out a week or two and down a strike or two, for a credit, would seem to substantially decrease the risk of early exercise. Or am I missing something?

Edited by Azov

Share this comment


Link to comment
Share on other sites

Hi Azov

One makes judgments and wins or loses ... so there is no absolute answer.


Rolling out a few weeks can work .. here's another option....


On a big drop, the likelihood of a bounce of more than 3% is slim. Additionally, most big bounces occur within a few weeks of a big drop,

So, one should be willing to sacrifice extrinsic for the first couple of weeks after a big drop and "hold". But, if the drop was, say 5%, one could go 3% ITM rather than hold and play favorable percentages.

After a few weeks, if he bounce hasn't occurred, one can , once again, lay the odds and go 2% ITM.

Now assignment is always a potential problem with equity options. It becomes more of a problem as extrinsic disappears. But if there's no extrinsic, it's safe to toll out and garner some. But, one must be especially careful around the ex-div date as the extrinsic is illusionary relative to the dividend.


Share this comment


Link to comment
Share on other sites

Just to be clear on this, you are really selling put very deep in the money if the market drops a lot? For example in January of '18 SPY dropped 35 points, are you going to hold the strike and sell puts that are 35 points in the money? I noticed that currently puts that are 30 points in the money have a huge bid/ask spread (several dollars) and only .30 in extrinsic value.

Just wanting to make sure I understand the method here.

Share this comment


Link to comment
Share on other sites

Hi MikeCl,

On a huge drop, like we've recently seen, nothing is easy. One could lower the strike, but I would keep it 3% ITM, awaiting a bounce and keep walking it up. One has to use some judgment and hope they are right. With vol as high as it has been, 3% ITM still generates reasonable extrinsic.

It is always been my feeling that as long as fundamentals are in tact --- and they still seem to be --- recovery will come --- it's just "when" not "if".

That said, there's really no play book for what we've just seen. Historic drops and historic rises in a matter of weeks.


Share this comment


Link to comment
Share on other sites

"Hold the strike" is very interesting put write strategy. @Reel Ken what do you think, is it possible hedge this strategy without hurt the basic idea and do smaller drawdowns? maybe buy some tiny or long volatility (vxx)?

Share this comment


Link to comment
Share on other sites


Hi Tamas,

Of course one can compliment the strategy. In fact, what I've been doing is selling calls against the VIX. It is certain that the VIX is unsustainable at 40 and will come down. It's just a question of when. So, as long as one is able to stay yje course and hold the strike against the VIX on a surge, it's about as certain a winner as there can be. Patience is  the key.


Reelken


Share this comment


Link to comment
Share on other sites
Guest Mike

Posted

Interesting article. I'm wondering how the 'hold the strike' strategy handles assignment. Do you avoid assignment altogether by closing at a loss near expiration or maybe write covered calls at the 'hold strike' price with the assigned shares?

Share this comment


Link to comment
Share on other sites
1 minute ago, Guest Mike said:

Interesting article. I'm wondering how the 'hold the strike' strategy handles assignment. Do you avoid assignment altogether by closing at a loss near expiration or maybe write covered calls at the 'hold strike' price with the assigned shares?

You can always roll when time value becomes very small and not wait for assignment. If you are assigned when there is still more than 5-10 cents of time value, it's actually a gift - just close the share and sell the following month puts.

Also, for bigger accounts, SPX can be used instead of SPY to avoid assignment risk.

Share this comment


Link to comment
Share on other sites

Lets say - you sold ATM 290 put weekly - next friday market crashed to 220 ( it is rear but possible , see march 2020) you are in debit - 50 x100 = -5000 , you are holding the strike and rolling to next week 290 you got credit 5000 but almost no time value -  what if the market in prolong decline - this strategy will bring you to financial ruin , unless you got huge account, at the end you have to  take your losses

Share this comment


Link to comment
Share on other sites
1 minute ago, Peter from Richmond Hill said:

Lets say - you sold ATM 290 put weekly - next friday market crashed to 220 ( it is rear but possible , see march 2020) you are in debit - 50 x100 = -5000 , you are holding the strike and rolling to next week 290 you got credit 5000 but almost no time value -  what if the market in prolong decline - this strategy will bring you to financial ruin , unless you got huge account, at the end you have to  take your losses

Yes, but your loss is still less than just holding SPY. As long as your position sizing is okay (number of contracts equal to number of shares x 100 of SPY) it should perform no worse than just holding SPY.

Share this comment


Link to comment
Share on other sites

Interesting article. 

I am thinking that this outperformance of the hold strategy vs SPY is enough to include a long 1 year out put ( 5% OTM) , similar to the Anchor Strategy. And still make spy returns while being hedged 

Does this make sense? 

Share this comment


Link to comment
Share on other sites

@Kim A question I asked already on the Anchor Trades forum, but @cwelsh still seems to be in the back test phase with this.

Is XSP a better alternative  instead of SPY  for Holding ATM strategy because of 

1. Same margin requirements  (Smaller portfolio's)

2. No assignment risk!!!


Edited by Windeon

Share this comment


Link to comment
Share on other sites

Yes, @Jesseis actually using XSP for the momentum portfolio. Should be fine, and no assignment risk is a big advantage. Liquidity is not as good as SPY (very few products can compete with SPY in terms of liquidity), but still very good.

Share this comment


Link to comment
Share on other sites
8 hours ago, Robby said:

Interesting article. 

I am thinking that this outperformance of the hold strategy vs SPY is enough to include a long 1 year out put ( 5% OTM) , similar to the Anchor Strategy. And still make spy returns while being hedged 

Does this make sense? 


5 minutes ago, Kim said:

Yes, @Jesseis actually using XSP for the momentum portfolio. Should be fine, and no assignment risk is a big advantage. Liquidity is not as good as SPY (very few products can compete with SPY in terms of liquidity), but still very good.

@Kim Thank you 

One other question: In this diagonal set-up, to which strike and when it is best to roll the Long Put @ expiration time if your short put of the last week/month is still deep ITM. Do you hold the original strike price or roll it to the 5% below the future strike price?

Share this comment


Link to comment
Share on other sites
On 12/26/2020 at 7:54 AM, Robby said:

Interesting article. 

I am thinking that this outperformance of the hold strategy vs SPY is enough to include a long 1 year out put ( 5% OTM) , similar to the Anchor Strategy. And still make spy returns while being hedged 

Does this make sense? 


19 hours ago, Kim said:

Yes, @Jesseis actually using XSP for the momentum portfolio. Should be fine, and no assignment risk is a big advantage. Liquidity is not as good as SPY (very few products can compete with SPY in terms of liquidity), but still very good.

@Kim Thank you 

One other question: In this diagonal set-up, to which strike and when it is best to roll the Long Put @ expiration time if your short put of the last week/month is still deep ITM. Do you hold the original strike price or roll it to the 5% below the future strike price?

19 hours ago, Kim said:

According to Reel, we always roll to the same strike. 

THE GOOD??

I back tested Reel's theory  starting the 27th of Dec 2019 ending 18 Dec 2020on ONE using as start a 3 Jan 2020 Delta 20 short put and a Long put 1 year out 5% below the strike price of the Delta 20 put and held the strike in times of Sorrow which, as you can imagine, were many this year. Rolling  to Delta 20 weekly when price above the last short put strike price. Is this result for real? Used only XPS

HOLDING THE STRIKE.jpg

Edited by Windeon
additional comment

Share this comment


Link to comment
Share on other sites
29 minutes ago, Windeon said:


@Kim Thank you 

One other question: In this diagonal set-up, to which strike and when it is best to roll the Long Put @ expiration time if your short put of the last week/month is still deep ITM. Do you hold the original strike price or roll it to the 5% below the future strike price?

I back tested Reel's theory  starting the 27th of Dec 2019 ending 18 Dec 2020on ONE using as start a 3 Jan 2020 Delta 20 short put and a Long put 1 year out 5% below the strike price of the Delta 20 put and held the strike in times of sorrow. Rolling  to Delta 20 weekly when price above the last short put strike price. Is this result for real? Used only XPS

HOLDING THE STRIKE.jpg

Well, I just did a quick calculation. Your long put initial cost was around $1,300. Selling 20 delta puts provided you initially around $150 credit, after volatility spike in March you would get around $300-400 credit. Holding the strike means that all short put rolls were done for a credit. Of course during down times the credit was very small, but still.

Now, your chart shows $2,783 gains. The long put expired worthless, so to get to this gain, your short puts had to bring total credits of over $4,000, or $333 per month. Sounds a bit high, considering that during down months the credit was very low, but not completely unreasonable. I will try to do the same backtesting later.

Share this comment


Link to comment
Share on other sites

@Kim The profit is on the absolute risk, which was according to ONE $3651 and not on the price paid for the diagonal

absolute risk delta 20 test.jpg

THE GOOD.jpg

Edited by Windeon
wrong picture

Share this comment


Link to comment
Share on other sites

When testing I saw Deltas of 60+ and losses of  > 50% passing by when holding the strike. I assume that by holding the strike  you receive a lot of credit from your roll which will lessen your overall loss, together with the workings of the long put in your favor in down times. Is this correct?

Edited by Windeon

Share this comment


Link to comment
Share on other sites

So first, it would not be correct to measure the gains as return margin/risk - the risk could be much higher than estimated. The correct measurement would be return on "notional exposure", not margin (this is the number of contracts we would trade). In our case it's around $33,000. So assuming your numbers are correct, we get return of less than 10%, not 77%.

To answer your question - yes, the advantage of "holding the strike" is that we never realize a loss, so we do much better during the recovery. The disadvantage is that we get much less extrinsic value (close to zero in fact after a big selloff), and if the recovery takes many months, then selling ATM or OTM strikes would be better.


Share this comment


Link to comment
Share on other sites

@Kim I'm a little confused. I understand the notional exposure of around $33,000. But how much money do you need in  an account to place this trade. Does the long put have no effect on the margin impact? If you do not need $33K in your account, why do you have to measure your profit/loss against $33K if you never had it? What am I seeing wrong?

Edited by Windeon
TYPO

Share this comment


Link to comment
Share on other sites

It's a matter of how much risk you are willing to take. The initial margin is around $3k, but it grows significantly as the underlying goes down. Yes, the long puts have an impact, but according to ONE, the margin reaches around $15k at some point. So if you did it while having only $3k in your account (initial margin), you would get a margin call very quickly. 

When selling naked puts, the conservative approach is to have x1 notional exposure. If you want to be really aggressive, maybe x2, but no more. Too many traders blew their accounts by having too much leverage.

Share this comment


Link to comment
Share on other sites

Thanks for this excellent article that I have just seen. As I understand, if the underlying price finishes above our sold strike, our next put sale is at the new higher ATM strike. We didn't make any gains on the way up for the distance between the old and new sold strikes and yet, after the new put sale, we are exposed to losses in that range.

I was wondering whether there is anything we should/could try to do before expiry to capture some of the available gains when the underlying price first goes up through our original sold strike?

Share this comment


Link to comment
Share on other sites

I don't know if @Reel Ken is still following this article, so I will try to answer.

First, you are correct that big swings are the main enemy of this strategy. You catch most of the losses on the way down, but only small part of the gains on the way up.

What we can do?

First, we can roll early and not wait to expiration. We can set a rule to roll the short puts when we can close the existing puts around 20% of their original value (for example). So if we sold at $1.00 credit, we will close at 0.20 debit.

Second, we will sell slightly ITM instead of ATM to catch more gains on the up move.

@cwelsh does both in Anchor.

Third solution would be what Reel suggests which is hold the strike, to avoid taking the loss on the way down.

Share this comment


Link to comment
Share on other sites

@Reel Ken @Kim Excellent article. I like how it was shown how "ATM" did better than SPY in bear markets, but how did "ATM Hold" do in bear markets compared to those two?

Edited by AdamH
tagged author and kim

Share this comment


Link to comment
Share on other sites


Create an account or sign in to comment

You need to be a member in order to leave a comment

Create an account

Sign up for a new account. It's easy and free!


Register a new account

Sign in

Already have an account? Sign in here.


Sign In Now

Options Trading Blogs