
As public fear escalates, demand for protection against downward shifts in the stock market increases with it. This boosts the premiums for options that can be used to hedge against downward shifts in stock prices.
While some investors invest in either stocks or options, many investors use options to hedge their stock portfolios. They look for overvalued options, so that they may sell options when the premiums of those options are expensive. The best way to determine if an option premium is overvalued is to analyze implied volatility.
What is Implied Volatility?
Let’s say you have a call option. When you hold a call option, you have the right (but not the obligation) to buy a security at a specific strike price on or before its expiration date. The value of this option is determined by the probability that the call option will be in the money by the time it reaches its expiration date.
To determine the likelihood that an option will be in the money before the expiration date, you need to figure out how quickly it will move in the right direction. But how do you do that?
Option traders, like Warren Buffett, turn to implied volatility. Implied volatility is a measure of how much market participants believe the price of a security will move over a specific period on an annualized basis. It’s typically represented as a percentage.
An implied volatility of 20% means that traders estimate a security will move up or down 20% from its current position over the next 12 months. To determine the premium, or price, of an option, you could use an option pricing model. The most famous is the Black Scholes option pricing model. There are several inputs, but the most crucial is implied volatility.
How Do You Measure Implied Volatility?
There are a few ways to measure implied volatility—but the easiest way is to evaluate an available index of implied volatility.
You can chart implied volatility on several instruments including the VIX volatility index. Additionally, you can use technical analysis tools such as Bollinger bands and the RSI to help you decide of the value of implied volatility is rich or cheap.
The VIX volatility index, which is calculated by the Chicago Board of Options Exchange (CBOE), lists the implied volatility of the “at the money” calls and puts on the S&P 500 index. The VIX reports how far traders believe the S&P 500 will move over the course of the next year.
The CBOE produces many different VIX indexes. There is a VIX on Apple shares and a VIX on crude oil. By charting the VIX, you’ll be able to determine whether implied volatility is rich or cheap.
How Do You Know When Implied Volatility is Rich?
When implied volatility is high, or “rich,” option prices are overvalued. This attract investors like Buffett. This is when you want to sell options.
You can determine how rich volatility is by using technical analysis tools like Bollinger bands or the Relative Strength index. When the value of the VIX moves up to unsustainable levels, you’ve reached a trigger point. This is where you should look to sell options.
Bollinger bands are a technical analysis tool that measure a 2-standard deviation range around a moving average.
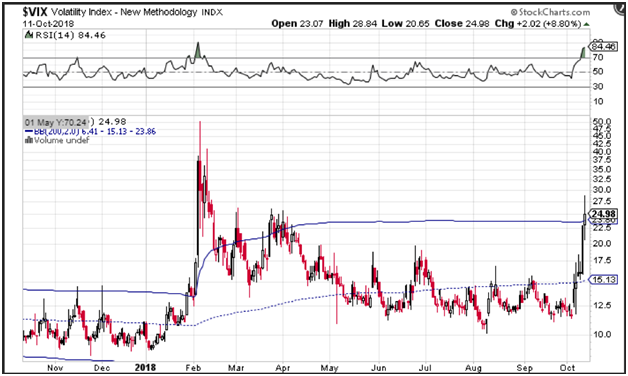
The chart of the VIX shows that the VIX shot above the Bollinger band high in early October, which was calculated using a 200-day moving average. This also happened in March and February of 2018. When the VIX crosses above the Bollinger band’s high, it’s likely to revert back to the mean. But before it returns, you can attempt to sell an option. You can use several different moving averages to determine if the value of the VIX volatility index is high. It all depends on your time horizon.
A second technical analysis gauge you can use to determine if implied volatility is rich is the relative strength index (RSI). This is a momentum oscillator that measures accelerating and decelerating momentum along with overbought and oversold levels. When the RSI moves above 70, the value of the security is overbought and will likely correct itself. In early October the VIX hit an RSI reading of 84, well above the overbought trigger level of 70—meaning the volatility was rich.
There are other tools that you can use to measure implied volatility. There are vendors that provide historical charts of implied volatility on individual stocks. You can use the same type of technical analysis tools to determine whether the implied volatility on these shares are rich or cheap.
When Should I Check Implied Volatility?
You can use implied volatility as a confirmation indicator or a trigger. The process goes as follows:
Once you find a stock that you believe is undervalued, you might consider selling a naked put below the current stock price.
You would then check the stock to see if current implied volatility is elevated and use that to determine whether or not selling an option on that stock is worthwhile. Alternatively, you can use implied volatility as a trigger. In this case, you could scan for implied volatility levels on stock prices where the Bollinger band’s high has been breached or the RSI is above the 70 overbought trigger level.
You can then find a level that would make selling a naked put or a covered call attractive.
A Final Message
The best options strategies are income producing option trading strategies. These include popular trading strategies, such as covered call and naked put trading. It does not matter if you are selling a naked put or employing a covered call strategy, you want to sell options when premiums are overvalued.


Join the conversation
You can post now and register later. If you have an account, sign in now to post with your account.
Note: Your post will require moderator approval before it will be visible.