SteadyOptions is an options trading forum where you can find solutions from top options traders. Join Us!

We’ve all been there… researching options strategies and unable to find the answers we’re looking for. SteadyOptions has your solution.

Predicting Probabilities in Options Trading: A Deep Dive into Advanced Methods


In options trading, the focus should not be on predicting the exact closing price of a ticker on a given date - a near-impossible task given the pseudo-random nature of markets. Instead, we aim to estimate probabilities: the likelihood of a ticker being above a specific value at a certain point in time. This perspective turns trading into a probabilistic exercise, leveraging historical data to make informed decisions.

While the past cannot guarantee future outcomes, it remains our most reliable resource for understanding market behavior. Previously, I outlined how Monte Carlo simulations can be used to estimate these probabilities. But relying solely on one method is limiting. Diversifying the ways we calculate probabilities adds robustness to the analysis.


In this article, I will delve deeply into three additional methods for calculating probabilities: Hidden Markov Models (HMM), seasonality-based probabilities, and implied probabilities derived from options prices. Each method has distinct advantages and complements the Monte Carlo approach, providing a comprehensive framework for assessing Credit Put Spreads.


1. Hidden Markov Models (HMM): Unveiling Hidden Market Dynamics

Hidden Markov Models (HMM) are a sophisticated machine learning technique designed to analyze time-series data. They operate on the assumption that observed data (e.g., ticker prices) are generated by an underlying set of "hidden states" that cannot be directly observed. These states represent distinct market conditions, such as bullish trends, bearish trends, or periods of low volatility.


How HMM Works

  1. Defining Observations and States:
    • The observed data in this context are the historical closing prices of the ticker.
    • The hidden states are abstract conditions influencing price movements. For example:
      • State 1 (Bullish): Higher probabilities of upward price movements.
      • State 2 (Bearish): Higher probabilities of downward price movements.
      • State 3 (Neutral): Limited price movement or consolidation.
         
  2. Training the Model:
    • The HMM is trained on historical price data to learn the transition probabilities between states and the likelihood of observing specific price changes within each state.
    • For example, the model might learn that a bullish state is likely to transition to a neutral state 30% of the time, and remain bullish 70% of the time.
       
  3. Making Predictions:
    • Once trained, the HMM can estimate the current state of the market and use this information to predict future price movements.
    • It calculates the probability of the ticker being above a specific threshold on a given date by analyzing likely state transitions and their associated price changes.
       

Advantages of HMM in Options Trading

  • Pattern Recognition: HMM excels at identifying non-linear patterns in price movements, which are often overlooked by simpler models.
  • Dynamic Analysis: Unlike static models, HMM adapts to changing market conditions by incorporating state transitions.
  • Probability Estimation: For a Credit Put Spread, HMM provides a probabilistic measure of whether the underlying will remain above the short strike based on historical market behavior.

By capturing hidden dynamics, HMM offers a more nuanced view of market probabilities, making it a valuable tool for assessing risk and reward in Credit Put Spreads.


2. Seasonality-Based Probabilities: Unlocking Historical Patterns

Seasonality refers to recurring patterns in price movements influenced by factors such as economic cycles, investor behavior, or external events. In options trading, seasonality-based probabilities quantify how often a ticker's price has exceeded a certain percentage of its current value over a specific time horizon.


How to Calculate Seasonality-Based Probabilities

  1. Define the Threshold:
    • The threshold is expressed as a percentage relative to the current price (e.g., -2%, +0%, +2%). This normalization ensures the probability calculation is independent of the absolute price level.
       
  2. Analyze Historical Data:
    • For a given holding period (e.g., 30 days), calculate the percentage change in price for each historical observation.
    • Example: If the current price is $100, and the threshold is +2%, count how often the price exceeded $102 after 30 days in the historical data.
       
  3. Aggregate the Results:
    • Divide the number of times the threshold was exceeded by the total number of observations to calculate the probability.
    • Example: If the price exceeded the threshold in 70 out of 100 instances, the probability is 70%.
       

Applications in Credit Put Spreads

Seasonality-based probabilities answer the question: "In similar conditions, how often has this ticker remained above the breakeven?" This approach is particularly useful for ETFs, which often exhibit more predictable patterns than individual stocks. For example, certain sectors might perform better during specific times of the year, providing an additional layer of insight.
 

Limitations to Consider

  • Seasonality probabilities rely entirely on historical data and assume that past patterns will persist. While this is often true for ETFs, it may be less reliable for individual stocks or during periods of market disruption.


3. Implied Probabilities from Options Prices: Extracting Market Sentiment

Options prices are more than just numbers; they encapsulate the collective beliefs of market participants about future price movements. By analyzing the prices of puts and calls across various strikes for a given expiration date, we can derive the implied probabilities of the ticker being in specific price ranges.
 

Steps to Calculate Implied Probabilities

  1. Collect Options Data:
    • Obtain the bid-ask prices for puts and calls at different strike prices for the desired expiration date.
  2. Calculate Implied Volatility:
    • Use the options prices to derive the implied volatility (IV) for each strike. IV reflects the market's expectations of future price volatility.
  3. Estimate Probabilities:
    • For each strike, calculate the probability of the ticker being at or above that level by using IV and the Black-Scholes model (or similar methods).
    • The probabilities are then aggregated to construct a distribution of expected prices at expiration.
       

Why Implied Probabilities Matter

  • Market Consensus: Implied probabilities reflect what the market "thinks" about the future, offering a forward-looking perspective.
  • Dynamic Adjustments: Unlike historical methods, implied probabilities adapt in real-time to changes in market sentiment, such as news events or macroeconomic data.
     

Application to Credit Put Spreads

For a Credit Put Spread, implied probabilities can answer questions such as: "What is the market-implied likelihood that the ticker will remain above the short strike?" This insight helps traders align their strategies with prevailing market sentiment.


Conclusion

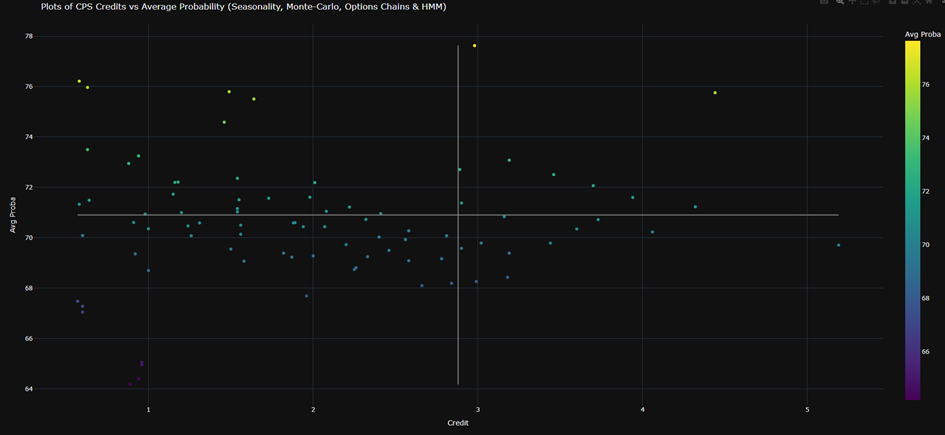
By integrating these three methods—Hidden Markov Models, seasonality-based probabilities, and implied probabilities from options prices—into my existing Monte Carlo framework, I’ve developed a robust system for evaluating Credit Put Spreads. This approach enables a comprehensive analysis of Out-of-the-Money (OTM) Credit Put Spreads among a selection of ETFs, filtering for:

  • Gain/loss ratios within specific thresholds,
  • Expiration dates within a defined range,
  • A minimum credit of $0.50.
     

The result is what I like to call a “stellar map” of selected spreads:

image.png


accompanied by a summary table:

image.png

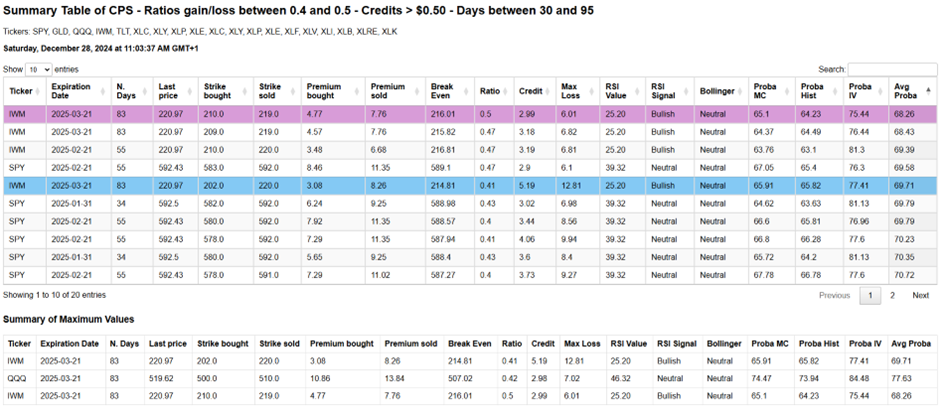
These tools provide clarity and actionable insights, helping traders identify the best trades—those offering the highest probability of success while maximizing potential returns relative to risk.
 

Looking ahead, the next step will involve calculating the expected value ($EV) of these trades, combining probabilities and potential outcomes to further refine the selection process.


The ultimate goal remains the same: to stack the odds in our favor—not by predicting exact prices, but by estimating probabilities with precision and rigor.


Stay tuned as I continue refining these methods and expanding their applications! 

What Is SteadyOptions?

12 Years CAGR of 123.5%

Full Trading Plan

Complete Portfolio Approach

Real-time trade sharing: entry, exit, and adjustments

Diversified Options Strategies

Exclusive Community Forum

Steady And Consistent Gains

High Quality Education

Risk Management, Portfolio Size

Performance based on real fills

Subscribe to SteadyOptions now and experience the full power of options trading!
Subscribe

Non-directional Options Strategies

10-15 trade Ideas Per Month

Targets 5-7% Monthly Net Return

Visit our Education Center

Recent Articles

Articles

  • Diversification Dos And Don'ts

    It’s one of the golden rules of stock trading: ‘don’t put all your eggs in one basket’. More formally known as ‘diversification’. By spreading your funds among several stocks, you help spread the risk. But is stock market success really as simple as that? As with many things in life, the devil is in the details.

    By Kim,

    • 0 comments
    • 7,640 views
  • Predicting Probabilities in Options Trading: A Deep Dive into Advanced Methods

    In options trading, the focus should not be on predicting the exact closing price of a ticker on a given date - a near-impossible task given the pseudo-random nature of markets. Instead, we aim to estimate probabilities: the likelihood of a ticker being above a specific value at a certain point in time. This perspective turns trading into a probabilistic exercise, leveraging historical data to make informed decisions.

    By Romuald,

    • 1 comment
    • 7,449 views
  • SteadyOptions 2024 - Year in Review

    2024 marks our 13th year as a public trading service. We closed 136 winners out of 187 trades (72.7% winning ratio). Our model portfolio produced 116.7% compounded gain on the whole account based on 10% allocation per trade. We had only one losing month (of 0.6% loss) in 2024. 

    By Kim,

    • 0 comments
    • 1,248 views
  • The 7 Most Popular Cryptocurrencies Right Now

    There are thought to be 20,000 cryptocurrencies currently in existence. While a lot of these are inactive or discontinued, a lot of them are still being traded on a daily basis. But just which cryptocurrencies are most popular? This post takes a look at the top 7 most traded cryptocurrencies.

    By Kim,

    • 0 comments
    • 7,906 views
  • Harnessing Monte Carlo Simulations for Options Trading: A Strategic Approach

    In the world of options trading, one of the greatest challenges is determining future price ranges with enough accuracy to structure profitable trades. One method traders can leverage to enhance these predictions is Monte Carlo simulations, a powerful statistical tool that allows for the projection of a stock or ETF's future price distribution based on historical data.

    By Romuald,

    • 10 comments
    • 11,850 views
  • Is There Such A Thing As Risk-Management Within Crypto Trading?

    Any trader looking to build reliable long-term wealth is best off avoiding cryptocurrency. At least, this is a message that the experts have been touting since crypto entered the trading sphere and, in many ways, they aren’t wrong. The volatile nature of cryptocurrencies alone places them very much in the red danger zone of high-risk investments.

    By Kim,

    • 0 comments
    • 5,673 views
  • Is There A ‘Free Lunch’ In Options?


    In olden times, alchemists would search for the philosopher’s stone, the material that would turn other materials into gold. Option traders likewise sometimes overtly, sometimes secretly hope to find something which is even sweeter than being able to play video games for money with Moincoins, that most elusive of all option positions: the risk free trade with guaranteed positive outcome.

    By TrustyJules,

    • 1 comment
    • 18,574 views
  • What Are Covered Calls And How Do They Work?

    A covered call is an options trading strategy where an investor holds a long position in an asset (most usually an equity) and sells call options on that same asset. This strategy can generate additional income from the premium received for selling the call options.

    By Kim,

    • 0 comments
    • 3,709 views
  • SPX Options vs. SPY Options: Which Should I Trade?

    Trading options on the S&P 500 is a popular way to make money on the index. There are several ways traders use this index, but two of the most popular are to trade options on SPX or SPY. One key difference between the two is that SPX options are based on the index, while SPY options are based on an exchange-traded fund (ETF) that tracks the index.

    By Mark Wolfinger,

    • 0 comments
    • 10,130 views
  • Yes, We Are Playing Not to Lose!

    There are many trading quotes from different traders/investors, but this one is one of my favorites: “In trading/investing it's not about how much you make, but how much you don't lose" - Bernard Baruch. At SteadyOptions, this has been one of our major goals in the last 12 years.

    By Kim,

    • 0 comments
    • 5,177 views

  • Like 1
  Report Article

We want to hear from you!


Good article, glad to see improvements of the previous method (use static historical price-distribution to predict future price movement).

A few comments:

  • HMM, MC, seasonality, etc are all feature values of the final model to predict SPY/QQQ future prices, but these techniques are complicated, non-trivial to maintain and costly to adjust the hyper-params. Using a neural network (NN) model (which is an end-to-end approach) can cover all these features, and if trained correctly, will outperform the model based on those manual-collected features. That's why NN dominated all the AI areas in recent years.
  • Another important factor is hard to get baked in into price prediction model -- the critical events (e.g. econ releases, Fed rate decision, huge SPY drops caused by M7 company fiscal report crash -- happened several times for NVDA alone). Yes, Implied Vol can help with this, but mostly it can only predict the date of the critical event (e.g. Fed rate decision), but not the range -- the range is completely unknown unless someone has insider info.

In sum, I think combining a price prediction model with credit spreads can work if traded adequate times, but the variance could be high. For this reason, this method is suitable for auto/robot trading, where the program keeps calculating and detecting an opportunity and execute the trade in time.


An alternation of this framework is to use the program to scan and find out the odd option prices (that can form a favorable credit spread) using advanced techniques, suggesting human the "optimal" credit spread setups at the current time. Then the trader can review and make decision based on the knowledge of critical events (or macro econ situations). The program can also calculate SPY price predictions, but just as a signal for trader's reference.

For example, the program will read in the current SPY option chain prices, and find out which credit PUT spreads (strikes, DTEs) have the optimal credit with OTM degree considered (a model could be used to get a balance). Then, if the trader feels there could a chance (e.g. a critical event is set ahead, or the SPY is already dropping fast, e.g. in recently weeks as Trump tariffs coming), they could review the suggested "optimal" credit spread setups and decide if they want to trade any of those. From my experience, when SPY is dropping fast (VIX is high), there are many expensive credit spreads with very far OTM -- finding out the optimal one or two from those definitely needs a program to scan a lot of prices -- and therefore giving the trader an edge.


Share this comment


Link to comment
Share on other sites


Create an account or sign in to comment

You need to be a member in order to leave a comment

Create an account

Sign up for a new account. It's easy and free!


Register a new account

Sign in

Already have an account? Sign in here.


Sign In Now

Options Trading Blogs