
Despite cheaper brokers trading fees remain an issue and the lack of large capital excludes arbitrage or strategies heavy on margin. The retail trader is not defenceless in the face of this massive financial world – his key advantage is that he trades small volumes. This means that on most instruments execution is fast and on excellent prices. The retail investor can therefore focus on events like earnings, option expiries and construct strategies that make us of gaps that cannot be exploited by the professional investor. Augen – and he is not alone in studying the phenomenon – points to the strange concept of pinning as a potentially exploitable event for the retail trader. This article examines some of his ideas and places them in the context of today where the markets have changed somewhat from the time he wrote his books.
What is Option Pinning Actually?
The subject has been the subject of extensive learned academic research which will not be repeated here. In essence it is the phenomenon that certain stocks gravitate towards the strike price of an option on the Friday of the expiry of that option. This simple visual sets in greater clarity what is meant than any long winded explanation:
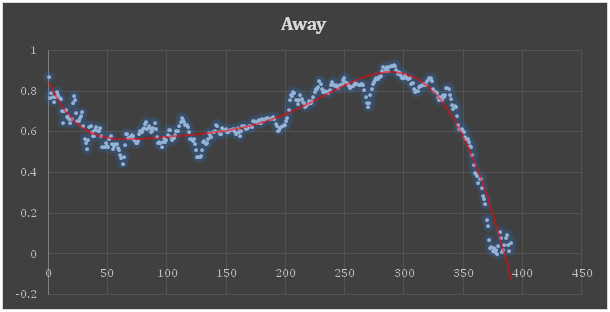
Figure 1: APPLE 17 March 2017 Expiry
The Y-axis is in dollars representing the amount that the stock was trading away from a strike price. The X-axis represents the number of minutes since trading started (a total of 390 minutes). The ‘gravity pull’ of the option strike price usually starts gaining in strength around 15.15 PM just about 350 minutes into trading and has its apex 15 minutes before the bell. These are approximations as you will see there are many ways in which a stock pins.
The figure given here is particularly clear and should be taken as an extreme example. To get an idea of how extreme the case is – here is a different way of looking at the same chart but now with bars marking the times that the stock crossed the strike price:
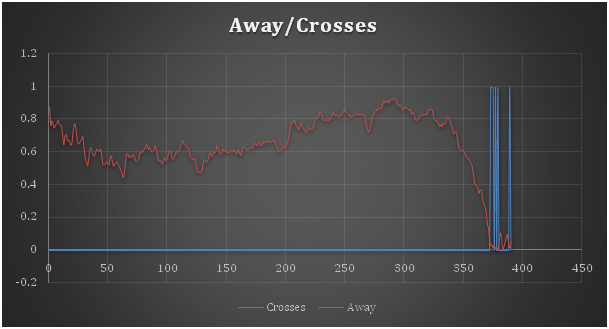
Figure 2 Apple 17 March 2017 – Crosses
The stock basically traded freely for most of the day and in the last half hour was drawn to the strike where it then hovered over or under in the last minutes of trading.
How to exploit pinning?
The option strategy
There are a number of ways in which pinning can be exploited, in the interest of brevity this article restricts itself to the following strategy (note that this was for analysis purposes and is not a trading recommendation – it can be obvious the pinning strike would be elsewhere):
- Opening the position between 12-12.30 when there is a lull in trading;
- Deciding that the closest strike to the stock at that moment will be the pinning point – which we will call S (S+1 will be one strike higher and S-1 a strike lower)
-
Opening a position that looks like this:
o OB 1 C @ S-1
o OS 3 C @ S
o OB 2 C @ S+1 - The position is closed 10-15 mn before the bell. Some leeway needs to be allowed because the options will flip-flop in the last minutes;
- The position is never allowed to go the expiry and except in obvious cases (strikes far out of range) always closed 10-15mn ahead because pinning sometimes ‘let’s go’ in the last minutes.
The S+1 options are there to reduce margin requirements and not strictly necessary. The author usually trades in 10/30/20 and the total margin requirement will be around 1500-2000$ for Apple at the time of writing. The strategy ensures that there is a buffer upwards if the stock is higher than S and a considerable way down if the stock is lower than S. Overall it produces a broad range of profitability with excellent opportunities to decide ad hoc to close the position.
Oftentimes it’s tempting to wait till the very last minute to get the absolute best price but internet glitches, widening spreads at the close and a last minute adverse move can thwart such greedy moves. As a rule its best to take good money off the table when it presents itself as these positions can reverse fast.
What stock?
Which brings us to which stock to choose for pinning? Augen points out that highly liquid stocks are required with very liquid option positions. He points out AAPL, BBY, MA, FDX and GS. To make a long story short, whilst there is some case to be made for FDX in particular and to a lesser extent MA, the one stock that really stands out as pinning more than others is APPL.
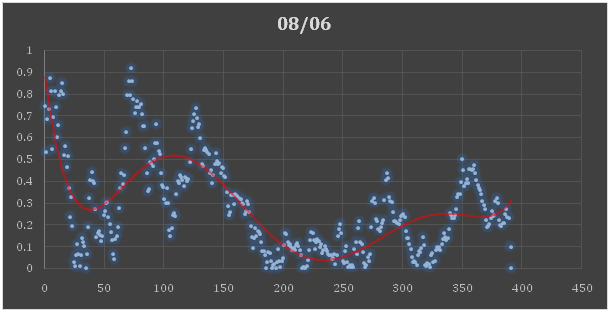
Figure 3 MA expiry 8th June 2018
As one can see the MA stock pinned for half the day but gradually rose away from the strike at the end only to pin in the very last minute. This is far more difficult to exploit than AAPL. An explanation of strategies for the other stocks would be more complex and the data manipulation is not easy. It requires obtaining minute by minute O/H/L/C /V data for each stock over the period of the option expiry. This is very data intensive and rather a pain to work with.
All data used was collected by the author from public sources and pertains to 03/2017-09/2017 and 03/2018 - 03/2019. It is verified and corrected (for errors) data from a major financial institution.
Does Option Pinning Always Occur?
The first caveat of our conversation has to be this one. Does pinning always occur as Augen seems to aver or have things changed since his time? The latter point is often made by today’s criticasters of Augen judging his information to be out of date and no longer relevant. Whilst no analysis has been made of the strategy to predict pinning earlier than midday Friday, as a general rule (much depends on how much distance to the strike price is deemed a pin, for the purposes of the article 40c was deemed to be the cut off because otherwise usually it’s hard to make a buck doing a trade) one can say the following:
- Pinning as described by Augen occurs 50% of the time;
- There is a slight bias in favour of pinning on the 3rd Friday expiry compared to other Friday expiries but the difference is so small that it could be insignificant given the limited sample size of 18 months;
- When pinning fails very often (but not quite always unfortunately) the stock ‘pins’ halfway between two strike prices.
This latter point is something that Augen has not noted but that is quite apparent from the ‘failed’ classic pins that have been found in the last year. Consider the following figure:
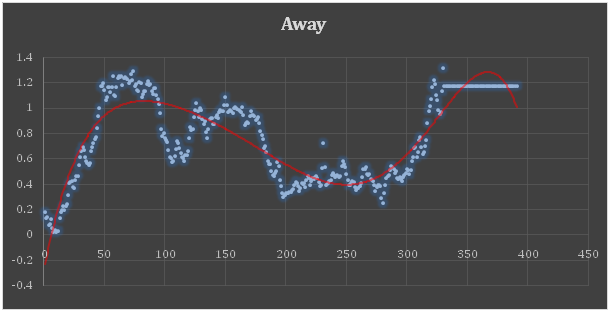
Figure 4 Apple 15th March 2019 Expiry (straight line at the end due to DST differences)
Actually the stock pinned pretty well between minute 200 and 300 – but if you opened the strategy at that moment you would have lost your shirt when the stock moved to midway between S and S+1. This phenomenon is a nuisance for the classic S-1/S/S+1 strategy proposed as the position would have lost substantial money, in the example above around 1000$ or near 75% of margin. It does not always end in disaster because for example the expiry below would have ended with a wash.
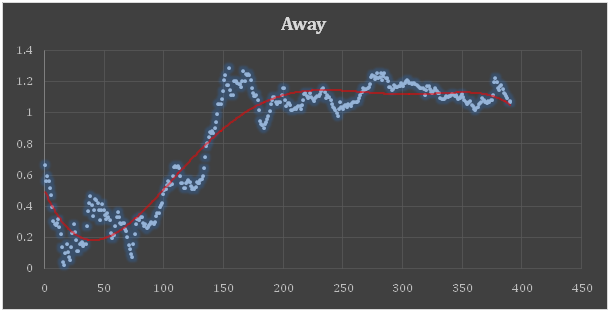
Figure 5 AAPL 5th May 2017 expiry
What’s worse is that there really seemed to be no way to predict this as the stock seemed well behaved having gravitated already towards the strike price. When the above mid-pins – for lack of a better word – occur the volume at S and S+1 even right at the bell is enormous. Whereas for the S strike price this may be expected, when normal pinning occurs the S+1 strike is usually near 0 when the bell is about to be rung and volume is minimal. A plausible conclusion – based on nothing more than empiric observation – is that pinning is occurring but that the forces driving pinning (winding and unwinding of major positions by large financial traders) have become more sophisticated.
Some more statistics
A more detailed examination of the 18 months of data examined for AAPL reveals the following:
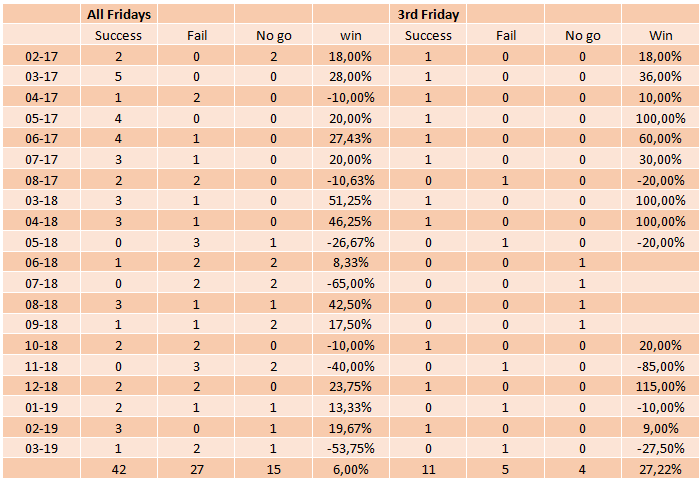
In some instances it was impossible to determine at the suggested point between 12-12.30 where the stock would go as it was midway between two strikes. In those cases it was decided not to open a position. The overall losses and profits are estimates based on the stock price and not actual back-tests. The column with the ‘all Fridays’ results seems more reliable and shows that a 6% return would have been obtained every month on average which is a very nice outcome. Nevertheless there are considerable ups and downs in the trades. The above results are not ‘twiddled’ the process of trading was mechanical even when there could have been obvious moments to bail with profit from a trade that turned unprofitable, these should be balanced out somewhat by trades that would have been stopped at a loss but that ultimately would have made money.
The psychology of playing a pinning trade
The author has tinkered around with many pinning trades over the past year and a half. As a conclusion it can be said that the psychology of the trade is very important. The positions will very frequently move very fast in good and bad directions. Here several conflicting motivations vie with each other for supremacy in the trader’s mind:
- Augen advises to aggressively stop out of losing positions. This must, however, be offset against the inevitable vagaries of market movement. A pin can occur in a yo-yo fashion as well as in the straight plunge down example given at the beginning;
- In the author’s experience all positions will trade at a loss and at a profit at least for part of their short life time. The worst thing to do is to reverse the position continually as you are then sure to be chasing the wrong movement of the next 30mn of the stock;
- By contrast opening at midday and walking away until 15mn before the end is also inadvisable because good profits can be lost and major disasters of 100% loss scale cannot be avoided in the last minutes of trading (which might have been avoided otherwise).
And so as usual fear and greed play havoc within the trader’s mind. Neither a strict discipline nor being ‘on the ball’ all the time seems to be effective. So here are a few do’s and don’ts based on experience:
- Avoid reversing/adapting positions more than once. If you got it wrong – get out regroup and don’t double down. If you do you , you will lose a LOT;
- When opening the position be patient. Paradoxically the best moment is not when the stock seems perfectly positioned at the bottom end of a daily movement on a strike (or the reverse);it is unlikely to stay there and so opening when the stock is on a daily/hourly high or low is inadvisable. It is better to do it somewhere in the middle even if the credit for the short options is less attractive;
- Take profits – the author bails at 30% profit but any reasonable target is good. The market will always have a moment where things will be better but profit is profit and what you have in the plus can be wiped out in a minute;
- Cut unacceptable losses only if it really seems hopeless. Sometimes a Trump-Tweet or something else will set the market on fire and justify intervening. Frequently however major losers turn out to be winners in the last 10 minutes. It’s nerve-wracking but necessary to sometimes sit it out and accept that a 50% loss could end in 75% when – if your pinned strike wins out eventually – could also have been a winner.
What does pinning hold in store in the future?
Pinning is alive and well – it is the strategies required to come out a winner that require studying. Augen already offered several strategies and with the mid-pin now occurring frequently some strategy to exploit it needs to be devised. Well behaved AAPL tends to trade between 2-10% away from its pinning price. FDX also pins but the spread is much broader – here is an example from April 2018:
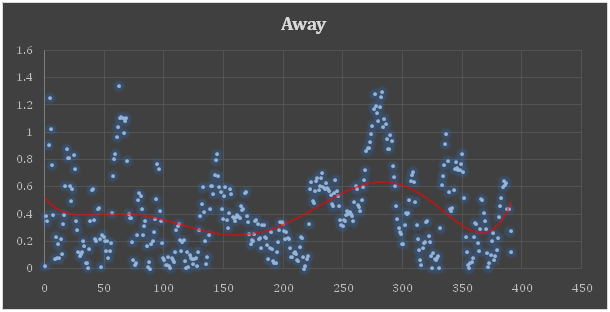
Figure 6 Fedex 19th April 2018 expiry
An active (day) trader would have seen multiple opportunities to trade FDX here as the stock moved away and then back to a strike price. The number of strike price crosses of FDX is also superior to that of AAPL. Here is the corresponding figure:
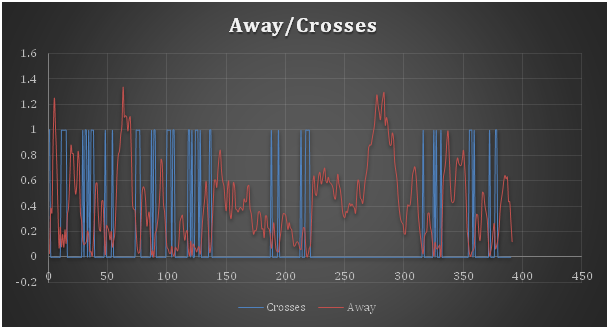
A word of warning is that the charts show when the stock converges on the strike price. If it crosses one it can be going in a straight line to the next strike price. FDX is notoriously mobile and therefore getting your strategy right at the right moment makes all the difference. It seems plausible that here too strategies can be developed that would work but it seems that every stock requires its own approach.


There are no comments to display.
Create an account or sign in to comment
You need to be a member in order to leave a comment
Create an account
Sign up for a new account. It's easy and free!
Register a new account
Sign in
Already have an account? Sign in here.
Sign In Now