SteadyOptions is an options trading forum where you can find solutions from top options traders. Join Us!

We’ve all been there… researching options strategies and unable to find the answers we’re looking for. SteadyOptions has your solution.

NKE Earnings Report June 27, 2022


Welcome to the ORATS earnings report where we scan for companies with upcoming earnings announcements, check out historical earnings information, and find a potential options trade. Read on or watch the video overview here: https://youtu.be/2mtx2ja-VwQ.

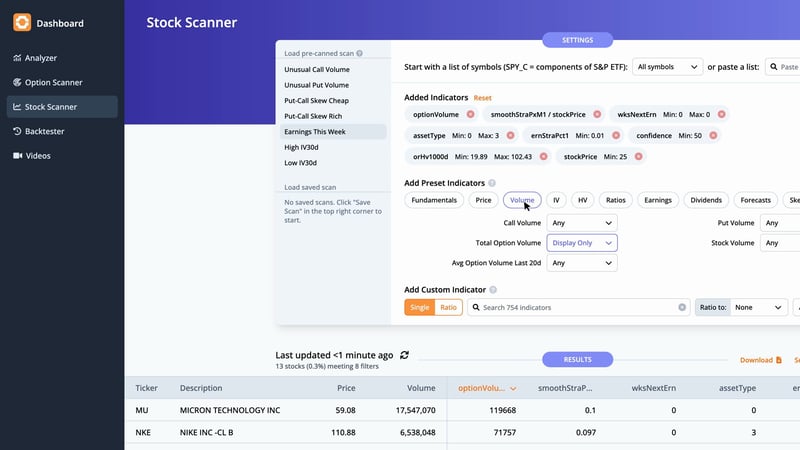
Let's start by running a scan on stocks reporting earnings this week, which includes the total option volume indicator, sorted from greatest to least.
 

HUBSPOT%20USE%20ONLY-Jun-27-2022-02-28-4


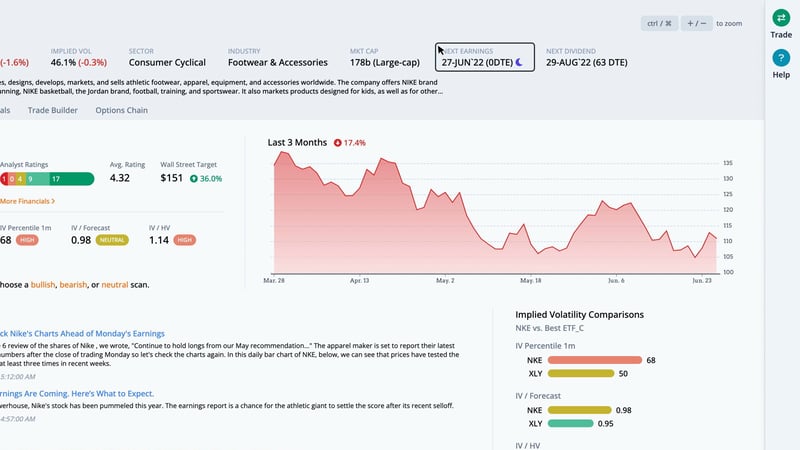
Focusing on Nike, as we click through, we see this large-cap company in the footwear and accessories industry reports earnings on Monday, June 27th, after the close.
 

HUBSPOT%20USE%20ONLY-Jun-27-2022-02-28-4


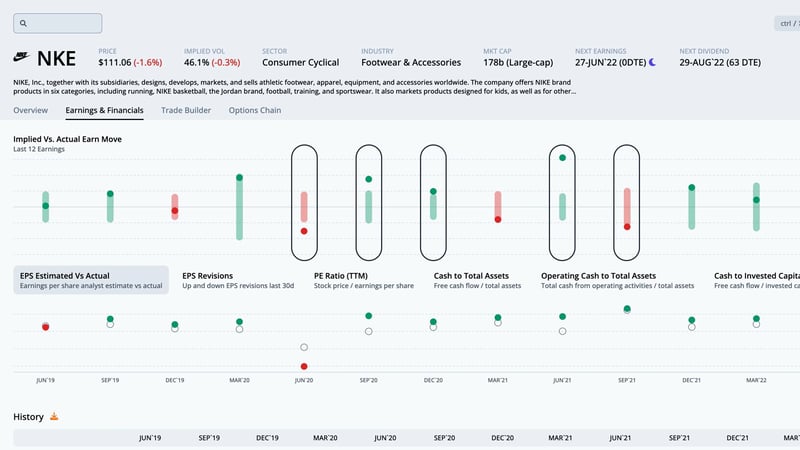
The earnings and financials tab takes us to more detail showing the options market expecting a move of 7.0% in either direction. This move was breached in 4 out of the last 12 earnings.
 

HUBSPOT%20USE%20ONLY-Jun-27-2022-02-28-4


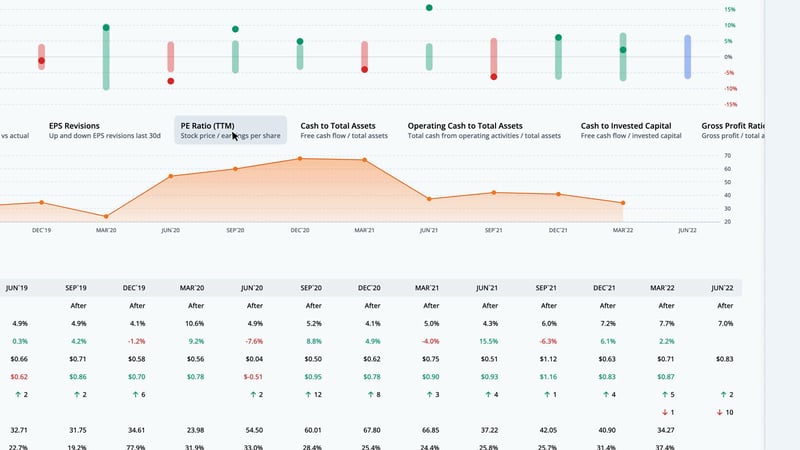
During that time, the post-earnings move was outside of the implied range 5 times. In those cases, long straddles were profitable. The rest of the earnings moves likely yielded profitable short straddles. We can overlay quarterly financial data by clicking on the ratios below the earn move graph. Let's look at the PE ratio, which is the stock price divided by the trailing twelve months earnings per share.
 

HUBSPOT%20USE%20ONLY-Jun-27-2022-02-28-5


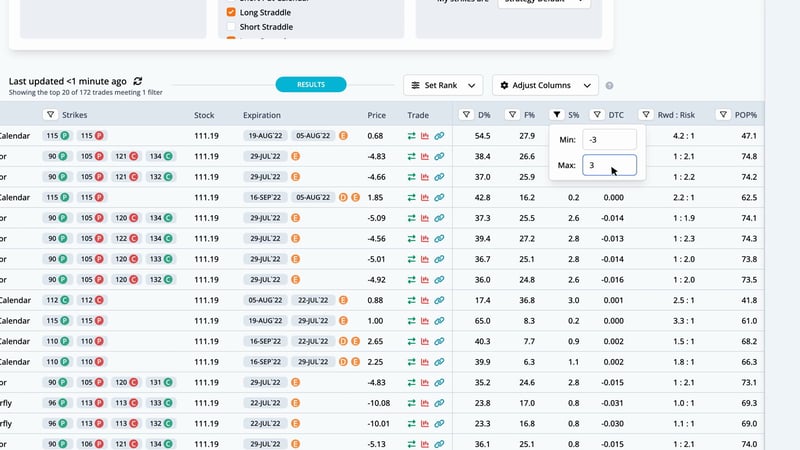
For NKE, the current PE ratio is 29.3, which is 25.8% under the average for the last twelve earnings observations. Returning to the overview tab, we can quickly run a scan to find the best option trades. Since earnings are right around the corner, we scan for neutral strategies, then filter the scan results by S%, or smoothed edge, by setting it between negative and positive 3%.
 

HUBSPOT%20USE%20ONLY-Jun-27-2022-02-28-4


This helps narrow the results to trades that are fairly priced. The highest ranked trade is a Long Put Calendar with strikes at 115, expiring on Friday, August 19th and Friday, August 5th, for a debit of $0.68.
 

HUBSPOT%20USE%20ONLY-Jun-27-2022-02-28-5


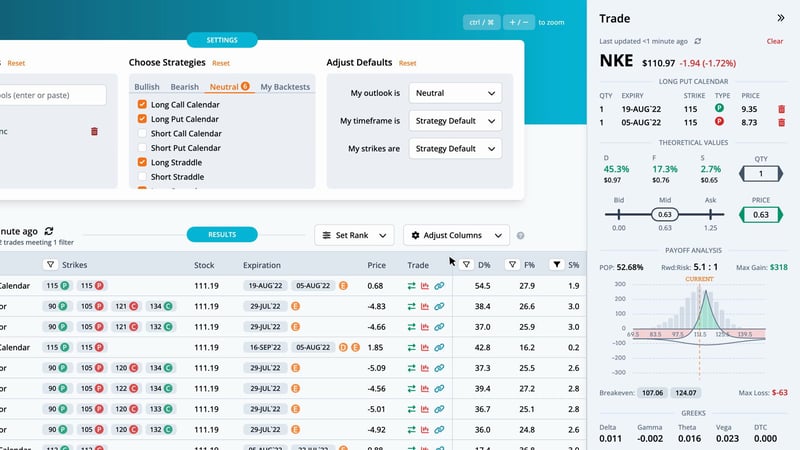
By pulling up the trade, we can see the theoretical values in more detail. The distribution edge, found by the expected value of the payoff picture on the stock's historical distribution, has an edge of 45.3%. The forecast edge, which is derived from historical volatility, has an edge of 17.3%. Lastly, the smoothed edge, which is calculated by drawing a best fit curve through the monthly implied volatilities, has an edge of 2.7%. The edge is relative to the mid-market price of the trade. Greater positive edges are a theoretical benefit to the trader. We can also look at the payoff graph.

The probability of profit sums the probability of the nodes for the part of the payoff picture above the zero profit line over three standard deviations. For this trade the probability of profit is 52.68%. The reward to risk divides the max gain by the max loss. Here the 5.1 to 1 is the ratio of the max gain of $318 to the max loss of $-63. There are two break evens for this Long Put Calendar at 107.06 and 124.07. The total Greeks and ThinkOrSwim code complete the information on the trade analysis popout.
 

HUBSPOT%20USE%20ONLY-Jun-27-2022-02-28-4


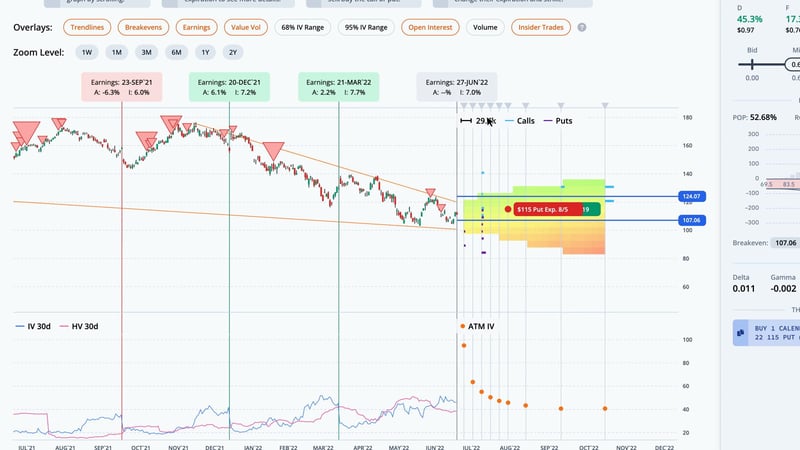
Next, let's look at this trade in the trade builder. Over the last month, the stock price fell 6.3%, while the thirty-day implied volatility rose 13.8%. The average slope of the trendlines is negative. The heatmap on the right side of the graph is green where volatility and slope are undervalued, and red where they are overvalued. In this case, short term IV and slope are neutral, while the long term is slightly overvalued.
 

HUBSPOT%20USE%20ONLY-Jun-27-2022-02-28-5


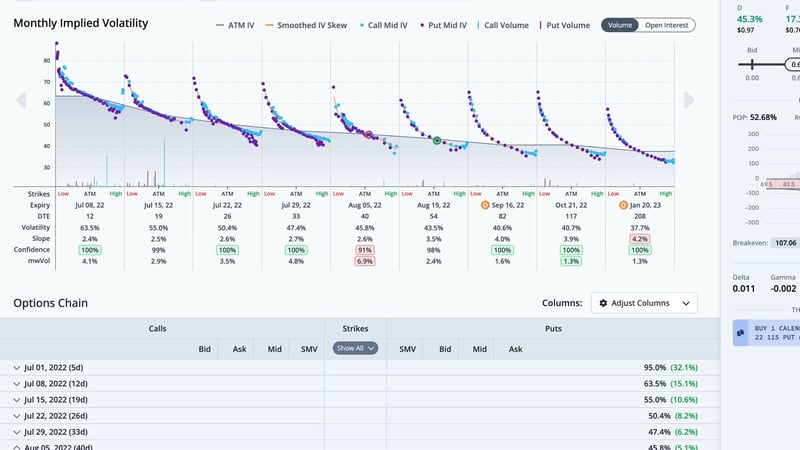
We can also see this trade overlaid on the monthly implied volatility graph in the chain tab. The legs for this trade are circled. For any questions or issues with the article, please contact otto@orats.com. To subscribe to the dashboard, please visit https://orats.com/dashboard

About the Author: Matt Amberson, Principal and Founder of Option Research & Technology Services. ORATS was born out of a need by traders to get access to more accurate and realistic option research. Matt started ORATS to support his options market making firm where he would hire statistically minded individuals, put them on the floor, and develop research to aid in trading options. He is heavily involved with product design and quantitative research. ORATS offers data and backtesting on a subscription basis at www.orats.com. Matt has a Master’s degree from Kellogg School of Business.


What Is SteadyOptions?

12 Years CAGR of 129.0%

Full Trading Plan

Complete Portfolio Approach

Real-time trade sharing: entry, exit, and adjustments

Diversified Options Strategies

Exclusive Community Forum

Steady And Consistent Gains

High Quality Education

Risk Management, Portfolio Size

Performance based on real fills

Subscribe to SteadyOptions now and experience the full power of options trading!
Subscribe

Non-directional Options Strategies

10-15 trade Ideas Per Month

Targets 5-7% Monthly Net Return

Visit our Education Center

Recent Articles

Articles

  • The 7 Most Popular Cryptocurrencies Right Now

    There are thought to be 20,000 cryptocurrencies currently in existence. While a lot of these are inactive or discontinued, a lot of them are still being traded on a daily basis. But just which cryptocurrencies are most popular? This post takes a look at the top 7 most traded cryptocurrencies.

    By Kim,

    • 0 comments
    • 7,016 views
  • Harnessing Monte Carlo Simulations for Options Trading: A Strategic Approach

    In the world of options trading, one of the greatest challenges is determining future price ranges with enough accuracy to structure profitable trades. One method traders can leverage to enhance these predictions is Monte Carlo simulations, a powerful statistical tool that allows for the projection of a stock or ETF's future price distribution based on historical data.

    By Romuald,

    • 10 comments
    • 8,037 views
  • Is There Such A Thing As Risk-Management Within Crypto Trading?

    Any trader looking to build reliable long-term wealth is best off avoiding cryptocurrency. At least, this is a message that the experts have been touting since crypto entered the trading sphere and, in many ways, they aren’t wrong. The volatile nature of cryptocurrencies alone places them very much in the red danger zone of high-risk investments.

    By Kim,

    • 0 comments
    • 4,924 views
  • Is There A ‘Free Lunch’ In Options?


    In olden times, alchemists would search for the philosopher’s stone, the material that would turn other materials into gold. Option traders likewise sometimes overtly, sometimes secretly hope to find something which is even sweeter than being able to play video games for money with Moincoins, that most elusive of all option positions: the risk free trade with guaranteed positive outcome.

    By TrustyJules,

    • 1 comment
    • 17,914 views
  • What Are Covered Calls And How Do They Work?

    A covered call is an options trading strategy where an investor holds a long position in an asset (most usually an equity) and sells call options on that same asset. This strategy can generate additional income from the premium received for selling the call options.

    By Kim,

    • 0 comments
    • 3,210 views
  • SPX Options vs. SPY Options: Which Should I Trade?

    Trading options on the S&P 500 is a popular way to make money on the index. There are several ways traders use this index, but two of the most popular are to trade options on SPX or SPY. One key difference between the two is that SPX options are based on the index, while SPY options are based on an exchange-traded fund (ETF) that tracks the index.

    By Mark Wolfinger,

    • 0 comments
    • 8,252 views
  • Yes, We Are Playing Not to Lose!

    There are many trading quotes from different traders/investors, but this one is one of my favorites: “In trading/investing it's not about how much you make, but how much you don't lose" - Bernard Baruch. At SteadyOptions, this has been one of our major goals in the last 12 years.

    By Kim,

    • 0 comments
    • 4,567 views
  • The Impact of Implied Volatility (IV) on Popular Options Trades

    You’ll often read that a given option trade is either vega positive (meaning that IV rising will help it and IV falling will hurt it) or vega negative (meaning IV falling will help and IV rising will hurt).   However, in fact many popular options spreads can be either vega positive or vega negative depending where where the stock price is relative to the spread strikes.  

    By Yowster,

    • 0 comments
    • 7,020 views
  • Please Follow Me Inside The Insiders

    The greatest joy in investing in options is when you are right on direction. It’s really hard to beat any return that is based on a correct options bet on the direction of a stock, which is why we spend much of our time poring over charts, historical analysis, Elliot waves, RSI and what not.

    By TrustyJules,

    • 0 comments
    • 4,078 views
  • Trading Earnings With Ratio Spread

    A 1x2 ratio spread with call options is created by selling one lower-strike call and buying two higher-strike calls. This strategy can be established for either a net credit or for a net debit, depending on the time to expiration, the percentage distance between the strike prices and the level of volatility.

    By TrustyJules,

    • 0 comments
    • 5,254 views

  Report Article

We want to hear from you!


There are no comments to display.


Create an account or sign in to comment

You need to be a member in order to leave a comment

Create an account

Sign up for a new account. It's easy and free!


Register a new account

Sign in

Already have an account? Sign in here.


Sign In Now

Options Trading Blogs