
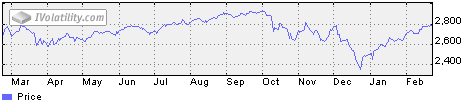
S&P 500 Index (SPX) 2792.67 ended the week 17.07 points or +.61% higher, all on Friday's advance of 17.79 points. While well above the 200-day Moving Average it still has three recent prior highs overhead to clear. On any pullback the 200-day Moving Average now 2747.53 will likely provide support. TheStrategy section below has more details.
CBOE Volatility Index® (VIX) 13.51 declined1.40 points or -9.39%last week.Our similar IVolatility Implied Volatility Index Mean, IVXM using four at-the-money options for each expiration period along with our proprietary technique that includes the delta and vega of each option, declined .82points or -6.88% ending at11.10.
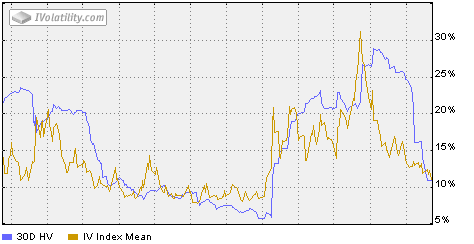
Now well below the bottom of the recent range around 14 that began last October,the S&P 500 Index volatility turned even lower, as shown in the one-year volatility chart and the SPX line charts above.
Downtrending implied volatility always excites the bulls.
VIX Futures Premium
The chart below showsour calculation ofLarry McMillan’s day-weighted average between first and second month futures contracts.The premium measures the amount that futures currently trade above or below the cash VIX, (contango or backwardation) until front month future converges with the VIX at expiration.
Previously, declines below 10% and advances above 30% were unsustainable, but for the last year, premiums above 10% have been scarce. These are crazy times that we live in.
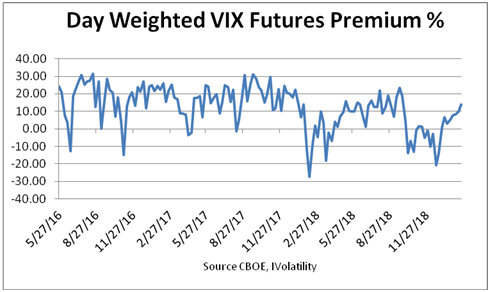
With 17 trading days until the March expiration, the day-weighted premium between March and April allocated 68% to March and 32% to April for a 13.92% premium vs. 9.88% week ending February 15;into the green zone between 10% to 20% associated with S&P 500 Index uptrends, adding more support for the bullish view. If there was only one indicator available, this one would be a top contender.
Strategy
Once again, as long as the S&P 500 Index remains above the downward sloping trendline from the October 3 high and breadth continues improving, odds favor the bulls. While advancing on the upward sloping trendline from the December 26 low at 2346.58 the trendline angle at 49° seems unsustainable compared to typical longer uptrends around 30°. However, equities will likely remain well supported since few are willing to risk being short before a China trade agreement is announced when Trump and Xi meet. However, then be prepared for a "sell the news" correction now well anticipated.
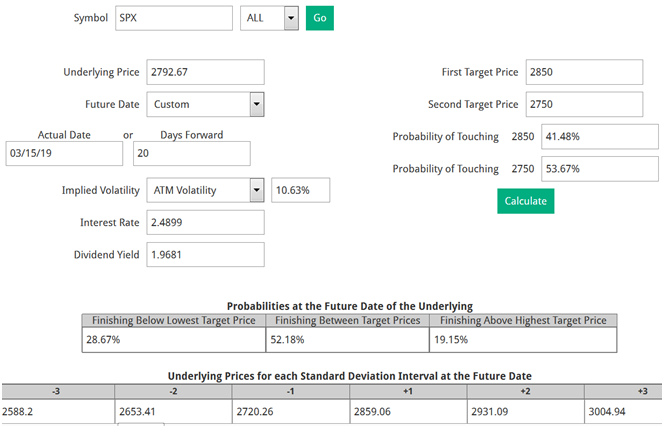
Probability Calculator
This handy auxiliary tool helps determine the probability of the underlying security reaching the desired price in a selected time frame based upon either implied or historical volatility inputs.The goal is to reduce subjectivity by adding objectivity.
Our SPX example starts by setting the symbol universe to All. The other selections are: USA, Europe and Canada. The last Underlying Price 2792.67 appears automatically along with the Interest Rate and Dividend Yield.
Clicking on Future Date will list all the future options expiration dates. For this example, using Custom opens the previous selected date March 15 and then displays the number of days that can also be altered.
For Implied Volatility, ATM Volatility of 10.63% was selected assuming the current at-the-money implied volatility for this time frame is the best estimate.
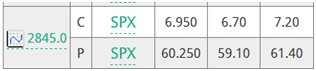
Then, the First Target Price of 2850 and Second Target Price of 2750 were entered based upon our trendline estimate that SPX will continue higher.
Selecting Calculate produces the following:
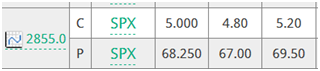
Based upon this it seems like a 2845/2855 long call vertical spread is about right at 24% of the distance between the strike prices. 2845 was selected as the first strike by extending the upward sloping trendline from the December 26 low and extending it out to March 15.With SPX at 2792.67, an out-of-the-money spread cost less both in terms of the net cost and in implied volatility, since due to volatility skew out-of-the-money calls are less expensive than those in-the-money and near the money.Here they are from Advanced Options using the offer price for the buy and mid price for the sell assuming some price improvement is possible.
For actively trading underlying’s, with good options volume, the standard pricing practice is to: pay the ask for the buy, and split the difference between the bid and ask for the sell side. When option volume is low and the bid/ask prices are wide it may be necessary to use the bid on the sell side, increasing the spread cost. This is one reason for preferring underlying’s with more active volume especially for multiple leg strategies, especially butterflies with 4 legs.
The debit of 2.40 divided by the width of the spread (2845 -2855) = 10, so (2.40/10) = .24 or 24% of the distance between the strikes. This makes the vertical spread reasonably priced based upon the current location of the first out-of-the-money strike curvature (location on its call curve) and fits well with our expectations.
The out-of-the-money strike price selected is just below the first target price increasing the odds slightly from 41.48% at 2850 and both strike prices are well within one standard deviation up or down.
Since all trade plans require a SU (stop/unwind) it will be set at a close below the 200-day Moving Average now at 2747.53 but increasing as SPX advances. Should it decline, the 200-day Moving Average is likely to provide support. Should that support fail, then the plan requires some action, either close the positions, close one leg, or add a put.
For other strategies, such as an Iron Condor the strike prices selected to sell should be around two standard deviations up 2931.09 or down 2658.41. For a short Iron Condor consisting of a short OTM call and a short OTM put, the objective is to place the first strikes far enough away from ATM, so as not to touch them. Two standard deviations away is a reasonable distance—any farther away and the net credit for the spreads is likely to be too small, while any closer and the probability of one leg being reached increases; meaning it will need to be closed for a loss while the second will remain open.
Summary
As the S&P 500 Index continues higher options and futures indictors continue to improve much to the delight of the bulls. Expectations seem focused on an upcoming trade deal with China that could trigger a "sell the news" correction when announced. Fortune favors the well-informed.
Written by Jack Walker. Jack Walker is the author of IVolatility.com’s Volatility Trading Digest. Jack is a former PSE options market maker and hedge fund manager. Jack has contributed to SeekingAlpha, TalkMarkets, amongst other financial news sites.
Related articles:
- IVolatility Tools: Advanced Ranker
- IVolatility Tools: Advanced Options
- IVolatility Tools: PnL Calculator


There are no comments to display.
Join the conversation
You can post now and register later. If you have an account, sign in now to post with your account.
Note: Your post will require moderator approval before it will be visible.