
The attributes are easily spotted on a chart, but it does not appear often. It consists of three specific parts. First, price gaps away from the current trading range, either above or below. The gap itself is significant, but it can mean may things: reversal, continuation, or just momentary volatility.
The second attribute is trading in the new range, but only for a limited number of sessions. The “typical” island cluster consists of three to six sessions. Every trader knows that several things can happen next: Continued trading in the new range, movement in the same direction, or movement reversing and going back to the previous range. In other words, at the point of the second phase, you cannot know what will happen next.
The third attribute is where a call to action occurs. It consists of a gap in the opposite direction, setting up the cluster. Now there is a limited trading activity set off by gaps on both sides, concluding with price moving back to the previous level. This forecasts a strong trend in the direction of the second gap.
An example of this was seen on the chart of Cummins (CMI). In August and September price was stuck in consolidation between $135 and $145 per share. A breakout in late September took price above the consolidation range and led to a strong downtrend in October. Price moved from a high of $152 down to $139 in less than two weeks. Then a gap appeared, moving price further, down to $134.
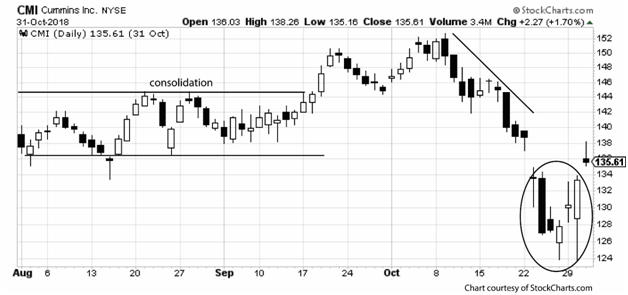
The new low was significant, as it remained below the previous support level during consolidation, of $135 per share. Trading remained in this range, from $135 down to $125 for six sessions.
Next, price gapped higher, from a close of about $133 up above $135. In this pattern, creating an island cluster, the signal was clear. Because the price after the gap closed at the previous support price during consolidation, the signal clearly predicted a new bullish move.
This is typical after the island cluster. Price tends to move away from the cluster, often strongly, and to either set up a new range, or to remain volatile in the short term. Either event is appealing to options traders.
In the example, CMI price did as predicted, moving higher. This is shown in the second chart.
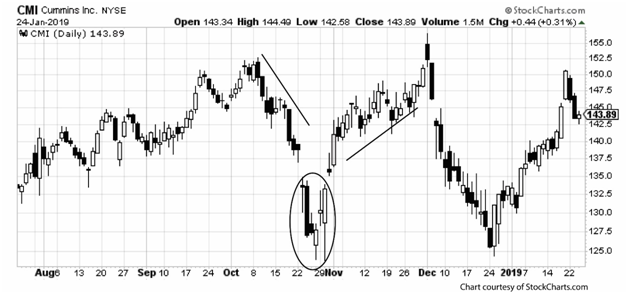
This chart extends beyond the timing of the island cluster. The six-day island cluster was visible after the pattern was concluded. As predicted, it took price higher over the following month, moving from $135 to as high as $155. It later plunged back to $125 over the first three weeks of December, then turning bullish once again.
The volatility after the conclusion of the island cluster could be disturbing to many equity traders. But to options traders, this situation sets up attractive swing trading possibilities, especially given the overall range between $125 on the low side and $155 on the high side.
Trading options at the conclusion of the island cluster is indicated in one of the following ways:
Open short calls and open long puts should be closed based on this pattern. As the island cluster ended, the forecast was for a strong move to higher prices.
Open short puts and open long calls should be left open due to the pattern. The conclusion of the island cluster predicts price move higher, meaning the open short put will lose value in coming days or weeks and can be bought to close at a profit or allowed to expire worthless.
For traders with no open positions, the conclusion of an island cluster indicates new trades that should be opened, and timing is excellent for a bullish move. However, before embarking on any new positions, seek confirmation from a secondary signal. The long white session before the concluding gap, followed by another long white session on the second day after the gap, may be view as bullish confirmation.
A bullish trade is indicated when the island cluster occurs to the downside, as in this example. This may consist of selling to open a short put or buying to open a long call. The opposite trades would be indicated when an island cluster occurs above the current range and pointing to the likelihood of a bearish reversal.
Timing of trades depends on a trader’s strategic viewpoint. For long options, a one-month time to expiration is likely to work best. Price will not include excessive time value and time decay will not accelerate until the final two weeks of the option’s life. For short options, the idea timing is one week to 10 days. This will include a weekend with following Friday expiration and time decay will be rapid. This means the chances for being able to buy to close at a profit will be at maximum.
The weekend is essential in the timing of a short trade. On average, options lose one-third of their remaining time value between he Friday before expiration and the Monday of expiration week. This timing, combined with the exceptional reversal signal provided by the island cluster, is the key element to timing of options trades in this situation.
The same overall timing strategy can be applied to any strong signal with confirmation, and timing is as important as proximity in every instance. The idea option trade will be at the money or slightly out of the money (for long) or in the money (for short). These proximity guidelines minimize cost for long positions while keeping the trade close to the strike; and maximize premium income for short positions while setting up the opportunity for profits from rapid time decay – all if price behaves as expected. And this is the element of uncertainty that makes options trading interesting. Manageable risk levels produce profits when reversal and confirmation are recognized … most of the time. However, traders – especially swing traders – also need to be realistic about the possibility that even the strongest signals are misleading at times.
Michael C. Thomsett is a widely published author with over 80 business and investing books, including the best-selling Getting Started in Options, coming out in its 10th edition later this year. He also wrote the recently released The Mathematics of Options. Thomsett is a frequent speaker at trade shows and blogs on his website at Thomsett Guide as well as on Seeking Alpha, LinkedIn, Twitter and Facebook.


There are no comments to display.
Join the conversation
You can post now and register later. If you have an account, sign in now to post with your account.
Note: Your post will require moderator approval before it will be visible.