
I will explain what option volatility is and why it’s important. I’ll also discuss the difference between historical volatility and implied volatility and how you can use this in your trading, including examples. I’ll then look at some of the main options trading strategies and how rising and falling volatility will affect them. This discussion will give you a detailed understanding of how you can use volatility in your trading.
OPTION TRADING VOLATILITY EXPLAINED
Option volatility is a key concept for option traders and even if you are a beginner, you should try to have at least a basic understanding. Option volatility is reflected by the Greek symbol Vega which is defined as the amount that the price of an option changes compared to a 1% change in volatility. In other words, an options Vega is a measure of the impact of changes in the underlying volatility on the option price. All else being equal (no movement in share price, interest rates and no passage of time), option prices will increase if there is an increase in volatility and decrease if there is a decrease in volatility. Therefore, it stands to reason that buyers of options (those that are long either calls or puts), will benefit from increased volatility and sellers will benefit from decreased volatility. The same can be said for spreads, debit spreads (trades where you pay to place the trade) will benefit from increased volatility while credit spreads (you receive money after placing the trade) will benefit from decreased volatility.
Here is a theoretical example to demonstrate the idea. Let’s look at a stock priced at 50. Consider a 6-month call option with a strike price of 50:
If the implied volatility is 90, the option price is $12.50
If the implied volatility is 50, the option price is $7.25
If the implied volatility is 30, the option price is $4.50
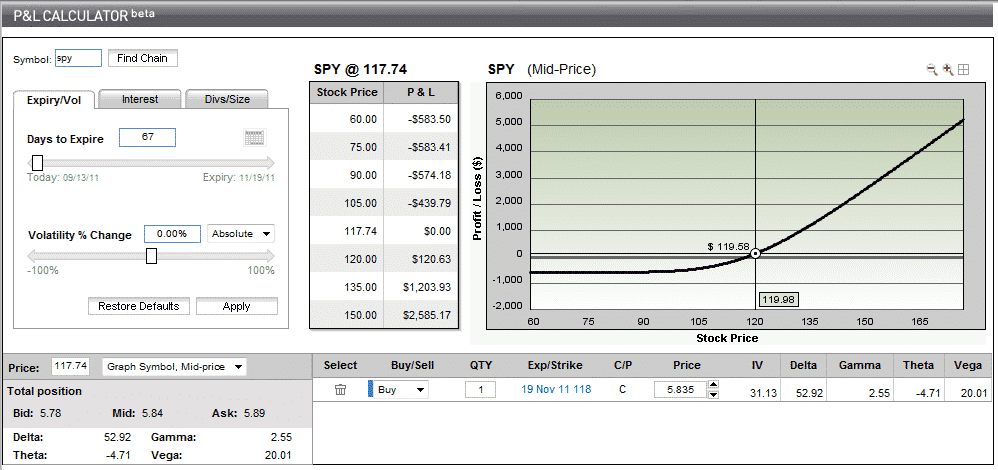
This shows you that, the higher the implied volatility, the higher the option price.Below you can see three screen shots reflecting a simple at-the-money long call with 3 different levels of volatility.
The first picture shows the call as it is now, with no change in volatility. You can see that the current breakeven with 67 days to expiry is 117.74 (current SPY price) and if the stock rose today to 120, you would have $120.63 in profit.
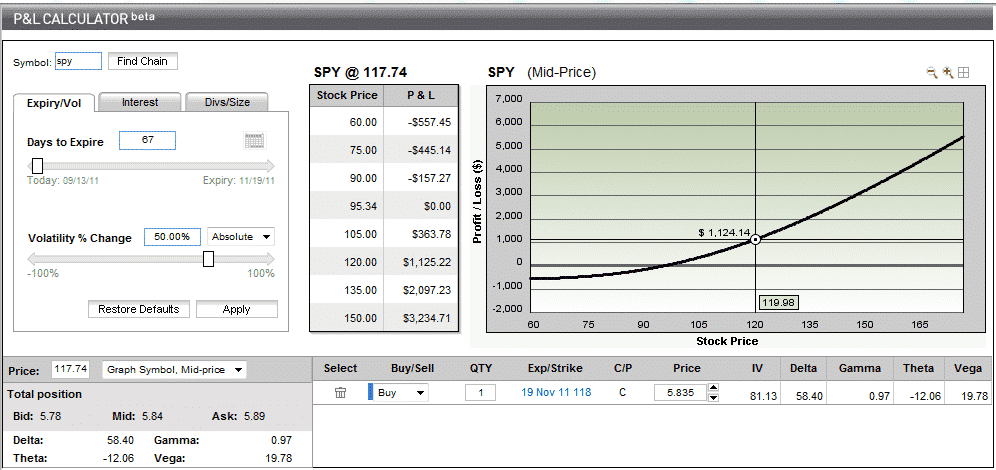
The second picture shows the call same call but with a 50% increase in volatility (this is an extreme example to demonstrate my point). You can see that the current breakeven with 67 days to expiry is now 95.34 and if the stock rose today to 120, you would have $1,125.22 in profit.
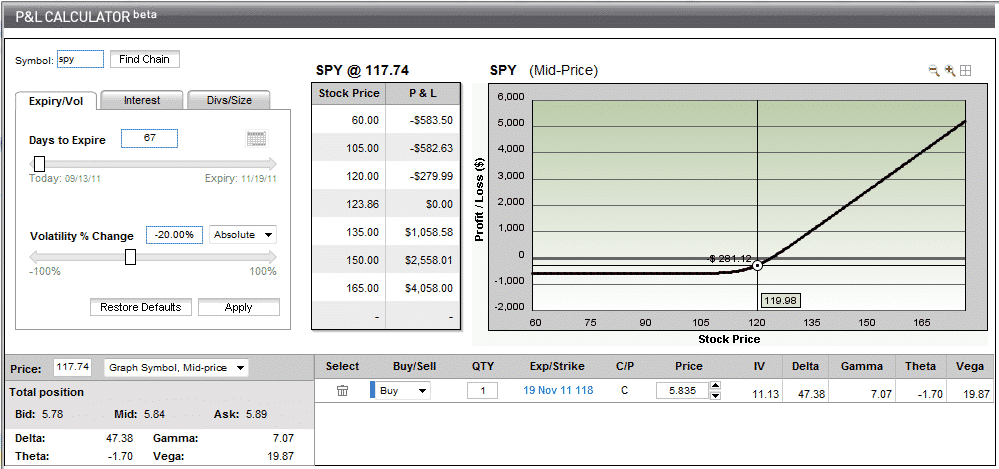
The third picture shows the call same call but with a 20% decrease in volatility. You can see that the current breakeven with 67 days to expiry is now 123.86 and if the stock rose today to 120, you would have a loss of $279.99.
WHY IS IT IMPORTANT?
One of the main reasons for needing to understand option volatility, is that it will allow you to evaluate whether options are cheap or expensive by comparing Implied Volatility (IV) to Historical Volatility (HV).
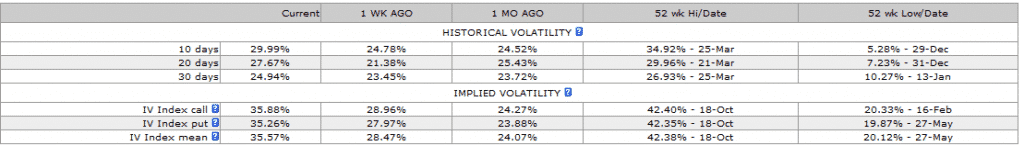
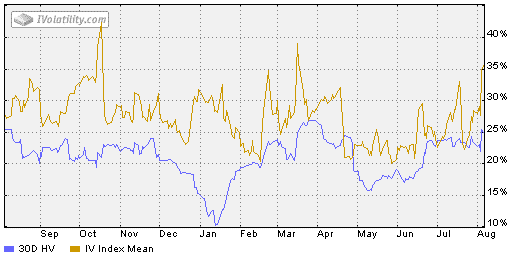
Below is an example of the historical volatility and implied volatility for AAPL. This data you can get for free very easily from www.ivolatility.com. You can see that at the time, AAPL’s Historical Volatility was between 25-30% for the last 10-30 days and the current level of Implied Volatility is around 35%. This shows you that traders were expecting big moves in AAPL going into August 2011. You can also see that the current levels of IV, are much closer to the 52 week high than the 52 week low. This indicates that this was potentially a good time to look at strategies that benefit from a fall in IV.
Here we are looking at this same information shown graphically. You can see there was a huge spike in mid-October 2010. This coincided with a 6% drop in AAPL stock price. Drops like this cause investors to become fearful and this heightened level of fear is a great chance for options traders to pick up extra premium via net selling strategies such as credit spreads. Or, if you were a holder of AAPL stock, you could use the volatility spike as a good time to sell some covered calls and pick up more income than you usually would for this strategy. Generally when you see IV spikes like this, they are short lived, but be aware that things can and do get worse, such as in 2008, so don’t just assume that volatility will return to normal levels within a few days or weeks.
Every option strategy has an associated Greek value known as Vega, or position Vega. Therefore, as implied volatility levels change, there will be an impact on the strategy performance. Positive Vega strategies (like long puts and calls, backspreads and long strangles/straddles) do best when implied volatility levels rise. Negative Vega strategies (like short puts and calls, ratio spreads and short strangles/ straddles) do best when implied volatility levels fall. Clearly, knowing where implied volatility levels are and where they are likely to go after you’ve placed a trade can make all the difference in the outcome of strategy.
HISTORICAL VOLATILITY AND IMPLIED VOLATILITY
We know Historical Volatility is calculated by measuring the stocks past price movements. It is a known figure as it is based on past data. I want go into the details of how to calculate HV, as it is very easy to do in excel. The data is readily available for you in any case, so you generally will not need to calculate it yourself. The main point you need to know here is that, in general stocks that have had large price swings in the past will have high levels of Historical Volatility. As options traders, we are more interested in how volatile a stock is likely to be during the duration of our trade. Historical Volatility will give some guide to how volatile a stock is, but that is no way to predict future volatility. The best we can do is estimate it and this is where Implied Vol comes in.
– Implied Volatility is an estimate, made by professional traders and market makers of the future volatility of a stock. It is a key input in options pricing models.
– The Black Scholes model is the most popular pricing model, and while I won’t go into the calculation in detail here, it is based on certain inputs, of which Vega is the most subjective (as future volatility cannot be known) and therefore, gives us the greatest chance to exploit our view of Vega compared to other traders.
– Implied Volatility takes into account any events that are known to be occurring during the lifetime of the option that may have a significant impact on the price of the underlying stock. This could include and earnings announcement or the release of drug trial results for a pharmaceutical company. The current state of the general market is also incorporated in Implied Vol. If markets are calm, volatility estimates are low, but during times of market stress volatility estimates will be raised. One very simple way to keep an eye on the general market levels of volatility is to monitor the VIX Index.
HOW TO TAKE ADVANTAGE BY TRADING IMPLIED VOLATILITY
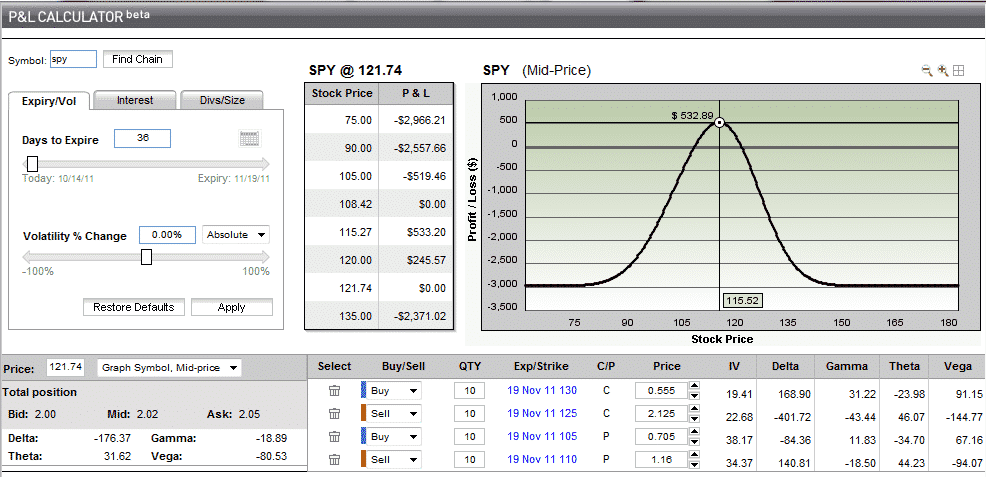
The way I like to take advantage by trading implied volatility is through Iron Condors. With this trade you are selling an OTM Call and an OTM Put and buying a Call further out on the upside and buying a put further out on the downside. Let’s look at an example and assume we place the following trade today (Oct 14,2011):
Sell 10 Nov 110 SPY Puts @ 1.16
Buy 10 Nov 105 SPY Puts @ 0.71
Sell 10 Nov 125 SPY Calls @ 2.13
Buy 10 Nov 130 SPY Calls @ 0.56
For this trade, we would receive a net credit of $2,020 and this would be the profit on the trade if SPY finishes between 110 and 125 at expiry. We would also profit from this trade if (all else being equal), implied volatility falls.
The first picture is the payoff diagram for the trade mentioned above straight after it was placed. Notice how we are short Vega of -80.53. This means, the net position will benefit from a fall in Implied Vol.
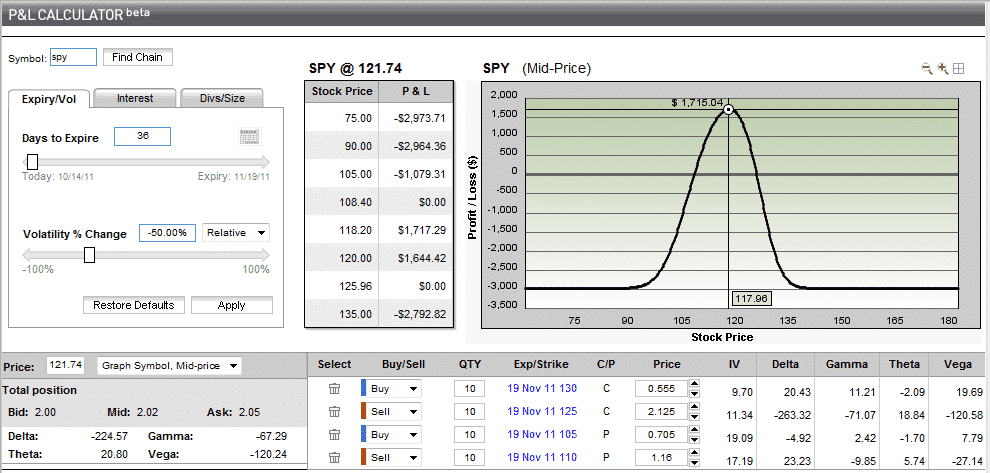
The second picture shows what the payoff diagram would look like if there was a 50% drop in Implied vol. This is a fairly extreme example I know, but it demonstrates the point.
The CBOE Market Volatility Index or “The VIX” as it is more commonly referred is the best measure of general market volatility. It is sometimes also referred as the Fear Index as it is a proxy for the level of fear in the market. When the VIX is high, there is a lot of fear in the market, when the VIX is low, it can indicate that market participants are complacent. As option traders, we can monitor the VIX and use it to help us in our trading decisions. Watch the video below to find out more.There are a number of other strategies you can when trading implied volatility, but Iron condors are by far my favorite strategy to take advantage of high levels of implied vol.
I hope you found this information useful. Let me know in the comments below what you favorite strategy is for trading implied volatility.
Here’s to your success!
The following video explains some of the ideas discussed above in more detail.


There are no comments to display.
Join the conversation
You can post now and register later. If you have an account, sign in now to post with your account.
Note: Your post will require moderator approval before it will be visible.