
The more asset valuations and risk rise, the more implied volatility tends to drop and therefore the cost of insuring financial assets typically fall. As the S&P 500 index nears the sumptuously round number of 2500 and valuations surpass levels preceding the Great Depression, the price of options to protect investors is deeply discounted. Provide valuable insight.
The lead quote from Michael Lewis is in reference to NFL Hall of Famer Lawrence Taylor, otherwise known as LT, a defensive end for the New York Giants. LT was an exceptional player who not only threatened an opposing team’s offensive prowess but more importantly, the health of their quarterback. The Blind Side, by Michael Lewis, documented how teams were forced to pay dearly for insurance against this threat. The insurance came in the form of soaring salaries for strong left tackles who protect right handed quarterbacks from the so called “blind side” from which players like LT were attacking. The sacrifices teams made to shield their most valuable asset, the quarterback, limited the salaries that could be spent on players to boost their offensive fire power. LT taught general managers an important lesson -protecting your most important asset is vital in the quest for success.
Growing your wealth through good times and preserving it in bad times are the key objectives of wealth management. At times when the markets present “LT”-like threats, prudence argues for both a conservative posture and protection of assets.
While many investors continue to ignore the lopsided risk/return proposition offered by the equity markets, we cannot. Sitting on one's hands and avoiding the equity market is certainly an option and one which we believe might look better over time than most analysts think. That said, it is not always a viable option for many professional and individual investors. Some investors have a mandate to remain invested in various asset classes to minimum required levels.In other cases, investors need to earn acceptable returns to help themselves or their clients adhere to their financial goals. Accordingly, the question we address in this article is how an investor can run with the bulls and take measures to avoid the horns of a major correction.
Risk vs. Reward
There are two divergent facts that make investing in today’s market extremely difficult.
- The market trend by every measure is clearly upward. Any novice technician with a ruler projected at 45 degrees can see the trend and extrapolate ad infinitum.
- Markets are extremely overvalued. Intellectually honest market analysts know that returns produced in valuation circumstances like those observed today have always beenshort-livedwhen the inevitable correction finally arrives.
In The Deck is Stacked we presented a graph that showed expected five-year average returns and the maximum drawdowns corresponding with varying levels of Cyclically-Adjusted Price-to-Earnings (CAPE) ratios since 1958. We alter the aforementioned graph, as shown below,to incorporate the odds of a 20% drawdown occurring within the next five years.
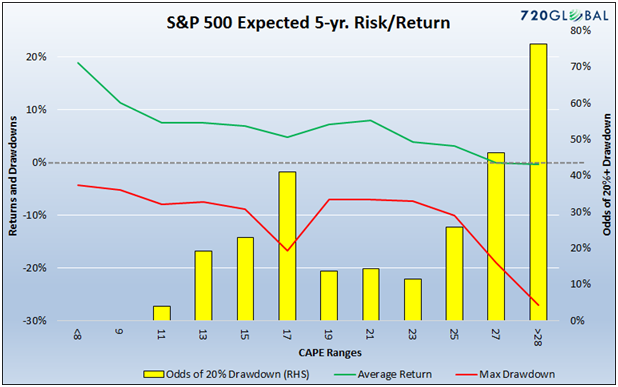
Over the next five years we should expect the following:
- Annualized returns of -.34%(green line)
- A drawdown of 27.10% from current levels (red line)
- 76% odds of a 20% or greater correction (yellow bars)
In a recent article,13D Research raised an excellent point quoting Steve Bregman of Horizon Kinetics: “There is no factor in the algorithm for valuation. No analyst at the ETF organizer—or at the Pension Fund that might be investing—is concerned about it; it’s not in the job description. There is, really, no price discovery. And if there’s no price discovery, is there really a market?”
If, as Bregman states, the market is awash with investors, traders and algorithmic robots that do not care about fundamentals or value, is there any reason to think the market cannot continue to ignore fundamentals and run higher? While such a condition can easily endure and propel prices to even loftier valuations, the precedent of prior bubbles dictates this does not end well. At some point, the reality of economic fundamentals which underlie prices reassert themselves. Accordingly, in the following section, we present a few hedging strategies that allow one to profit if the market keeps charging ahead and at the same time limit losses and/or profit if financial gravity reasserts itself.
Options
There are an infinite number of options strategies that one can deploy to serve all kinds of purposes. Even when narrowing down the list to purely hedging strategies one is left with an enormous number of possibilities. In this section, we discuss three strategies that involve hedging exposure to the S&P 500. The purpose is to give you a sense of the financial cost, opportunity cost, and loss mitigation benefits that can be attained via options.
Option details in the examples below are based on pricing as of July 24, 2017.
Elementary Put Hedge
This first option strategy is the simplest option hedge one can employ. A put provides its holder a right to sell a security at a given price. For instance, if you own the S&P 500 ETF (SPY) at a price of 100 and want to limit your downside to-10% you can buy a put with a strike price of 90. If SPY drops below 90, the value of the put will rise in line, dollar-for-dollar with the loss on SPY, thus nullifying net losses beyond 10%. Devising a similar strategy to manage a basket of stocks, ETF’s or mutual funds is more complicated but similar.
To help visualize what a return spectrum might look like on a portfolio hedged in this manner consider a simple scenario in which one owns the S&P 500 (SPY) and hedges with SPY options. The following assumptions are used:
- Own 400 shares of SPY at a price of $246.80 per share at the cost of $98,720.
- The holding period is 1 year.
- Purchase SPY put options with a strike price of $230, expiration of 9/21/2018 and a cost of $9.15 per share and total cost of $915 per option. (Each option is equal to 100 shares)
The graph below provides the return profile of the long SPY position (black) and three hedged portfolios for a given range of SPY prices. The example provides three different hedging options to show what under-hedged (2 options), perfectly-hedged (4 options) and over-hedged (8 options) outcomes might look like.
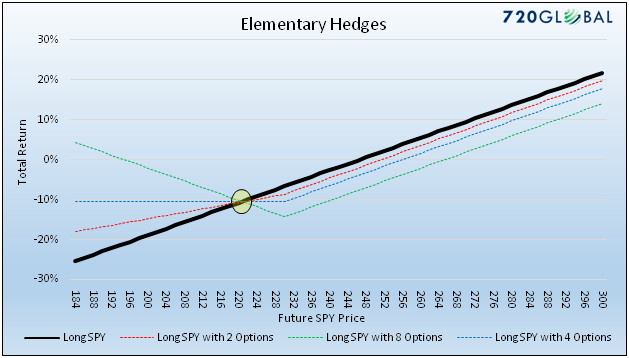
Note the breakeven point (yellow circle) on the hedged portfolios occurs if SPY were to decline 10% to $221 per share. The cost of the options in percentage terms is shown on the right side of the breakeven point.It is the difference in returns between the black line and the dotted lines. Conversely, the benefit of the options strategies appears in the percentage return differentials to the left of the breakeven point. (Additional cost/benefit analysis of these strategies is shown further in the article) In this example, we assume the options are held to the expiration date. Changes in other factors such as time to expiration, rising or falling volatility, and intrinsic value will produce results that do not correspond perfectly with the results above at any point in time other than at the expiration date.
Collar
The elementary option strategy was straightforward as it only involved buying a one-year put option. Like the first strategy, a collar entails holding a security and buying a put to hedge the downside risk. However, to reduce the cost of the put option a collar trade requires one to also sell (write) a call option. A call option entitles the buyer/owner to purchase the security at the agreed upon strike price and the seller/writer of the option to sell it to them at the agreed upon strike price. Because the investor is selling/writing an option, he is receiving payment for selling the option. Incorporating the call option sale in a collar strategy reduces the net cost of the hedge but at the expense of upside returns.
To help visualize what the return spectrum might look like with a collared portfolio that owns the S&P 500 (SPY) and hedges with SPY options, consider the following assumptions:
- Own 400 shares of SPY at a price of $246.80 per share at the cost of $98,720.
- The holding period is 1 year.
- Purchase SPY put options with a strike price of $230, expiration of 9/21/2018 at the cost of $9.15 per share and total cost of $3,660. (Each option is equal to 100 shares)
- Sell/write SPY call options with a strike price of $270, expiration of 9/21/2018 at the cost of $3.75 per share and total benefit of $1,550.
As diagramed below, a collar strategy literally puts a collar or limit around gains and losses.
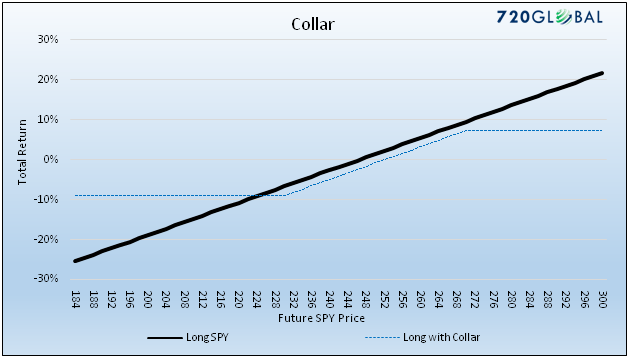
Writing the call option reduces the net hedging cost by $1,550, limits losses to 9% but caps the ability to profit if the market increases at 7.21%.
Bloomberg created an index that replicates a collar strategy. Bloomberg’s collar index (CLL) assumes that an investor holds the stocks in the S&P 500 index and concurrently buys 3-month S&P 500 put options to protect against market declines and sells 1-month S&P 500 call options to help finance the cost of the puts. As options expire new options are purchased. The percentage returns of the S&P 500 and CLL indexes from 2007 and 2008 are graphed below.
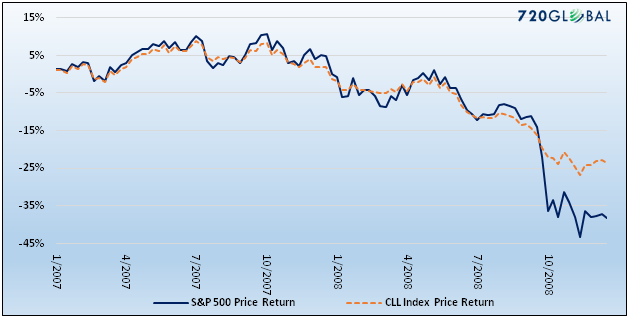
Data Courtesy: Bloomberg
Note that the CLL and SPY returns were well correlated until the latter part of 2008. At this point, when volatility spiked and the markets headed sharply lower, the benefits of the collar were visible.
**Bloomberg assumes a different collar structure than we modeled and described above.
Sptiznagel’sTail Strategy
Mark Spitznagel is a highly successful hedge fund manager and the author of a book we highly recommend called “The Dao of Capital” (LINK). Spitznagel uses Austrian school economic principles and extensive historical data to describe his unique perspectives on investing. In pages 244-248 of the book, he presents an options strategy that served him well in periods like today when valuations foreshadowed significant changes in market risk. The goal of the strategy is not to hedge against small or even moderate losses, as in the first two examples, but to protect and profit from severe tail risk that can destroy wealth like the recent experiences of 2000 and 2008.
Sptiznagel’s strategy hedges a market long position with put options expiring in two months. On a monthly basis, he sells the put options and buys new options expiring in two months. The strike price on his options are 30% below current prices. To replicate his strategy and compare it to the ones above we assume the following:
- Own 400 shares of SPY at a price of $246.80 per share at the cost of $98,720.
- The holding period is 1 year.
- Purchase 82 SPY put options (equivalent to .50% of the portfolio value) with a strike price of $175 (30% out of the money), expiration of 9/15/2017 (2 months) at a cost of $.06 per share and total cost of $492. (Each option is equal to 100 shares)
- For purposes of this example, new options are purchased when the current options mature every two months (Spitznagel sells and buys new options on a monthly basis).
- We also assume this hedge was already in place for a year resulting in an accrued trade cost of $2,952 (6 *$492) to date.
The graph below highlights the cost benefit analysis.
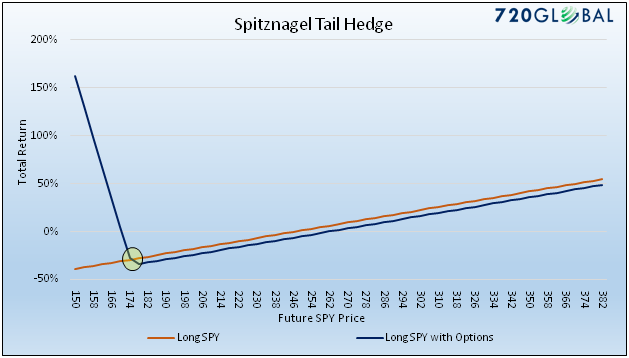
The strategy graphed above looks appealing given the dazzling reward potential, but we stress that the breakeven point on the trade is approximately 30% lower than current prices. While the cost difference to the right of the breakeven point looks relatively small, the axis’s on the graph have a wide range of prices and returns which visually minimizes the approximate 6% annual cost. Similar strategies can be developed whereby one gives up some gains in a severe drawdown in exchange for a lower cost profile.
Cost/Benefit Table
The tables below compare the strategies detailed above to give a sense of returns and a cost/benefit analysis across a wide range of SPY returns.
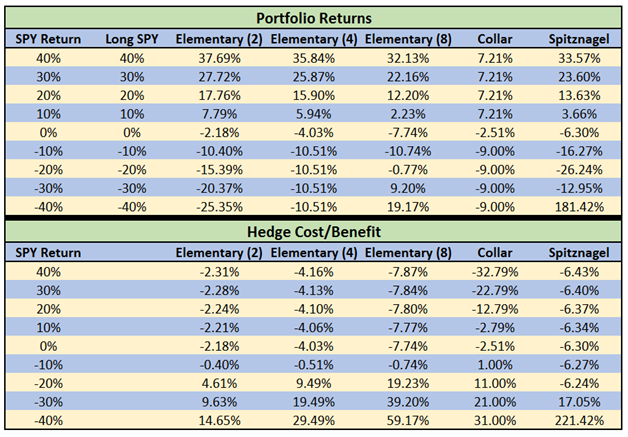
The option strategies in this article are designed for the initial stages of a decline. Pricing of options can rise rapidly as volatility, a key component of options prices, increases. The data shown above could be vastly different in a distressed market environment. These options strategies and many others can be customized to meet investor’s needs.
Summary
We insure our cars, houses, health and our lives. Why is the idea of hedging ones wealth rarely considered especially considering the cost of that protection actually falls as the market becomes more vulnerable? Given current market valuations along with a 76% chance of a 20%+ drawdown,we urge clients to consider implementing a defensive strategy of insuring your portfolio. Although option strategies compress returns, they serve to “defend the perimeter” in the event of a severe market correction. These strategies and many others like them yield peace of mind and the ability to respond clinically in the event of turmoil as opposed to reacting emotionally.
The rather simple examples in this article were created to give you a sample of the costs and benefits of hedging. When devising a hedging strategy, it often helps to draw a picture of an ideal but realistic return spectrum. From that point, a spreadsheet model can be used to try to create the desired return profile using available options.
In addition to options strategies, there are other means of hedging a long portfolio such as structured notes, volatility funds, and short funds. Portfolio construction is also an important natural means of mitigating exposure to losses. While the topic for future Unseen articles, they are ideas worth exploring and comparing to options strategies. Hedging and options analysis is a complex field limited only by imagination and market liquidity. If you have questions, feel free to reach out to 720Global to explore these or other ideas that may be better suited for you.
Michael Lebowitz, CFA is an Investment Analyst and Portfolio Manager for Clarity Financial, LLC specializing in macroeconomic research, valuations, asset allocation, and risk management. Michael has over 25 years of financial markets experience. In this time he has managed $50 billion+ institutional portfolios as well as sub $1 million individual portfolios. Michael is a partner at Real Investment Advice and RIA Pro Contributing Editor and Research Director. Co-founder of 720 Global. You can follow Michael on Twitter. This article is used here with permission and originally appeared here.


There are no comments to display.
Join the conversation
You can post now and register later. If you have an account, sign in now to post with your account.
Note: Your post will require moderator approval before it will be visible.