
(My full options education article on why buy-writes have the exact same risk/reward as selling naked puts is at the end of this article.)
The second reason I closed the position was there was a chance that SE would report earnings during the May expiration cycle. That would potentially bring another layer of risk to our May buy-write position. As you can see in the graphic below my options trading tool is estimating earnings will be reported the Wednesday before expiration, which would certainly keep the value of the buy-write high through earnings.

Another way I can determine when a company is due to report earnings is by comparing the volatility of the options each month. The volatility/price of options in the reporting month is higher than the months before and after earnings. Here is an example using Zendesk (ZEN), which will report earnings tonight:
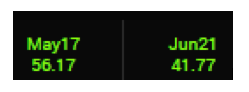
What you can see in this graphic is that with the options expiring May 17 option volatility is 56.17, way more expensive than the June 21 option volatility, which is 41.77. In essence, the price of options/volatility is telling you that ZEN’s earnings are in the May option expiration.
Now let’s circle back to SE. Yesterday, the May option volatility in SE was significantly more expensive than June. And because of that I assumed that SE would report earnings in May.
However, based on a trade today, and how the options market is reacting to this trade, I now believe that SE’s earnings will come during the June expiration cycle, not May. First, here is the trade:
Seller of 7,500 Sea (SE) May 25 Calls for $1 – Stock at 25
Buyer of 7,500 Sea (SE) June 25 Calls for $1.90 – Stock at 25
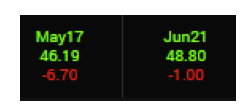
This trade, and the subsequent volatility shift, would lead me to believe earnings are now in June. As the graphic below shows, the May volatility is down 6.7 points and now below the June volatility. Yesterday the May volatility was approximately four points higher than June … and today June is now 2.5 points higher than May (48.8 vs. 46.19).
The earnings date for SE is still not confirmed. However, by paying attention to the price of options/volatility you can get a good read on when the options market is predicting a company will report.
Below is an options education article I wrote several years ago demonstrating that while Covered Calls/Buy-writes are considered a safe trade, and Naked Put Sales are perceived to have high risk, at the end of the day they have the EXACT same risk/reward.
Buy-Write vs. Naked Put Sale
Buy-writes, also known as covered calls, are one of the general public’s most popular options trading strategies. Selling naked puts (the sale of a put in an stock or index without a stock position), on the other hand, is feared by the general public as it’s considered to have much greater risk than a traditional buy-write. But when you break down the profit and loss potential of the two strategies, you can see that they’re identical.
Let’s start by looking at a buy-write/covered call:
A covered call is a strategy in which the trader holds a long position in a stock and writes (sells) a call option on the same stock in an attempt to generate income. Because the trader sold a call against his stock position, his upside is now limited.
For example, let’s say you own 100 shares of Alcoa (AA), which is currently trading at 13.99. You then theoretically sell one AA July 14 Call (expiring 7/19/2014) for $0.51 for each of your 100 shares.
Let’s take a look at a few scenarios for this trade:
-
In this scenario, AA shares trade flat for the next month and the stock stays below the 14-strike price. At this point, the options you sold will expire worthless, and you will have collected your full premium of $0.51 per share ($51). Thus you will have created a yield of 3.78% in one month’s time.
-
In this scenario, AA shares fall to 13.48. At this point, the options you sold will expire worthless and you will have collected your full premium of $0.51 per share ($51). However, your 100 shares of AA will have lost $51 of value. Thus, you are breakeven on the trade. At this time, you could simply sell the next month’s calls against your stock position.
-
In this scenario, AA shares fall to 13. Once again, the options you sold will expire worthless and you will have collected your full premium of $0.51 (or $51). However, your shares of AA will have lost $99 of value, leaving you down $48 on the trade. At this time, you could simply sell the next month’s calls against your stock or exit the entire position by selling your stock.
- In this scenario, AA shares rise above 14. At this point, the owner of the 14 calls will exercise his right to buy the stock from you. This will leave you with no position. However, you have collected your $0.51 (or $51) and made $0.01 on the stock position.
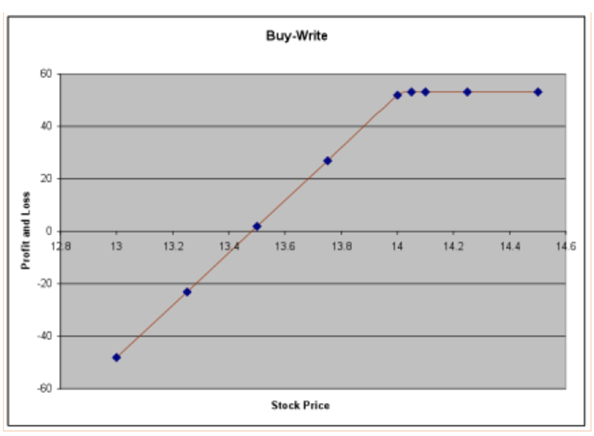
Here is the profit and loss graph of this trade:
Now let’s take a look at the scenarios of selling a Naked Put in the same stock. (Remember, selling naked puts is the sale of a put in a stock or index without a stock position.) With stock AA trading at 13.99, we could sell the July 14 Puts (expiring 7/19/2014) for $0.51.
Let’s take a look at a few scenarios for this trade:
-
In this scenario, AA shares trade flat for the next month and the stock stays below the 14-strike price. At this point, the options you sold will expire in the money, and you will have collected your premium of $0.51 per share ($51). Now you will be long the stock, but will have created a yield of 3.78% in one month’s time. At this time, you could simply sell the next month’s calls against your stock position.
-
In this scenario, AA shares fall to 13.48. At this point, the puts you sold will expire in the money. Thus you will buy the stock at 14. However, since you collected your full premium of $0.51 per share ($51) this makes up for the loss on the stock. Thus, you are breakeven on the trade. At this time, you could simply sell the next month’s calls (switching to a buy-write now that you own shares) against your stock position.
-
In this scenario, AA shares fall to 13. At this point, your puts are in the money so you will be forced to buy the stock at 14. You will have collected your full premium of $0.51 (or $51). However, your shares of AA will have lost $99 of value, making you down $48 on the trade. At this time, you could simply sell the next month’s calls against your stock or exit the entire position by selling your stock.
- In this scenario, AA shares rise above 14. At this point, the puts you sold will expire worthless and you will have collected your full premium of $0.51, or a yield of 3.78%.
Here is the profit and loss graph of this trade:
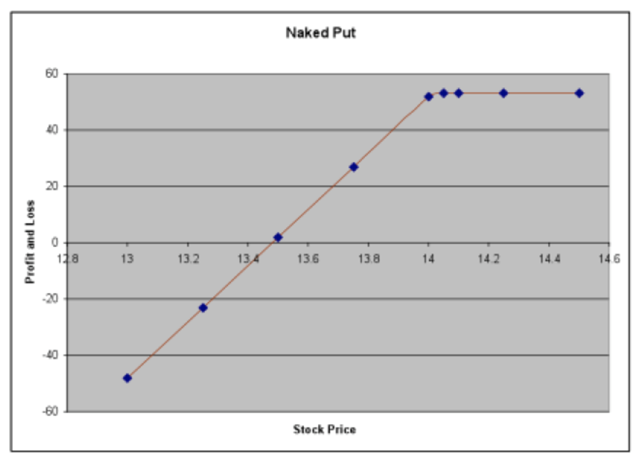
So what jumps out about these two charts? They are absolutely identical! The most you can make is the same, and the most you can lose is the same.
We can go through this exercise hundreds of times but each time the profit and loss graphs will be identical. Thus, executing a buy-write is “synthetically” identical to selling a naked put.
Jacob Mintz is a professional options trader and editor of Cabot Options Trader. He is also the founder of OptionsAce.com, an options mentoring program for novice to experienced traders. Using his proprietary options scans, Jacob creates and manages positions in equities based on risk/reward and volatility expectations. Jacob developed his proprietary risk management system during his years as an options market maker on the Chicago Board of Options Exchange and at a top tier options trading company from 1999 - 2012. You can follow Jacob on Twitter.

There are no comments to display.
Join the conversation
You can post now and register later. If you have an account, sign in now to post with your account.
Note: Your post will require moderator approval before it will be visible.