
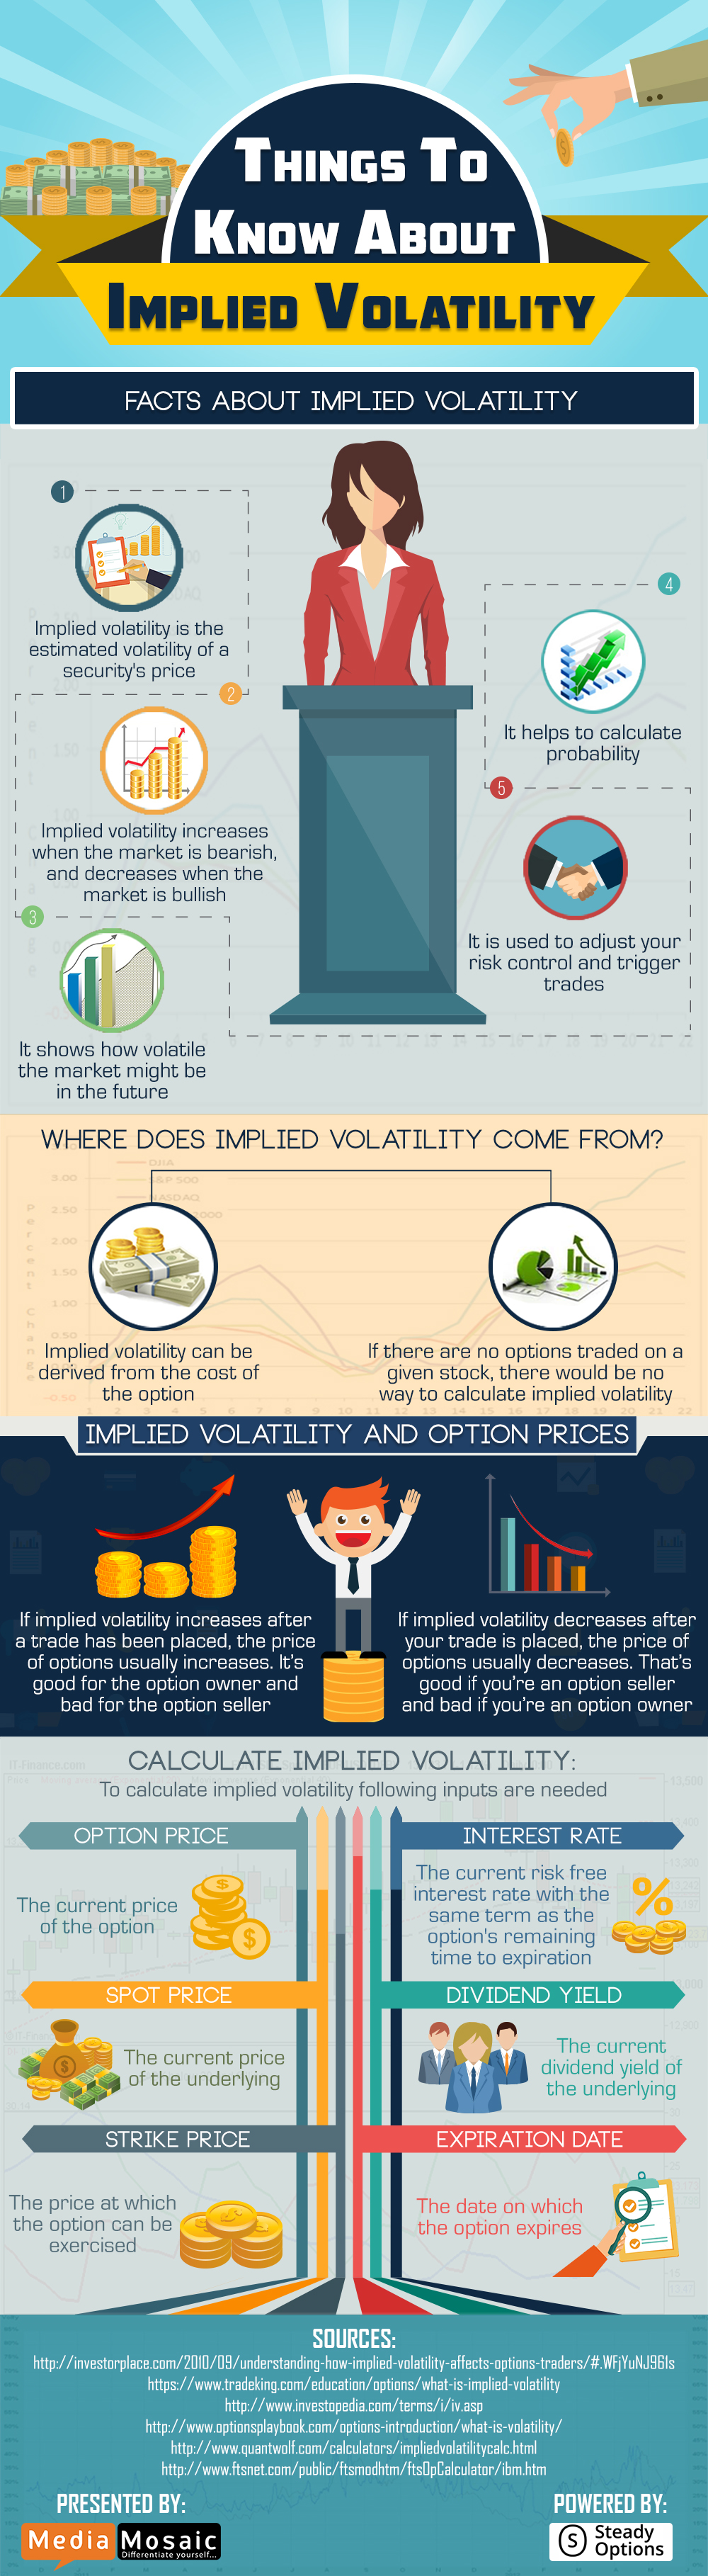
Implied volatility increases when the market is bearish. On the other hand, it decreases when the market is bullish.
Implied volatility can be derived from the cost of the option. If there are no options traded on a given stock, there would be no way to calculate implied volatility. If there is an increase in implied volatility after a trade has been placed, the price of options generally increases. This is good for the option owner whereas bad for the option seller. If implied volatility decreases after the trade is placed, the price of options also decreases. This is good for the option seller and bad for the option owner.
In order to know more about implied volatility, please refer the given infographic.


Create an account or sign in to comment
You need to be a member in order to leave a comment
Create an account
Sign up for a new account. It's easy and free!
Register a new account
Sign in
Already have an account? Sign in here.
Sign In Now