
Fat tails can be graphed to show that tails are greater than normal distribution. On the well-known bell curve, probability of outcomes are most likely to occur at mid-range, with less likelihood in the tails, which are even on both sides. A fat tail graph shows that either declines or increases are higher than the expectation of this curve.
These fatter probability masses throw the entire theory into chaos, but it also reflects what often turns out to be the reality. It is comforting to believe that normal distribution will occur, but while it is likely, it is not always the case.
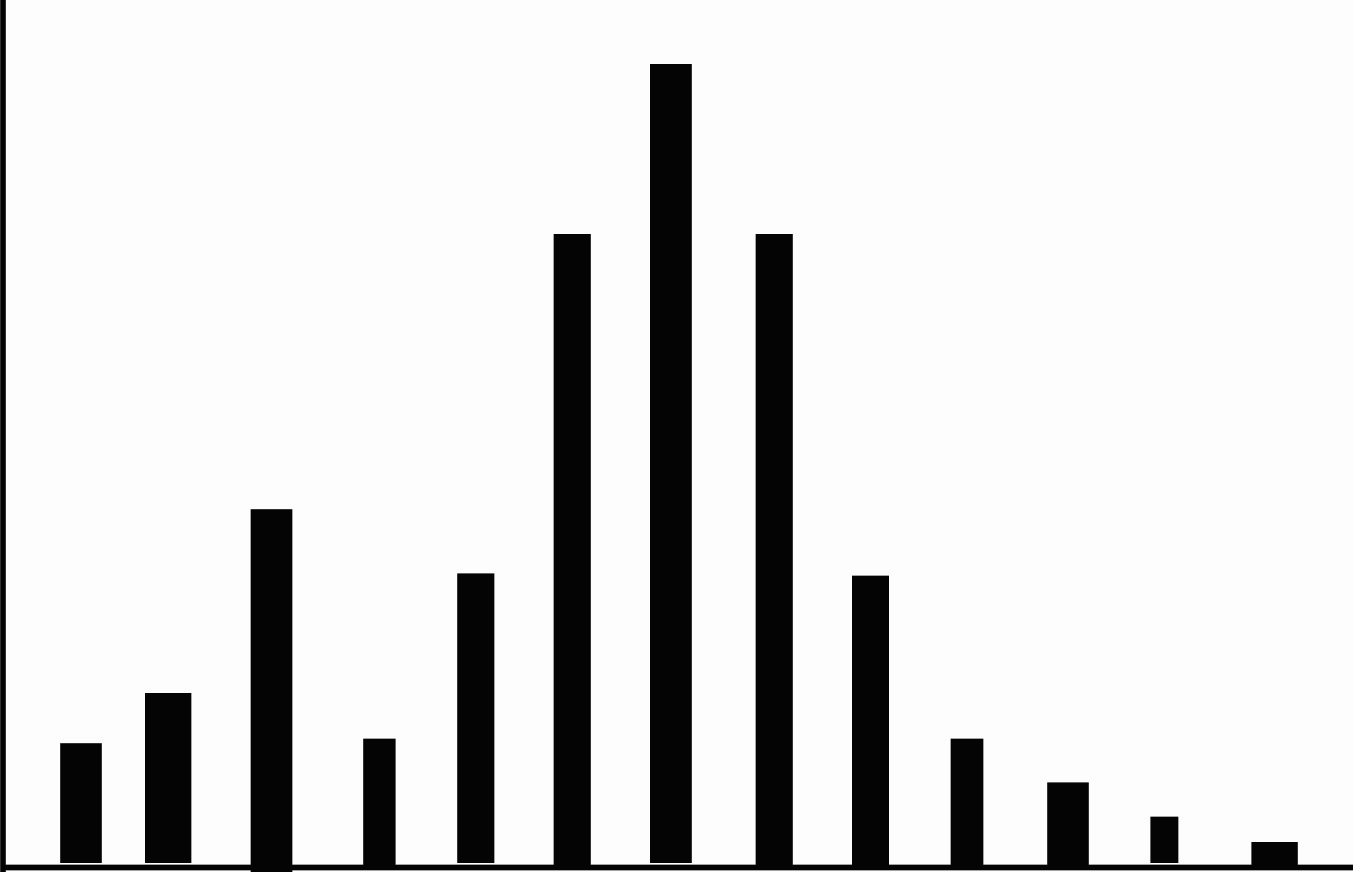
A fat tail may be subtle but important. The degree of change from normal distribution might be small, but in terms of net returns, it can significantly affect outcomes of trades. For example, the illustration shows how a set of fail tail distributions might appear. The normal distribution would be even on both sides, declining as the tails expand. In the fat tail version, the outcome reveals larger than normal losses (on the left) compared to normal profit distribution (on the right).
From the point of view of risk analysis, this type of distribution can help in identifying likely volatility on one side or the other. Volatility is best understood as the likely degree of change, but it does not identify whether that degree is going to increase or decrease price. It does identify the risk of change. Based on historical data for a particular underlying and its historical volatility, traders can equate fat tail analysis to likely option performance. Of course, this is all based on estimates of future volatility derived from the past.
A detailed analysis of how fat tail graphing works out in the real world would require many examples, and most traders do not have the automated tools to perform such detailed studies. It also raises the question of whether analysis of past price behavior is instructive enough to indicate a smart trade choice. In fact, it cannot be the case, because the past is only one pattern, but price distribution can take many forms and will be based on many, many factors. The occurrence of fat tails is more realistic than standard deviation, assuming a trader can rely on the proper side of the graph (positive or negative) and on whether all the mitigating factors are known and understood (they cannot be because there are potentially so many, and they do not apply in every situation).
An example of the unreliability of fat tail calculation can be found in analysis of earnings surprises. Traders are known to time trades based on assumptions about (a) whether surprises will occur and in which direction, (b) how large the difference will be between expected and actual earnings, and (c) the level of reaction for underlying and option prices.
Given the possibility that ‘a’ and ‘b’ are correctly estimated, the effect of ‘c’ cannot be known. An underlying security might experience identical earnings surprises in two consecutive quarters, both positive, and both about 10% above estimates. Even so, the underlying and option changes are different in each case. In the first of the two quarters, the underlying gains 6 points; in the second, it loses 2 points.
These differences occur for an infinite number of reasons. Investor and trader perception of value might have changed between the two periods. Management guidance about the coming year might be dissimilar as well. And finally, an unknown number of outside causes affect price in any given moment, so it is not realistic to expect the underlying or the options to behave in a similar manner.
In a perfect world, the distribution of returns would predict how option premium would change as the result of an earnings surprise. In the real world, this is not possible or reliable. Traders constantly seek some form of reassurance that with the right statistical tools and analysis, trade profits can be improved consistently. Everyone who has been trading for even a few months knows that this is not realistic. Too many factors are in play.
A bell curve for expected price behavior at the time of earnings reports could reflect how prices might respond to degrees of earnings surprises. This could be a revealing exercise, if a trader correctly predicts the degree of surprise and the direction (positive or negative). The normal distribution of the bell curve could then predict likely option premium reactions to the plotted level of surprise. However, many additional factors beyond the underlying will influence the reliability of this. These factors include bid/ask spread, time remaining to expiration for each option contract, moneyness of the strike selected, open interest, delta and gamma, and that “unknown” factor that causes some options to behave predictably, and others to reveal fat tail behavior.
The use of bell curves with either normal distribution or fat tails is also limited in usefulness. For studies of finite possible outcomes (such as whether a consumer will but product A, B or C), the study of distribution is reliable. For the analysis of option returns, there are simply too many possibilities, making it an infinite range of possibilities. In fact, analysis could even reveal that just about every option return will be found to have fat tails, because “normal” distribution is too vague to be applied with confidence.
In summary, when the outcomes are infinite (or at least appear to be), the fat tail analysis is not going to reveal much beyond guesswork. Some traders are infatuated with statistical analysis using fat tails and expected returns, but it simply is not possible to develop a consistent or reliable result. Even if you know in advance the exact direction and degree of an earnings surprise, there are still enough variables in play to make the probability analysis a poor method for picking and timing trades.
Michael C. Thomsett is a widely published author with over 80 business and investing books, including the best-selling Getting Started in Options, coming out in its 10th edition later this year. He also wrote the recently released The Mathematics of Options. Thomsett is a frequent speaker at trade shows and blogs on his website at Thomsett Publishing as well as on Seeking Alpha, LinkedIn, Twitter and Facebook.


There are no comments to display.
Join the conversation
You can post now and register later. If you have an account, sign in now to post with your account.
Note: Your post will require moderator approval before it will be visible.