SteadyOptions is an options trading forum where you can find solutions from top options traders. Join Us!
We’ve all been there… researching options strategies and unable to find the answers we’re looking for. SteadyOptions has your solution.
Search the Community
Showing results for tags 'aapl'.
-
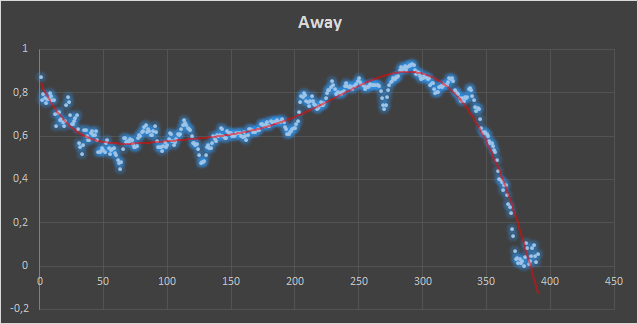
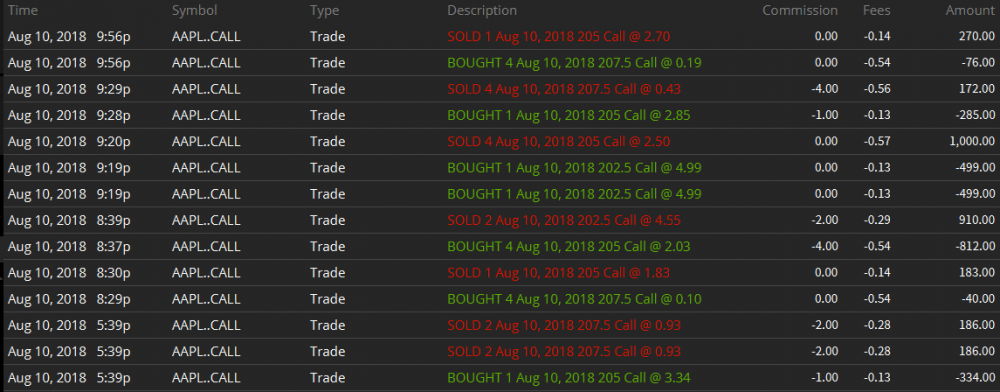
What drew me to this site was Kim professing to apply strategies or trading philosophies as set out in Jeff Augen's books. Besides many things posted on here he also devoted some chapters to stock pinning, i.e. on expiration some stocks tend to gravitate towards a particular strike price. AAPL was and is an example of a stock that often pins to a strike. Jeff did his research on 3rd Friday expiries but I thought to test his theory today for a bit of fun. The actual pinning effect is something I verified by charting minute by minute quotes for AAPL over two years. You get charts like these: Here you see the stock quote from March last year with the Y axis showing how far ($) away from the closest option strike the stock was and the X axis the number of minutes since trading started that day. This plunging chart is very frequent with AAPL as - from the stocks I was able to acquire minute by minute data from - it is the stock that most consistently shows this behaviour - it only failed twice in two years roughly (based on 3rd Friday expiries). Anyway I could never make use of this with my European broker because profits are small and trading is frequent - with minimum 36$ to open and close a position this wasnt feasible. Now I switched to a US broker this became a possibility. So for fun I tried this today on a non 3rd Friday expiry and I can say AAPL duly obliged: I picked up the trading at 11.40 AM EST - you can start earlier but this is usually a midday lull that creates a stable time to open your position. The strategy is to use ratio trades to make profits on low capital investment. The stock was around 208.40$ and in line with the strategy we guessed that 207.50$ mark would be the close hence OB 1 C 205 @ 3.34$ and OS 4 C 202.50 @ 0.93$ for a net credit. The stock duly obliged and tumbled; in fact below 207.50$ to 206.80$ or so by which time I closed the trade. Now we retained the theory that at close it would be 207.50 so this time we did a different ratio and sold the 2 C 202.50 @ 4.55$ and bought 4 C 205 @ 2.03 again for a net credit. AAPL proved particularly tractable and by 4.20 PM EST it was trading around 207.85$ so we closed. The 0.40$ credit on the 207.50$ calls beckoned again. Therefore we repeated the setup of the morning except this time of course the trade was a net debit. I watched smugly as AAPL duly converged back down to the strike price - with 9 minutes till session close I was reckoning to close at the last minute. Except... my internet went down at that moment with 4 ITM shorts! Slight panic - router reboot and thank goodness Internet worked again (ouf!) I closed out immediately just in case another gremlin would be thrown up. In doing so I gave up a little profit as AAPL closed at 207.53 $ like a champ of pinning. Profit from all this excitement: $ 362 after commissions - the capital outlay was never more than 2K (but this is a slight cheat because I have an AAPL long position in my portfolio) - anyway 18% in the day and a good bit of fun with a slightly unpleasant bit of excitement toward the end!
-
Here it is -- a portfolio of FAANG stocks using pre-earnings trading. A 3:30 video that is staggering and includes some robustness testing. Reminder that you can sign up for Trade Machine as a Steady Options member here: https://cmlviz.com/register/cml-trademachine-49-mo-promotion-so/
-
Trading options pre-earnings -- 1 minute 25 second video. (example: $AAPL) As a Steady Options member, you can get a promotional price, here: Try the Back-tester
-
In one of my previous articles I described a study done by tastytrade, claiming that buying premium before earnings does not work. The title of the study was "We Put The Nail In The Coffin On "Buying Premium Prior To Earnings". I demonstrated that their study was highly flawed, for several reasons (strikes selection, stocks selection, timing etc.) It seems that they did now another study, claiming to get similar results. Click here to view the article
-
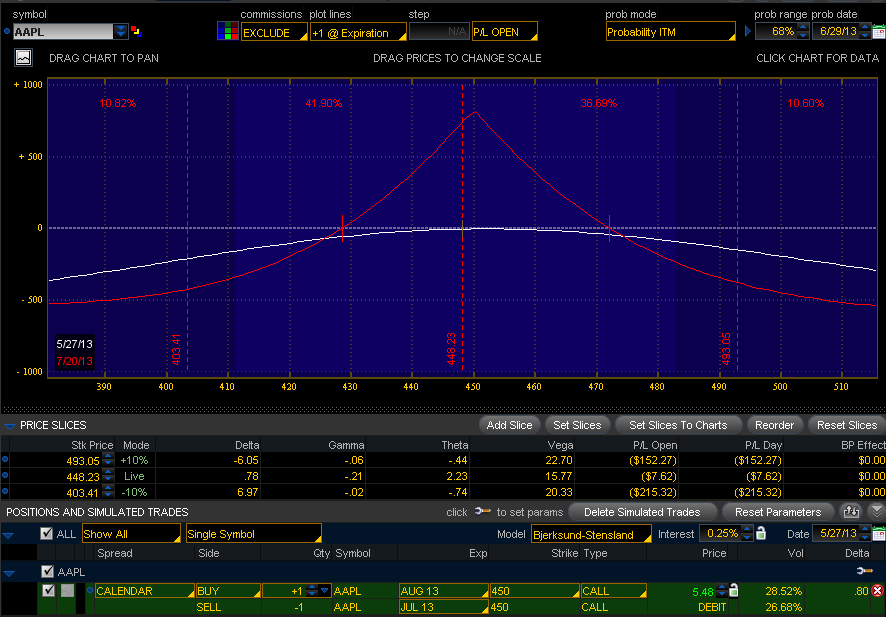
I'm looking to add some positive theta to the portfolio. Looking at AAPL, we can see that it is stuck in the 430-470 range in the last few weeks. I don't see any catalyst that will take it much higher or much lower before the next earnings. I'm looking to enter the August/July 450 call calendar, currently trading around 5.50. This is a trade that will do best if there is not much movement between now and July expiry. Since August captures earnings, the options will hold value much better than July as time goes by in the next month. The IV of August options is still pretty low at 28% and it expected to increase as we get closer to earnings. VXAPL which is AAPL volatility index is at 27.30 which is very low compared to historical levels. The time frame for this trade is around 2-4 weeks and the profit target is 20-30%. I'm planning entering in the next few days. We did a similar trade 3 months ago and closed it for 25.7% gain. This time the IV is even lower and it should benefit the trade. P/L chart is attached.
-
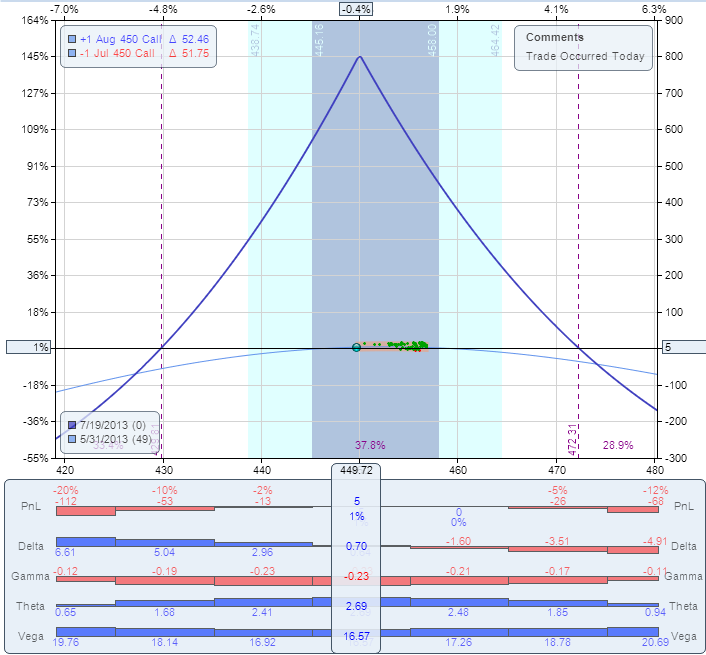
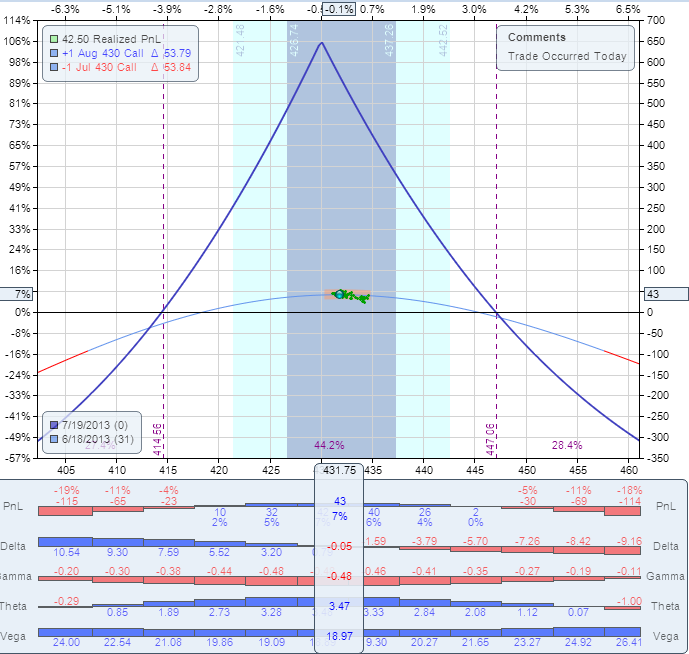
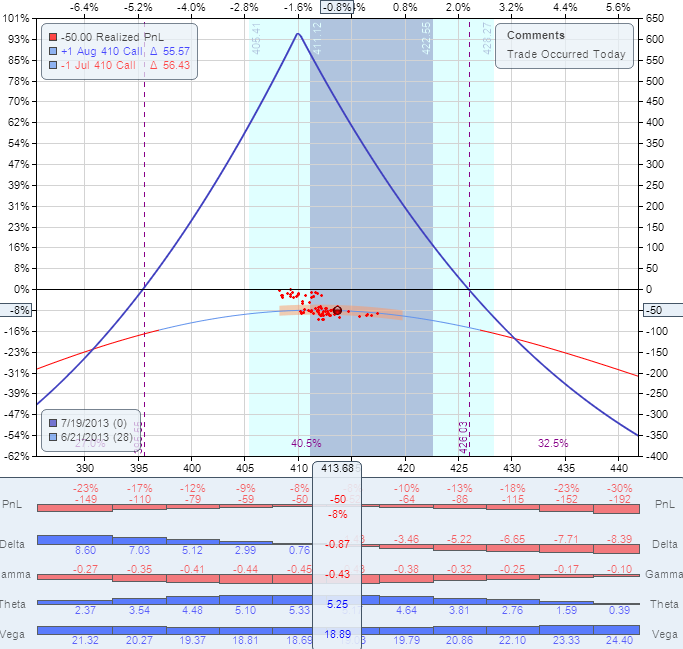
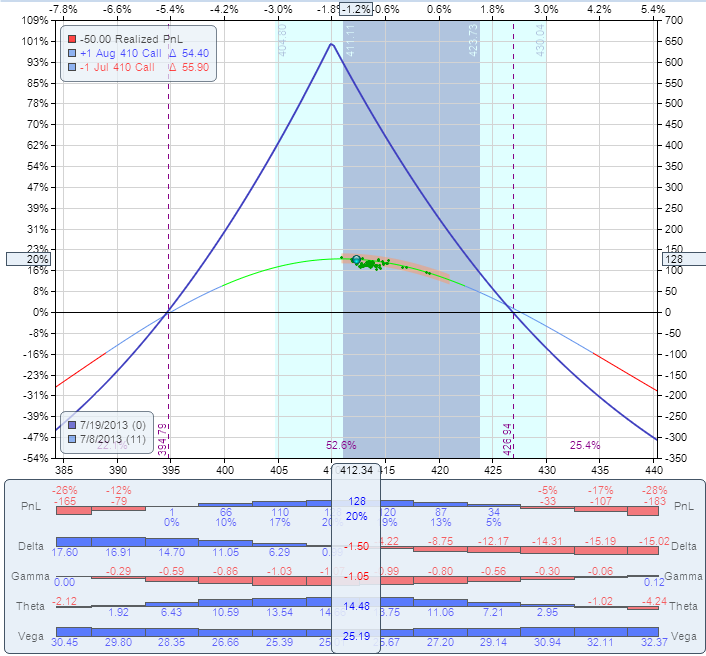
I usually don't do post-mortem on our trades - most of them are short term, we are in the trade just few days, close them and move on. However, this trade is worth to do a post-mortem so we all can learn from it. Background: When we trade a calendar spread, we have two Greeks working for us: the Theta (time decay) and the Vega (IV). We have one Greek working against us: the Gamma (stock movement). The trade makes money if the stock stays in the range and IV does not decline. It can lose if the stock moves, but even if the stock doesn't move, IV decline can kill the trade. The AAPL trade was opened on May 31 and structured in the following way: Buy to open AAPL August 16 2013 450 call Sell to open AAPL July 19 450 call Price: $5.50 debit. The P/L chart looked like this: Since AAPL is scheduled to report earnings on July 23, the long options expire after earnings and they were expected to hold value. The IV of August options was around 27% which is pretty low. It was expected to rise as we get closer to earnings. Fast forward to June 18. The stock is trading slightly below 430. The trade was up ~6% at this point. This is our adjustment point. The correct action was to roll the trade to 430 strike, by selling the 450 calendar and buying the 430 calendar, same expiration. The roll would cost $0.75. The new P/L chart would look like this: Fast forward to June 21. The stock is trading around 413. The trade was down ~8% at this point. This is our second adjustment point. The correct action was to roll the trade to 410 strike, by selling the 430 calendar and buying the 410 calendar, same expiration. The roll would cost $0.30. The new P/L chart would look like this: The stock continued drifting lower, but it did not reach the next adjustment point. After briefly going below $400, it reversed and came back to $412 on July 8 and could be closed for 20% gain: Why didn't we do it and what can be learned here? When the stock reached $425, I estimated that it is oversold and is not going much lower. The IV of August options was still at very low levels. I expected it to start rising as we get closer to earnings. The IV rise would at least partially offset the gamma losses. It did not happen. In fact, today the IV of August options is still around 29% which never happened. The IV of the monthly options before earnings was never below 35%, usually closer to 40%. To add insult to injury, when the stock reached $410, I added a "hedge" by opening a short term 410 calendar. This calendar has lost another $0.60, adding to the overall loss. It also increased the overall investment by almost 40%. This was throwing good money after bad. After the stock recovered to $430, I had a chance to close it for breakeven, but I left it open - again, due to the expectation that IV of the August options just cannot remain that low. The trade was finally closed today for 35% loss. Few things contributed to the big loss: 1. The stock moved more than 50 points at some point which is almost 2 SD (Standard Deviations). 2. The IV of the long options was almost unchanged before earnings which is extremely unusual. 3. The "hedge" added to the loss". 4. The trade was not adjusted in time. Expecting the IV to rise was a reasonable expectation. It did not happen, but there was a high probability that it will. We trade probabilities. There is a big difference between probability and certainty. There was a high probability that IV will not stay that low, based on historical patterns. However, high probability is still not certainty, and IV did not rise as I expected. When something happens few cycles in a row, we have a reasonable expectation that it will happen again. We trade based on those expectations, but we know that patterns not always repeat. In this trade, the main mistake was not expecting the IV rise - the main mistake was not to adjust when the price got to the adjustment point. The trade was actually up 12% after few days, and some members closed it for a gain. My original profit target was 20-25%. I don't think it was a mistake not to take profits at 12%. While there is nothing wrong to set a 10% target on those trades, I like to set higher profit targets, based on my experience with those trades. The bottom line is that despite the unfavorable conditions, with proper management we could still make 15-20% on this trade. The main lesson from this trade: When trading non-directional strategies, never let your opinion affect the trade. Always follow the rules, adjust in time, no matter how oversold or overbought the stock looks.
-
In the realm of sounding like a complete hypocrite -- I just entered an AAPL calendar. With the lower volatility over the last 10 days, it actually fit my model perfectly. The trade: Bought July 21 560 Call @34.83 Sold May 19 560 Call @12.98 I particularly like this trade as it has so much time left in it and stands a very real chance of paying for itself in the next two weeks. AAPL is consolidating around 560, and with the trend down, I moved down 2 strikes to give me some flex room on the declining price. However, even with a 20pt jump up, I can still expect to be getting close to $2.00 per week. With 10 weeks left in the trade (I DONT plan on holding that long), that would still make it worth it. However, a word of caution, AAPL is a MUCH more volatile stock at heart, and this one bears close watching. It is a higher risk trade and should be treated as such. (I weight high risk trades differently than lower risk trades -- one half a position size). The other trade I'm going to look at over the weekend is the AAPL DITM leap trade. I'll post a full anlaysis of this calendar over the weekend.
-
I just entered a weekly IC on AAPL: AAPL @ 567 560/565/570/575 IC filled at $4.10 Maximum profit, 21.95% on AAPL moving $7.00 or more. Busy getting weekly trades in, will fill in with more detail later.

