samerh
-
Posts
126 -
Joined
-
Last visited
Content Type
Profiles
SteadyOptions Trading Blog
Forums
Everything posted by samerh
-
Jeff Augen's StandardDEV study for ToS (thinkscript)
samerh replied to Mikael's topic in General Board
Garry - I think your analysis is great, thanks for taking the time! I think that small sample size could indeed be an issue, because better returns were also generated at 0.8 and 1.1 quotients, but that restricts the number of trades and leads to a lot of missed opportunities. Like you I feel it's interesting but needs some refinement. -
Jeff Augen's StandardDEV study for ToS (thinkscript)
samerh replied to Mikael's topic in General Board
Source is Ivolatility. I download their RAWIV data which gives option values, IV and greeks. I have a filemaker database which simply finds the straddle price, greeks and IV 5 days before earnings and day of earnings. I then put into a spreadsheet to calculate the results table which I posted above. Costs me about $30 per stock for 2.5 years worth of data. -
Jeff Augen's StandardDEV study for ToS (thinkscript)
samerh replied to Mikael's topic in General Board
Richard - I got end of day data from ivolatility -
I saw a presentation on calendars by Himanchu Raval (learned from Dan Sheridan, apparently one of his best students on calendars). Some of his criteria: ◦ Low Volatility environments – preferably the IV of the underlying should be in the bottom one-third of the range of the last 6 months. ◦ Initiate these trades after a couple of up days when the IV has dropped a bit. ◦ The trade can be started anywhere from 45 days to expiration down to 7 days for the weeklies ◦ The back month option need not be the very next month. It can be up to 4 – 6 months further out in time. ◦The Skew is the difference between the IV of the front month strike and the back month strike. Want this to be positive (but not too much) or we want this to be more or less flat (close to zero). If the back month is more than a month away, then the skew should not be less than -4
-
Jeff Augen's StandardDEV study for ToS (thinkscript)
samerh replied to Mikael's topic in General Board
Any further thoughts on this? -
Jeff Augen's StandardDEV study for ToS (thinkscript)
samerh replied to Mikael's topic in General Board
I see what you mean, but I used monthlies and so I hope the results are less affected by the number of days to expiration. -
Jeff Augen's StandardDEV study for ToS (thinkscript)
samerh replied to Mikael's topic in General Board
Here is my results table. I got the data for closing prices for straddles 5 days before and 1 day before announcement, and used the ATM straddle in each case in order to account for IV gain and not gamma gain. I then organized into quartiles (losers, slight negative, slight positive and winners) and found the median statistics for each group. In the attached the table at the top left gives the quartiles summary results, with bar charts showing the same results graphically to the right. Below is a larger table with each of the 96 trades, and to the right of that is a backtest. Workbook1.zip -
Jeff Augen's StandardDEV study for ToS (thinkscript)
samerh replied to Mikael's topic in General Board
tj - Sam is fine this wasn't a script, it was a filemaker database I put together and paid a few $100 for the data to sort pick out end of day options prices for straddles during last 7 earnings cycles. -
Jeff Augen's StandardDEV study for ToS (thinkscript)
samerh replied to Mikael's topic in General Board
I did both. results slightly better for last move than for average move. My hypothesis would be that the "market" weights most recent earnings more. This was the sort of analysis I was suggesting when I commented on your "tools to analyze earnings trades" post, as I think that looking at the last few cycle's performance is a great start but dissecting reasons behind when the strategy worked and didn't is the next step. Like I say, this is not too different from the SO strategy of looking at implied move vs historical move, but adds a slight refinement of taking the IV premium over base volatility. Would love for Kim, Marco etc to tell me if this analysis holds water of if i'm force fitting the data to a preconceived theory -
Jeff Augen's StandardDEV study for ToS (thinkscript)
samerh replied to Mikael's topic in General Board
Nope: enter trade 5 days before earnings if (IV-HV)/LM indicators is <1.7, don't enter if >1.7 tested on a range of stocks with good price spike behavior (lots of >3stdev spikes around earnings) -
Jeff Augen's StandardDEV study for ToS (thinkscript)
samerh replied to Mikael's topic in General Board
yes entering into ATM straddle 5 days before and exiting on the eve of the announcement when the indicator is less than 1.7x And it works well for stock with big standard deviation prices spikes on earnings, as per Augen's book. -
Jeff Augen's StandardDEV study for ToS (thinkscript)
samerh replied to Mikael's topic in General Board
I'v done an analysis with 96 earnings on AMZN, CSCO, GMCR, WYNN, QCOM, NFLX, BIDU, YUM. (All these stocks have a high ratio of >3StDev moves to 1&2StDev moves as Augen suggests, in other words they have big price earnings spikes). I've been finding a high correlation between profitability of a monthly straddle held for 5-days and the volatility premium divided by the stock move on the day after last earnings cycle: (IV-HV20) / LM - where IV is IV of the straddle - HV20 is the 20 day historical volatility of the stock. - LM is the % move of the stock the day after earnings are announce. The relationships is not linear, if you plot profits vs indicator you don't get a straight line. However, if I group the results into quartiles, and take the median number, the correlation is striking. Quartile: Straddle P/L: - In backtesting this is accurate 70% of the time in 100 earnings trades using What I like about this indicator is that in all but 1 case, it gets you out of situations with greater that a 7% loss, and 85% of trades with profits above 5%. -
Jeff Augen's StandardDEV study for ToS (thinkscript)
samerh replied to Mikael's topic in General Board
I'v done an analysis with 96 earnings on AMZN, CSCO, GMCR, WYNN, QCOM, NFLX, BIDU, YUM. (All these stocks have a high ratio of >3StDev moves to 1&2StDev moves as Augen suggests, in other words they have big price earnings spikes). I've been finding a high correlation between profitability of a monthly straddle held for 5-days and the volatility premium divided by the stock move on the day after last earnings cycle: (IV-HV20) / LM - where IV is IV of the straddle - HV20 is the 20 day historical volatility of the stock. - LM is the % move of the stock the day after earnings are announce. The relationships is not linear, if you plot profits vs indicator you don't get a straight line. However, if I group the results into quartiles, and take the median number, the correlation is striking. Quartile: 1 2 3 4 P/L: -8.4% -1.8% 3.5% 11.7% Indicator: 2.1x 1.9x 1.7x 1.4x In backtesting, if you only enter a straddle when the (IV-HV)/LM ratio is under 1.7x, the indicator gets you into profitable trades 70% of the time in the 96 earnings trades. I'm further encouraged by the fact that in all but 1 case, it gets you out of situations with greater that a 7% loss, and into 85% of trades with profits above 5% (i.e. it is no so restrictive an indicator that you miss out on a lot of good trades). I will caveat all this by saying that it's only tested on a few stocks, but it cost $ to download historical option data (using ivolatility downloads). Interestingly using the last earnings move is slightly more accurate than the average move for the last 7 earnings cycles, which intuitively makes sense as one would assume that the "market" weights recent performance more. My working rationale for this, and I would be interested in people's views, is that the IV-HV gives the volatility premium over the base volatility (there is a better correlation than when just using IV) and tells you how expensive the straddle is relative to expected or implied move, and is a slight refinement of the %IM we use at SO. (PS not sure what happened but this seems to have posted three times, sorry about that). -
Thanks. I get the part about it being a play on IV. Could you please expand a little/give detail on how almost all the premium is tied to earnings and not in the time value?
-
Ice: click on the wrench icon and then you can adjust vol - I've highlighted them in the pic.

-
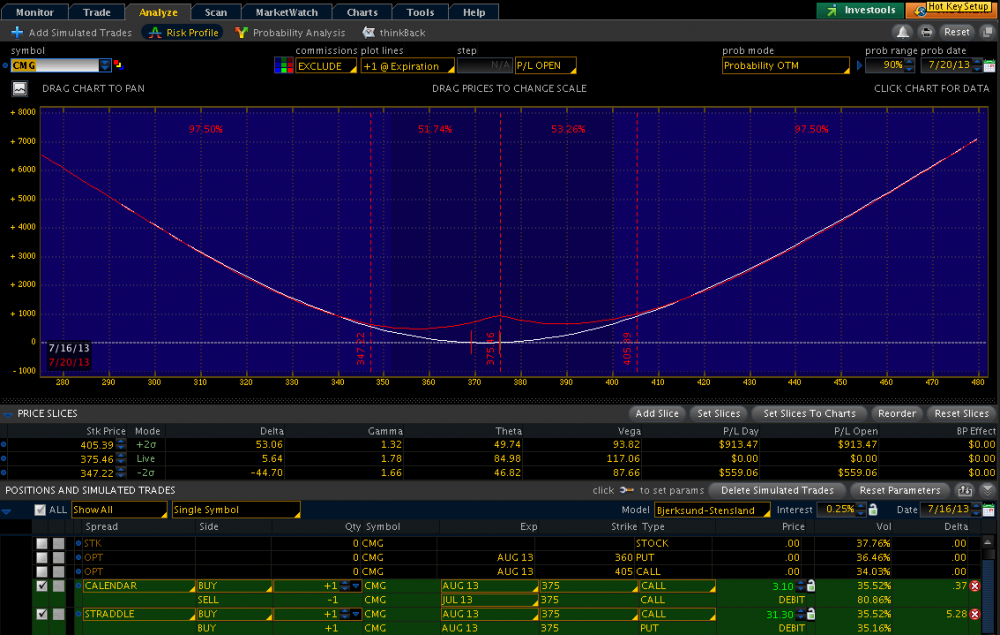
Selling before announcement just as we do with our regular straddles. To be clear - I'm sure I'm missing something, seems too easy. (for the second picture I adjusted -10%vol which isn't shown)
-
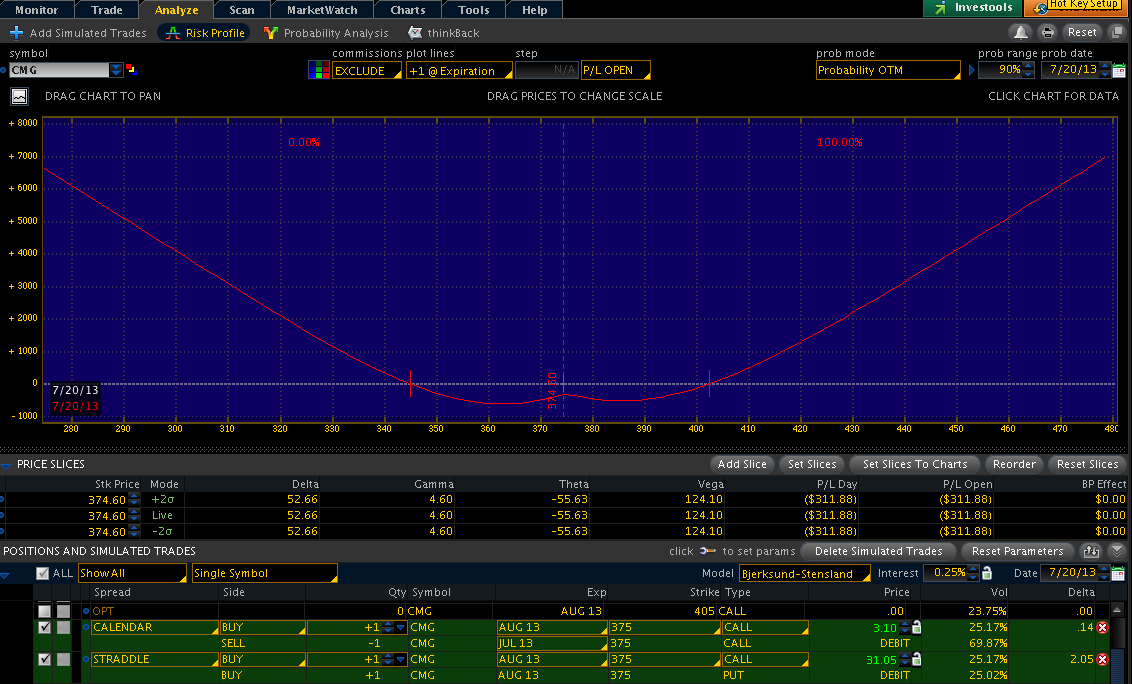
Could someone please explain to me why a calendar and straddle combo wouldn't work as an almost risk-free on an earnings play? On the assumption that there is no such thing as a free lunch - what am I missing? From the first picture, calendar and straddle on CMG, 2 days before earnings. Looking at the chart and greeks: Theta is positive so time is on your side At expiration, no parts of the graph are negative Vega is positive and as IV typically increases as we approach earnings this should also be good. I understand that if there is a significant IV drop, the whole middle part of the red line goes under (second picture), but that shouldn't happen on the run-up to earnings.

-
I suppose the biggest difference is that a, say, 2.5SD move might equate to a 5% move in a low vol environment but 10% in a high vol environment and to my understanding, straddles are priced to protect against SD moves. It's been something I've been going around for a while and would be grateful for more clarity from those more experienced/ knowledgeable than me. I'm looking at historical prices on GMCR, GOOG, PCLN, NKE to see if implied SD correlates better or worse than implied % but is been slow going. Wondering if anyone else had done this?
-
Following this thread and the main post on how to determine a good entry price for earnings, my question is do you ever also look at implied move in Standard Deviation terms to help determine a good entry price and not just % move? (The thinking being that that options prices are theoretically based on standard deviations rather than on % moves as referenced in Augen's various books). For example, say we have stock with earning coming out and the straddle we want to trade gives an implied move of $3. Can we compare this to a 1 standard deviation move calculated using some IV from a period without earnings (eg prior month, forward IV from the link that Marco reference above, or the stock's IV) to see if the straddle is priced attractively? If the $3 would only equate to a 1 standard deviation move using this metric and the stock typically moves, say, 2.5 standard deviations following earnings then $3 would be a good price. (Have spent most of the weekend going through SO posts but haven't seen a direct answer to this, forgive me if this has already been answered and I've missed it).