Alex_lon
-
Posts
163 -
Joined
-
Last visited
2 Followers

Alex_lon's Achievements
Advanced Member (4/5)
14
Reputation
-
Chartaffair.com - RV Charts & Backtesting for Steady Options
Alex_lon replied to Christof+'s topic in Promotions and Tools
Does anyone know if this service is still running? I sent a message through their contact page last week but I haven't received any response -
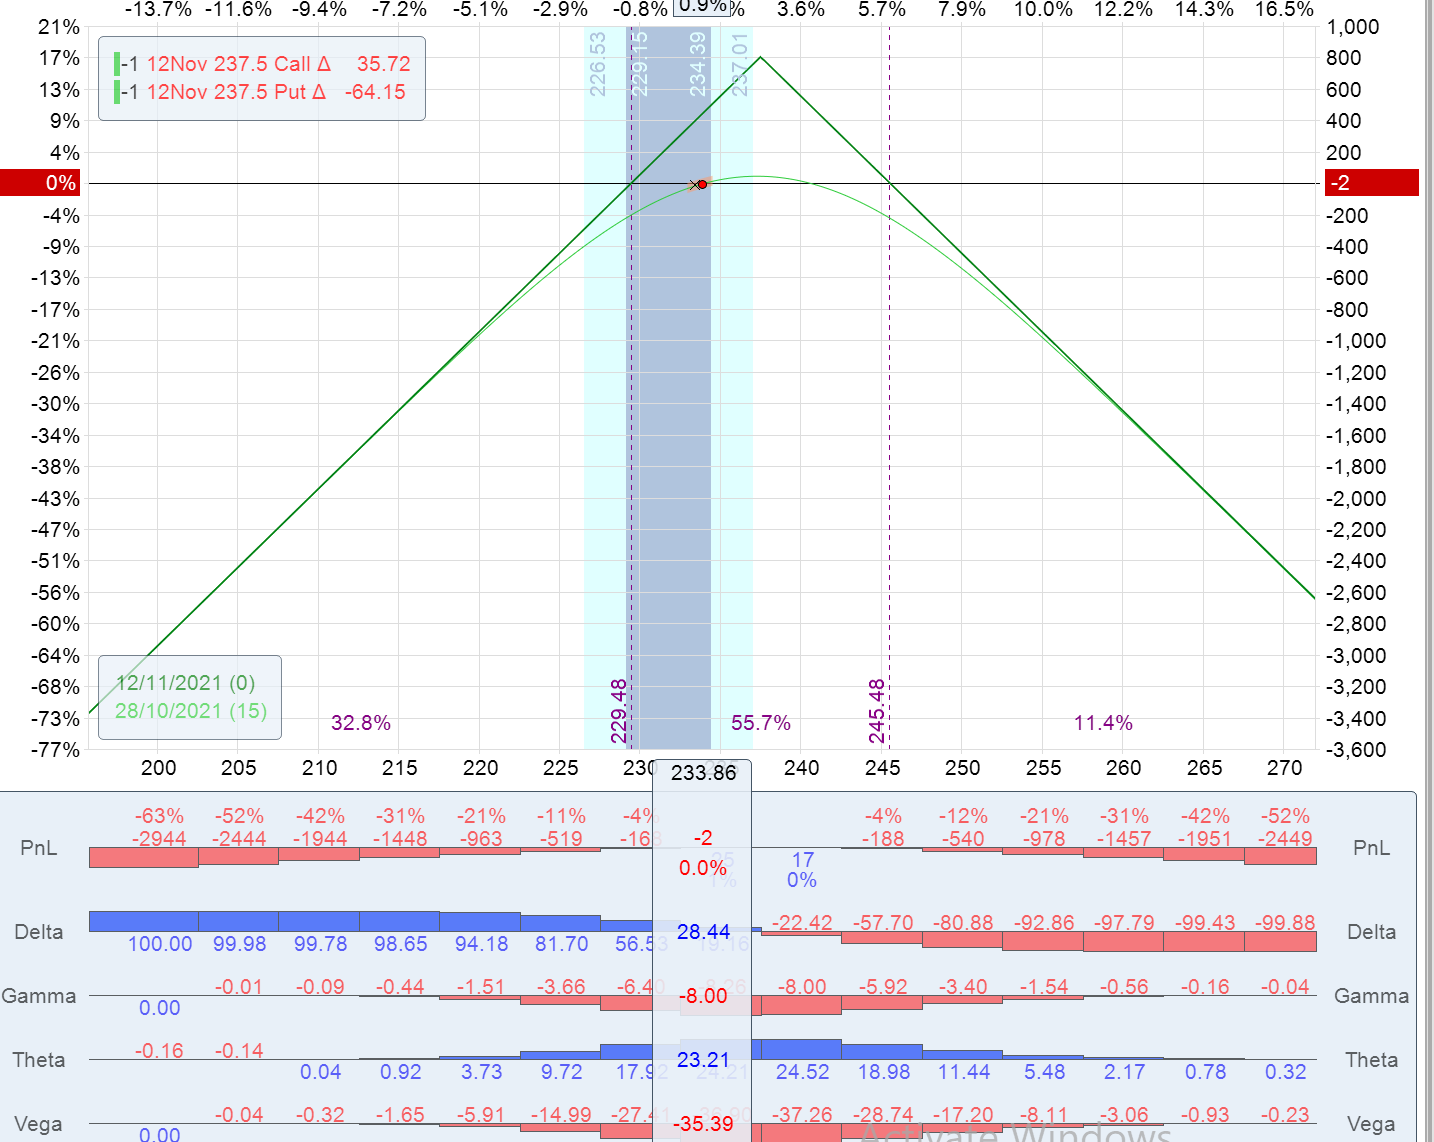
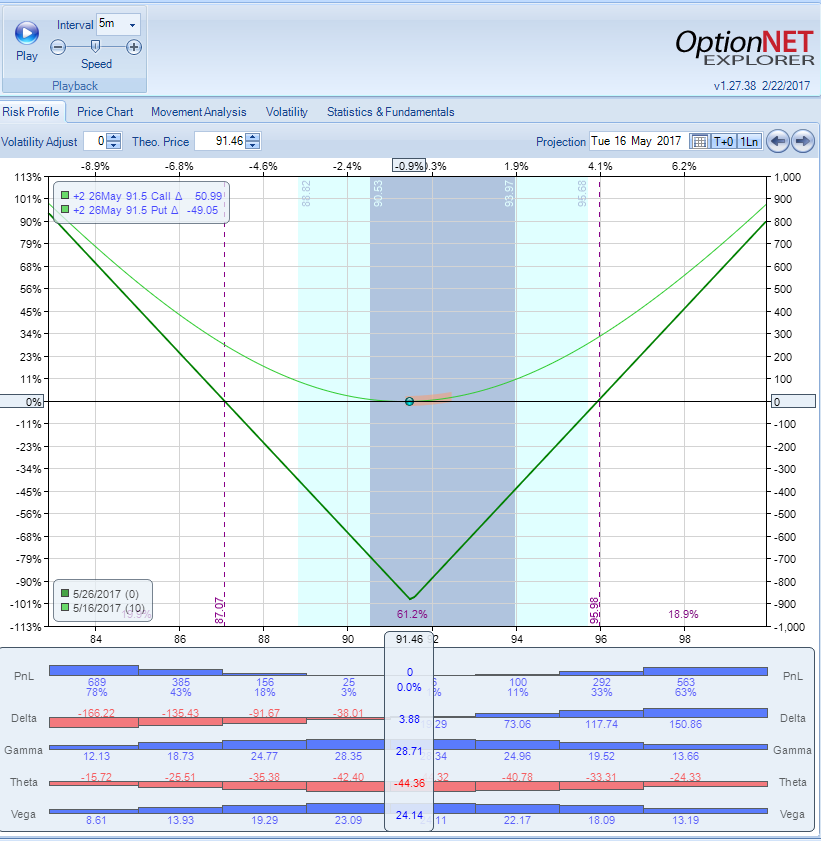
Thanks @kim and @Yowster. So in case of a short straddle (chart below) the way to interpret the bottom metrics is, as I move to the left (price decreases) delta is negative (red) indicating that the trade would benefit if the stock price was to increase (move to the right, back to the area of profit) and on the other end if the price increases to much the positive blue delta indicates that the trade would benefit if the stock price was to fall (move to the left, back to the area of profit). Is this correct? Should I give any weight to the fact that volatility (vega) is basically immaterial at the further out points (left and right)? If you don't mind, would it be possible to know what you look at in ONE? What I mean is, what metrics/indicators, analysis you do in ONE to help you to make trading decisions?

-
Hi there, quick question on ONE which I just started using, in the chart below I would expect delta to be positive across the spectrum (e.g. like gamma) as movements in the stock price will increase delta and make the trade profitable. Can someone please explain why this is not the case in the graph below? thanks
-
Thanks @TrustyJules really helpful
-
@TrustyJules ok so just to play this back to you with an example, XYZ stock is trading at $130 and the Jun 17 ATM call mid price is $10 you would buy the $140 call right? How out do you buy call (e.g. 3, 6 months) from now?
-
Thanks @TrustyJules do you usually buy ATM LEAPS and how out do you go? Do you use any criteria for potential candidates?
-
Hi @TrustyJules, I have been doing covered calls with stocks, I suppose some of the advantages are that with dividend paying stocks you get a dividend but you invest more capital, are there other reasons for doing LEAPS? Also, how do you decide the price that you sell the short options for and the expiry (e.g. DTE)? Thanks a lot
-
ok thanks
-
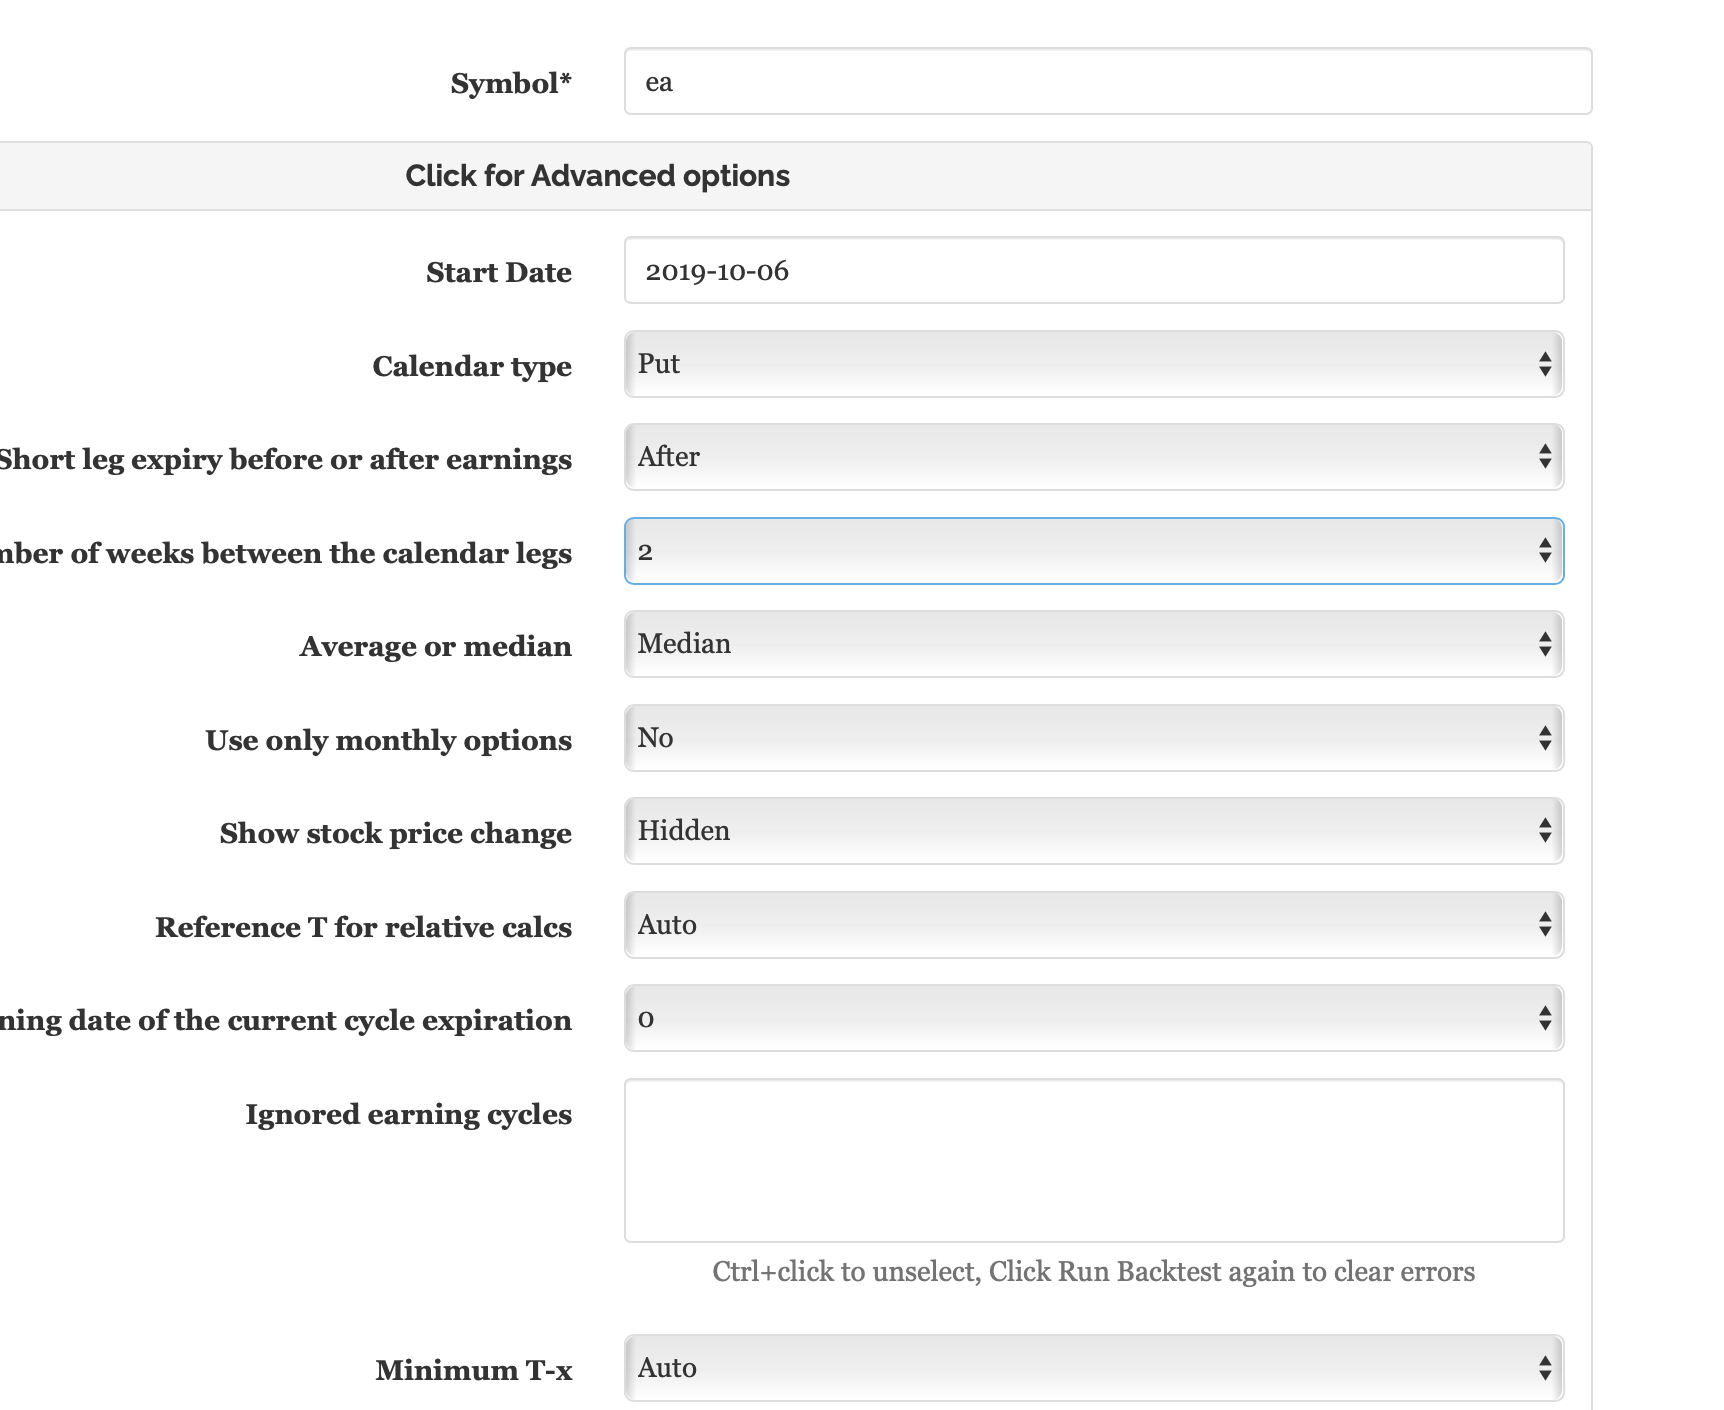
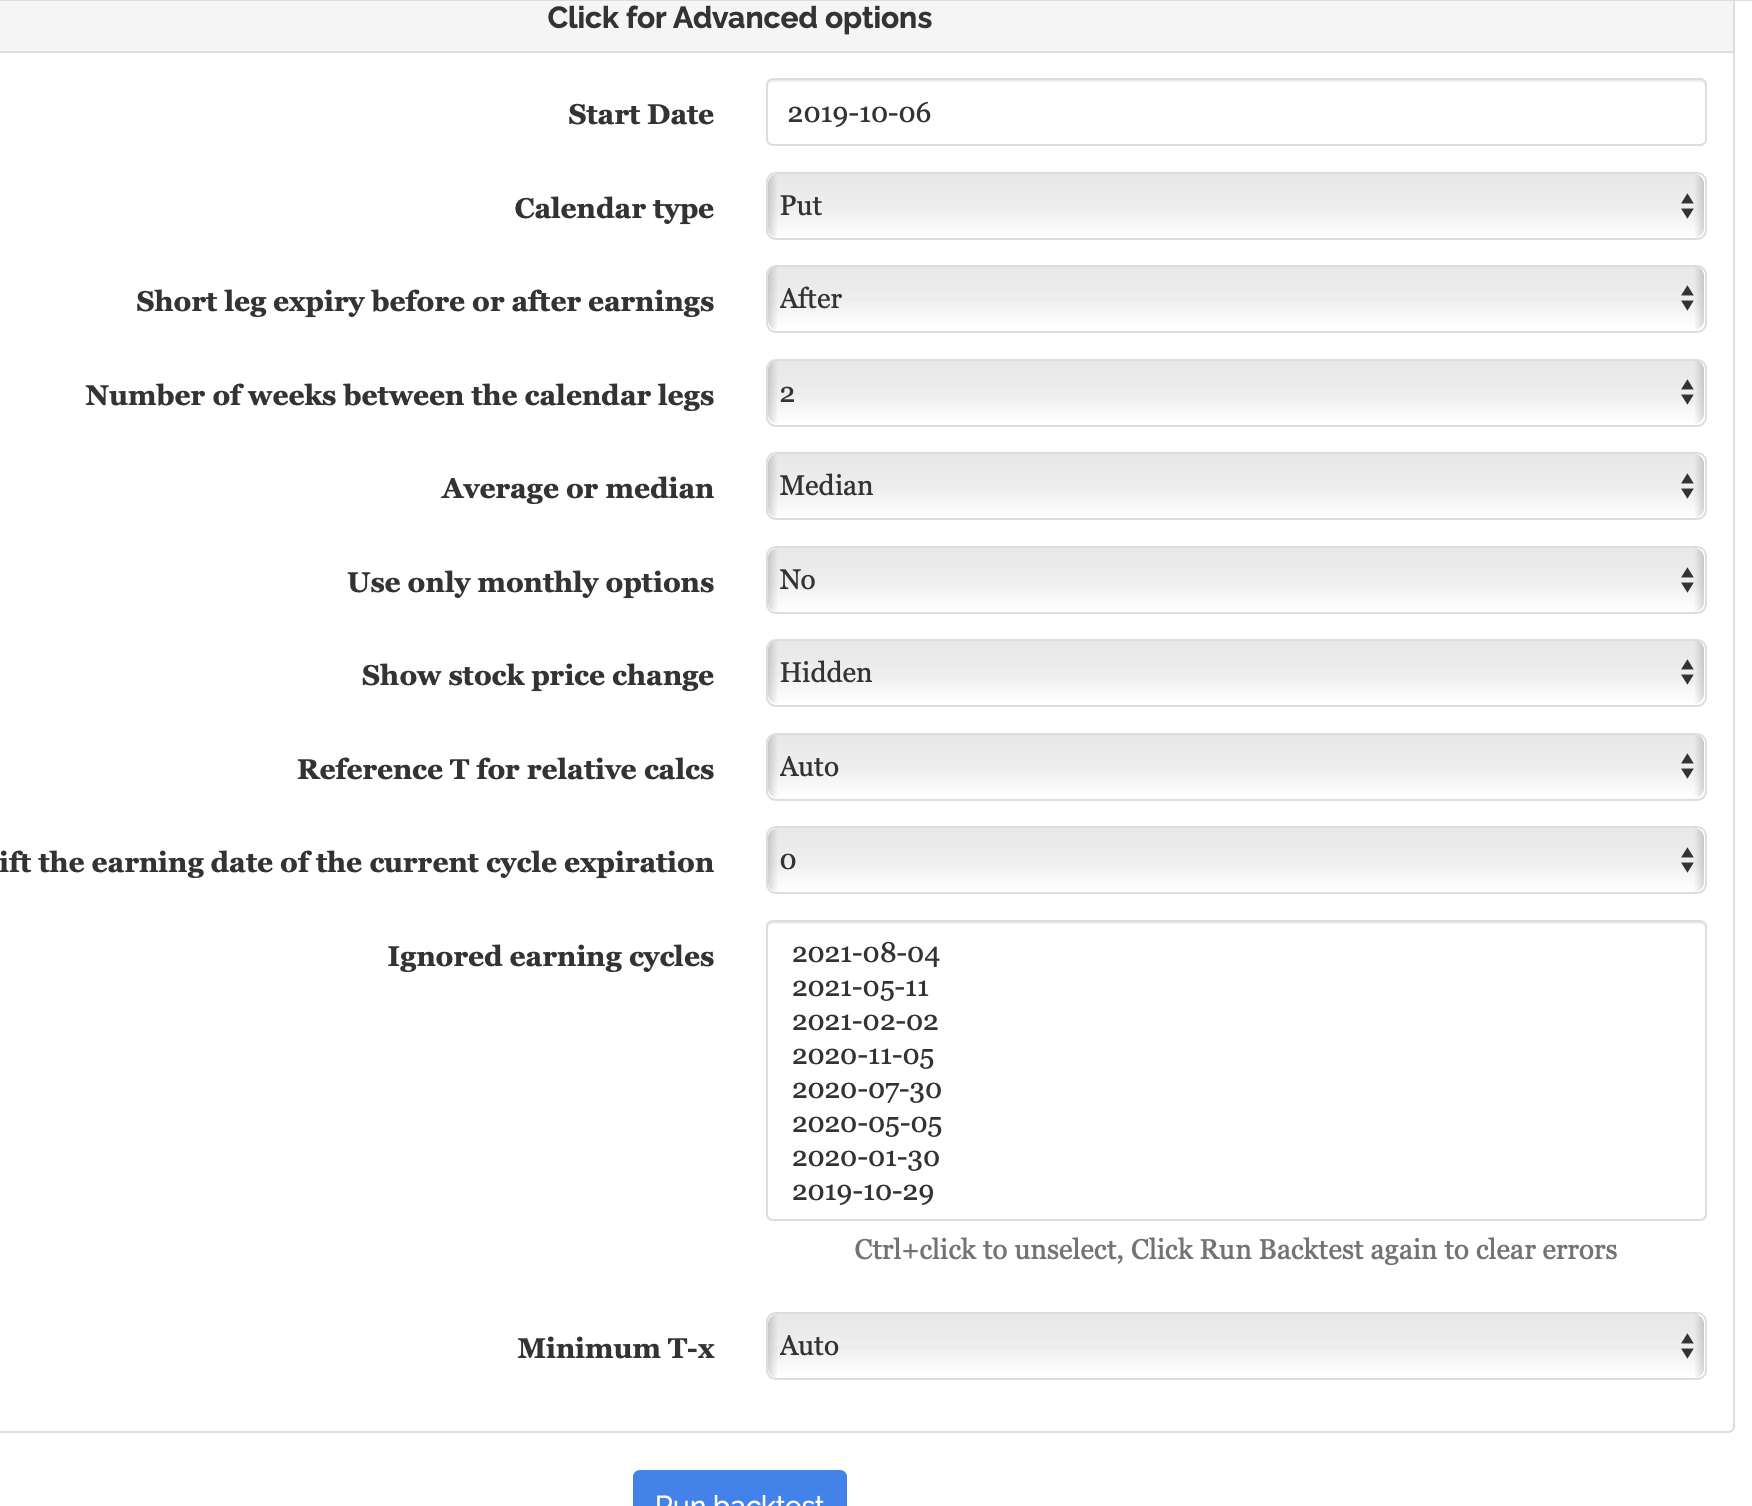
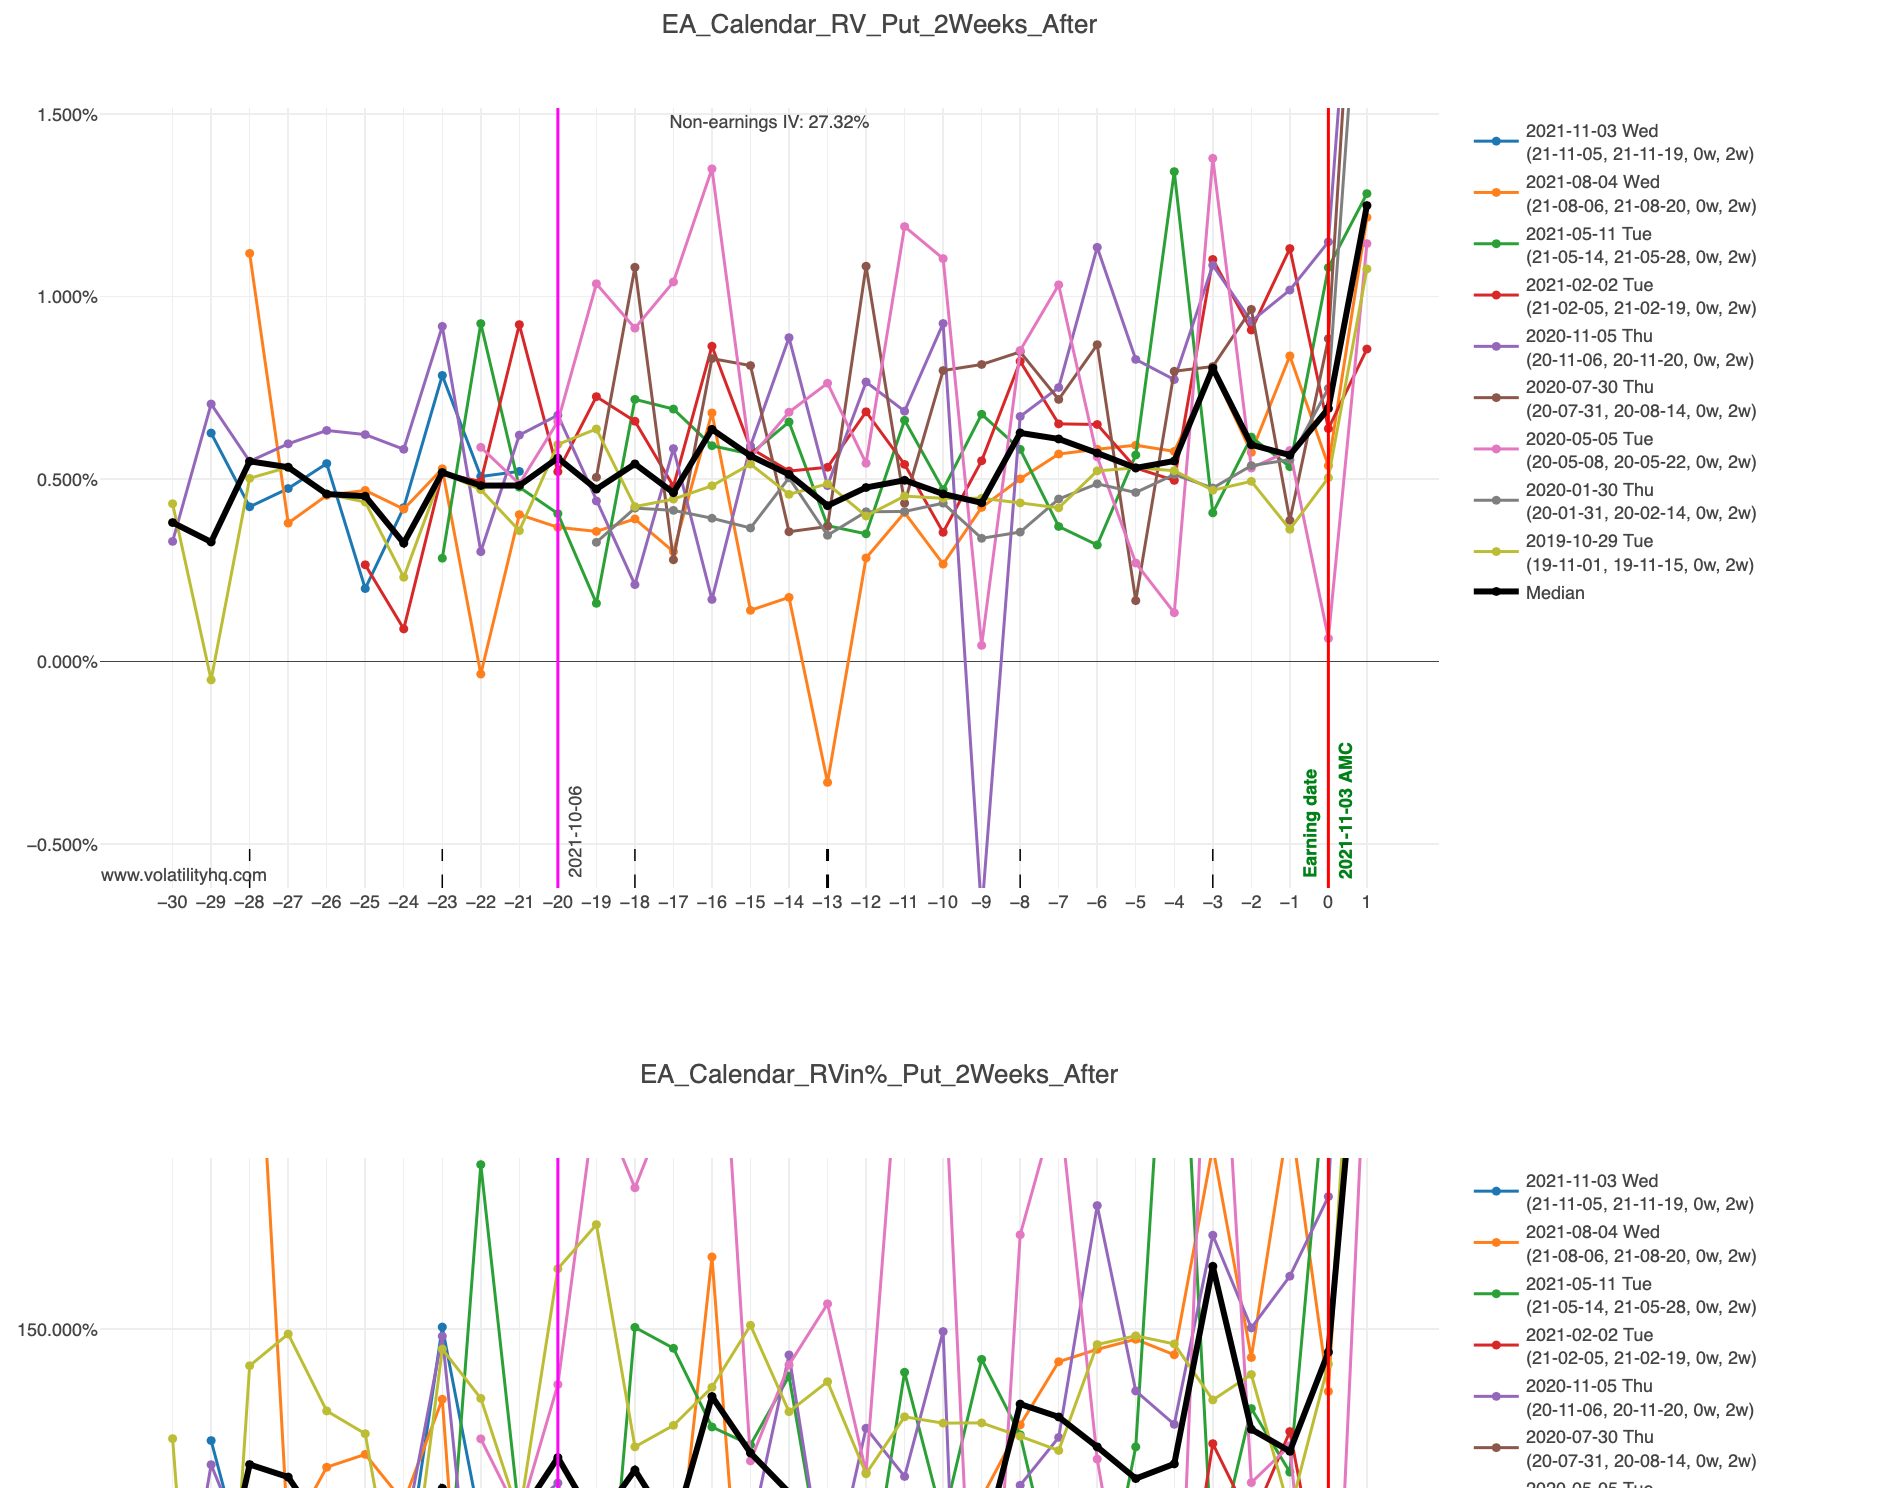
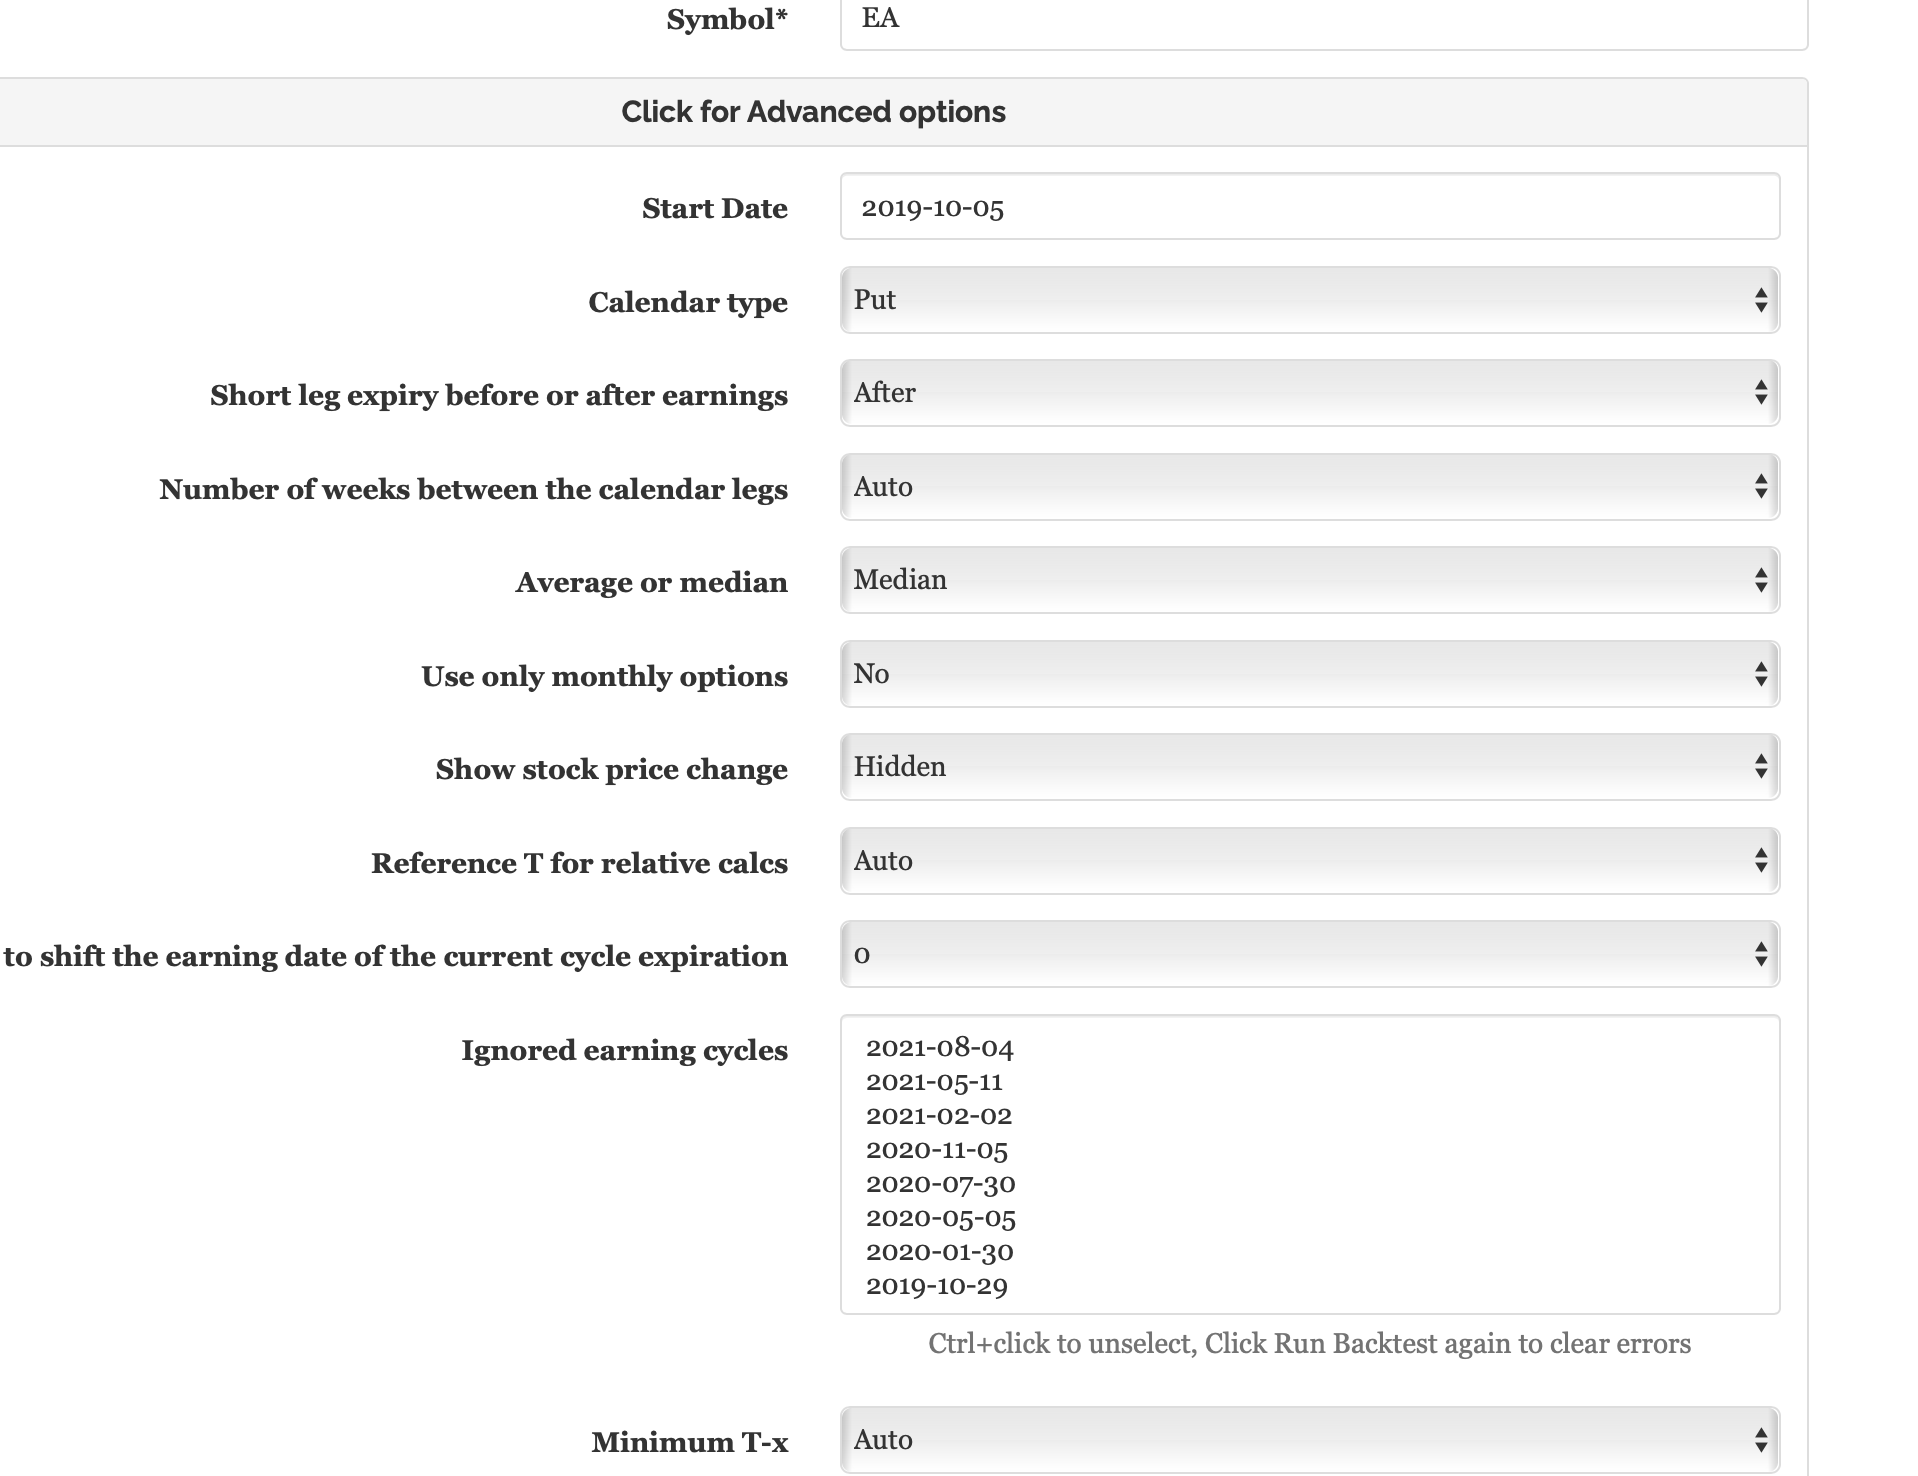
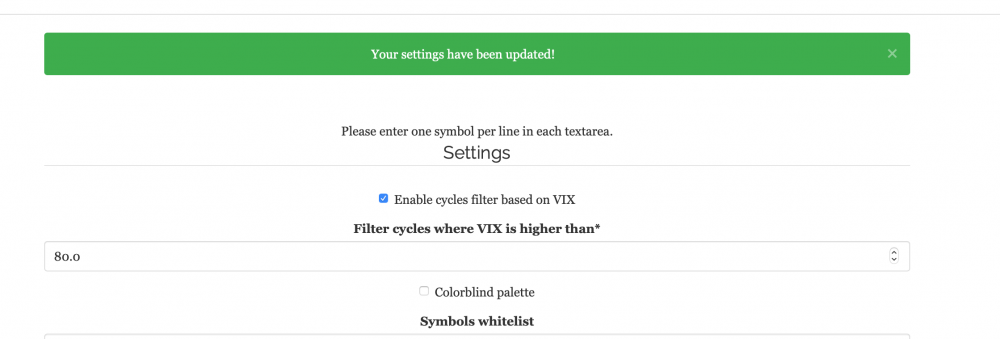
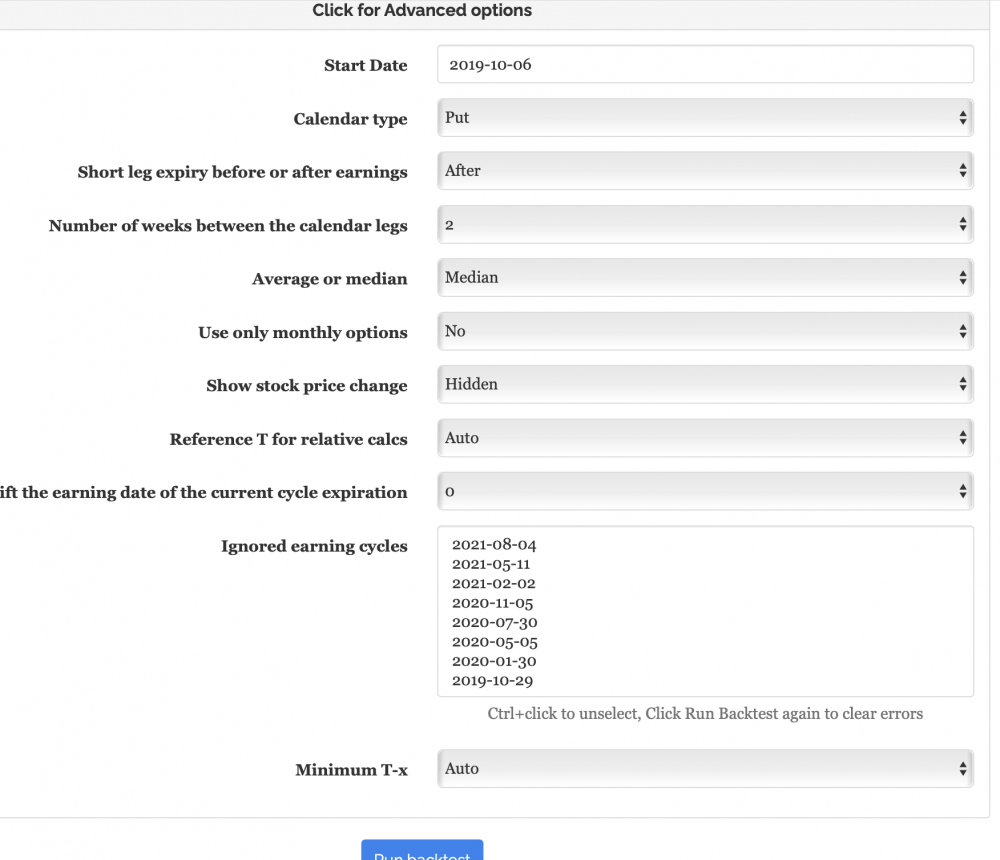
The question that I have is why I have a list of cycles that are automatically ignored after I run the backtesting?
-
Thanks. Screenshots of my settings pre and post running the back test and RV charts.


-
I try to change the settings (e.g. 40,80,150) but I get the same results (e.g. some cycles are excluded).
-
thanks @Djtux do you know why some earning cycles are automatically removed when I run backtest on EA?

-
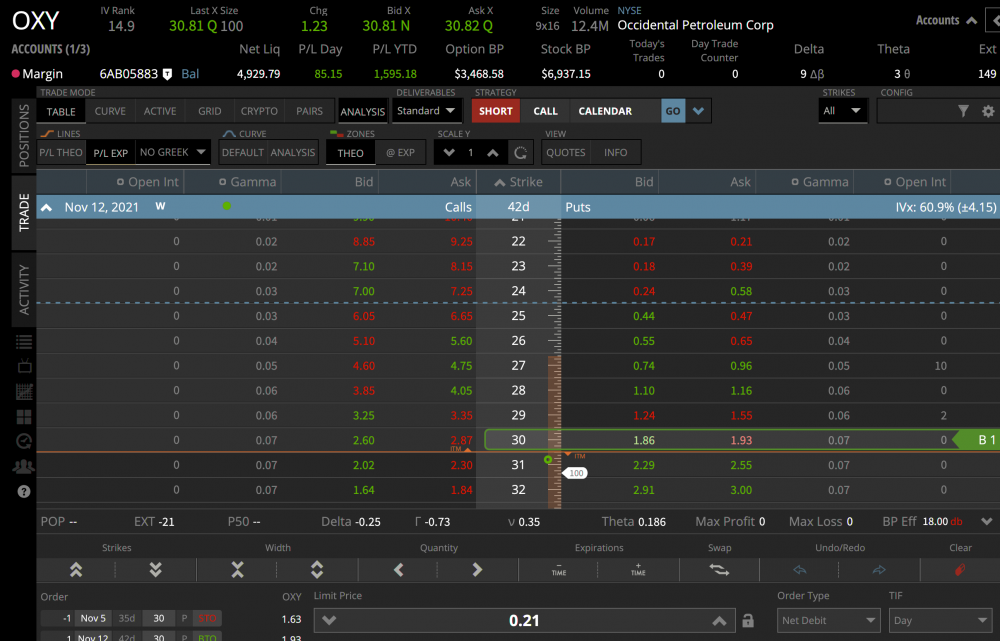
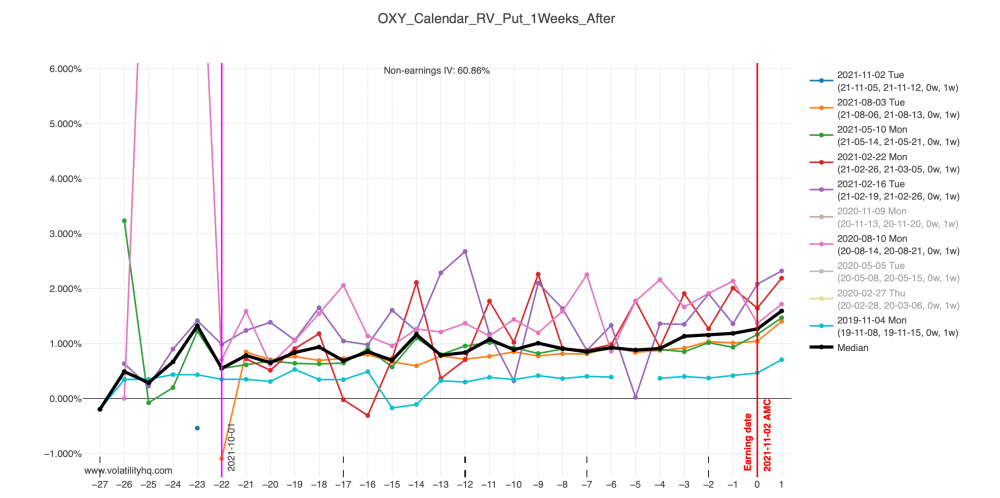
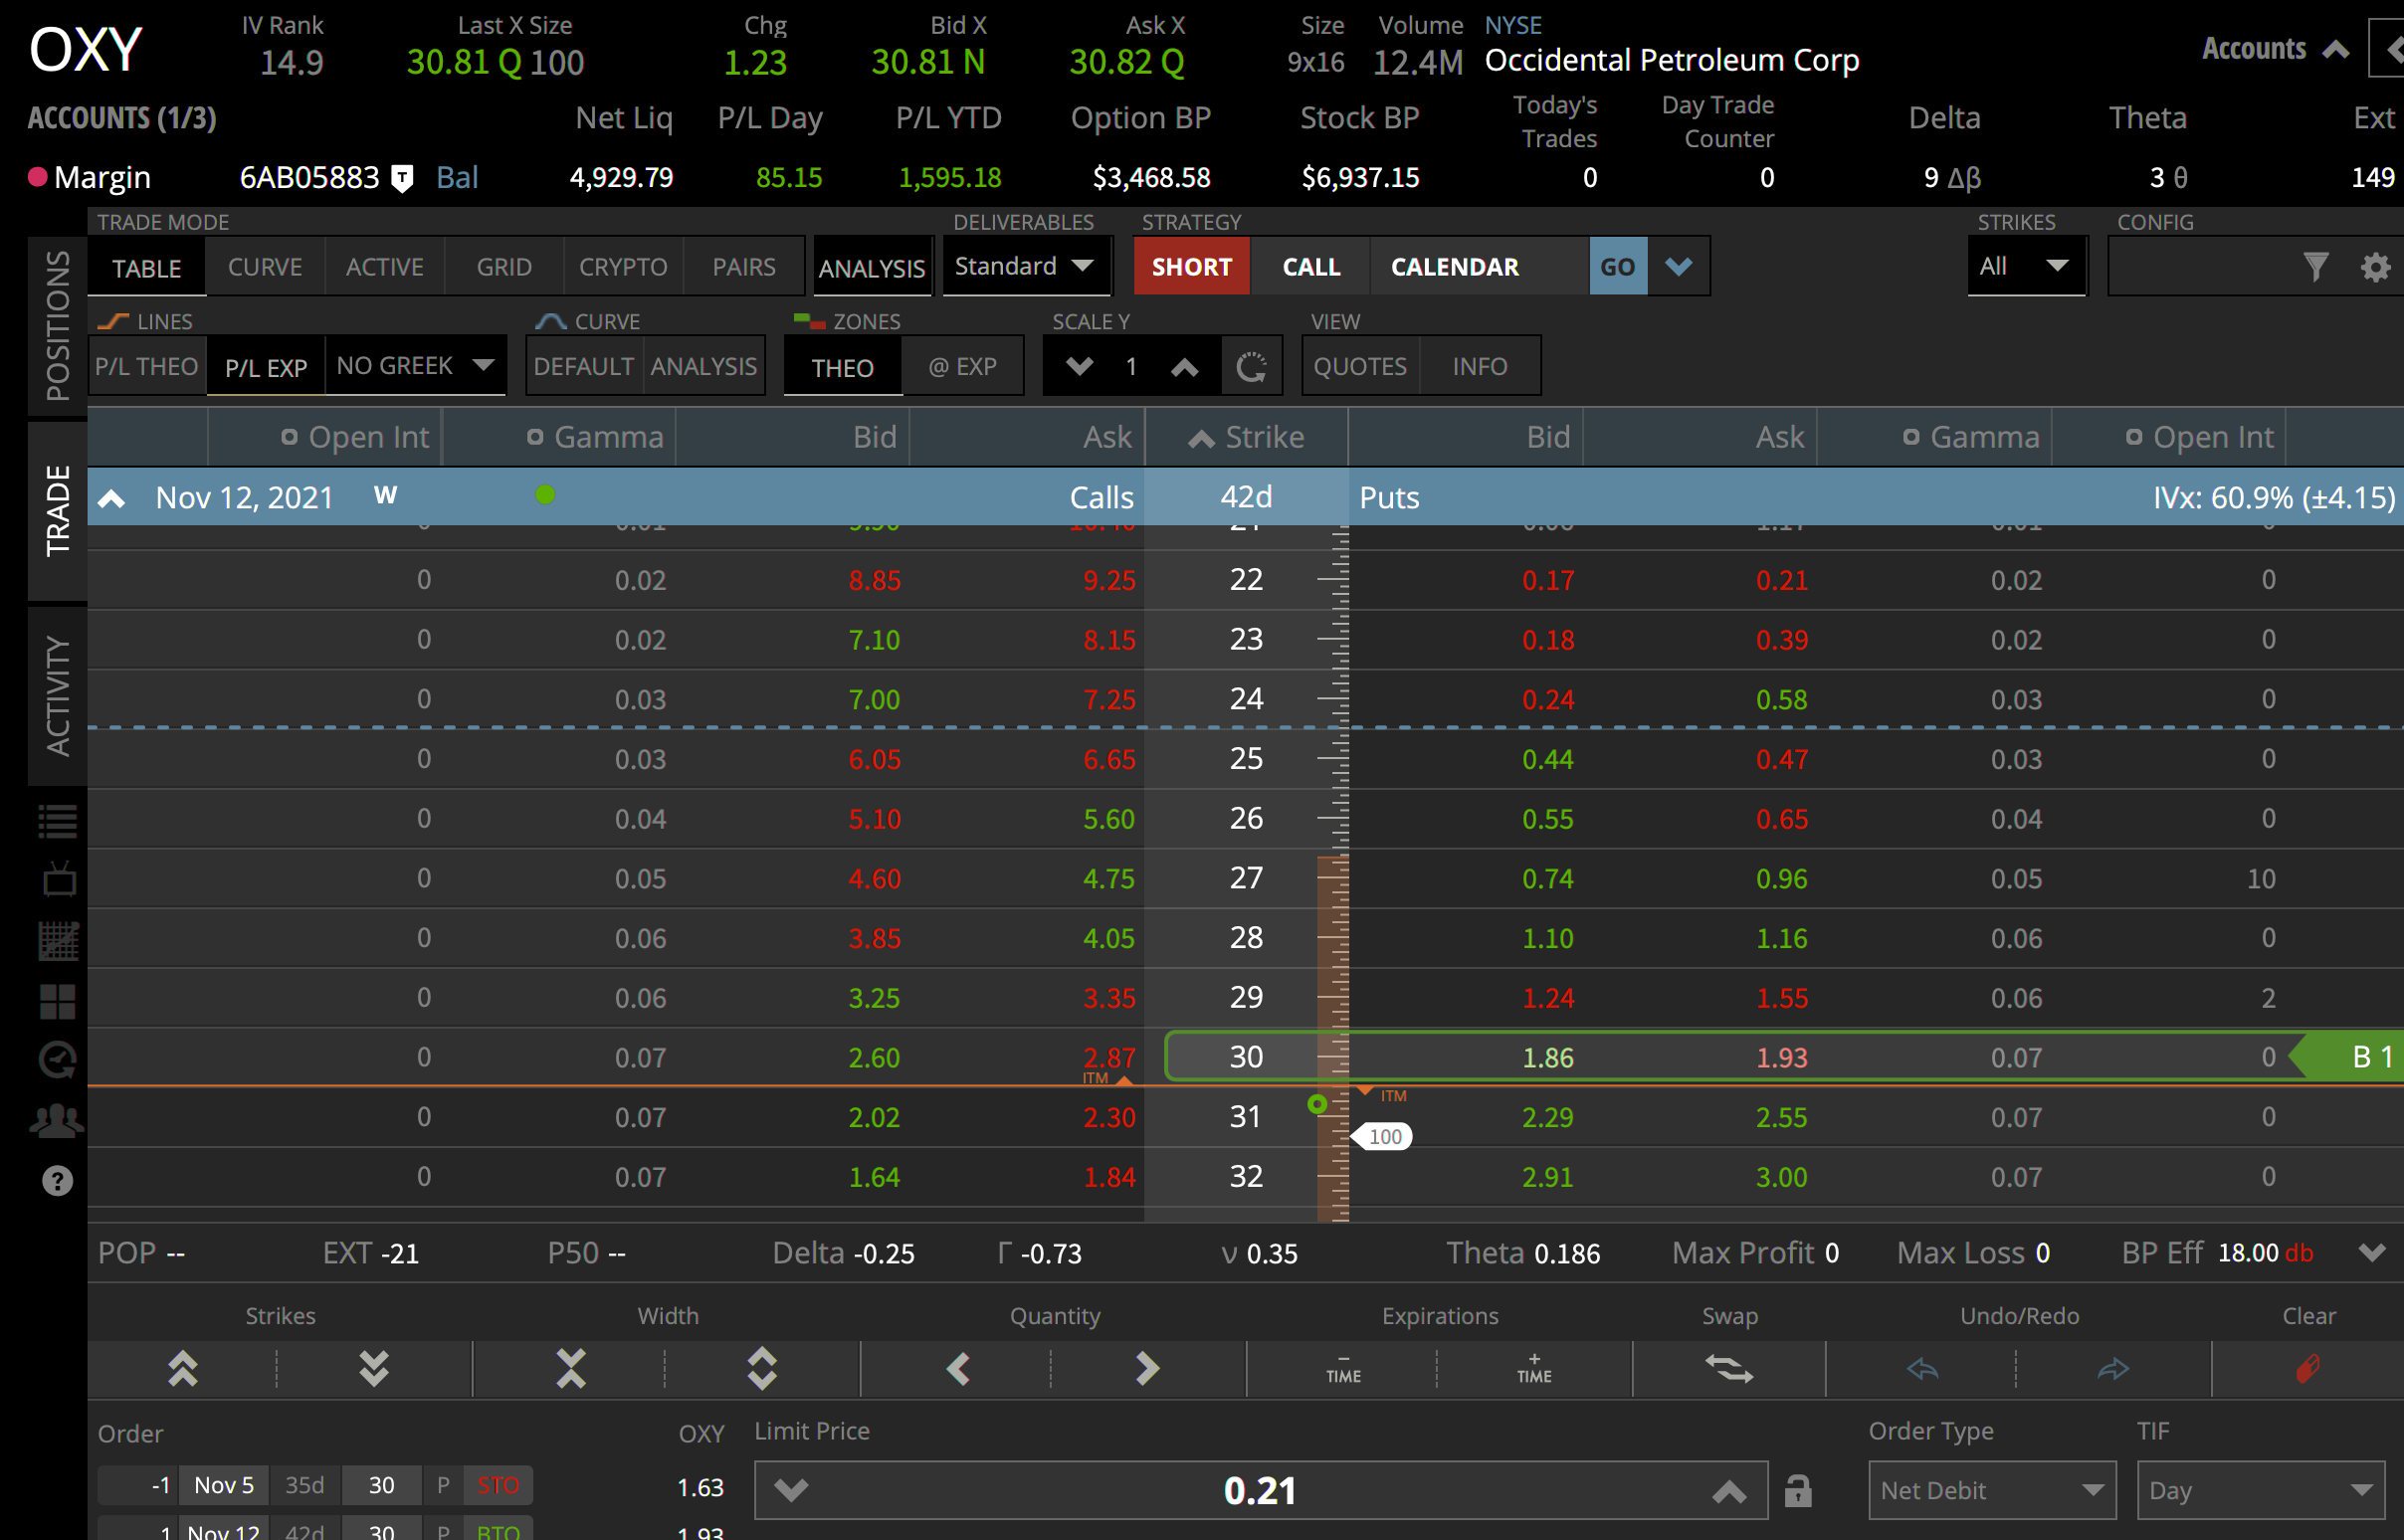
Hello - I'm trying to get my head around this tool, I'm looking at a calendar for OXY (I know it's a low price stock but just because I'm a bit familiar with it), earnings are on the 8th of Nov so short 5Nov put @$30 and long 12Nov put @$30 for a debit of $0.18 so current RV is 0.6%. When I look at volatilityHQ, I see a median RV of 0.546% and a historical cycle that is negative. Does it make sense to you? How can we have a historical negative RV? thanks in advance