All Activity
- Past hour
- Today
-
 Nickel joined the community
 -
Not sure why the confusion..
-
@TradeBobby @Bhavan1986 I think I have found the issue, but it's going to take many hours to reimport and recalculate everything.
- 1066 replies
-
- 2
-

-

-
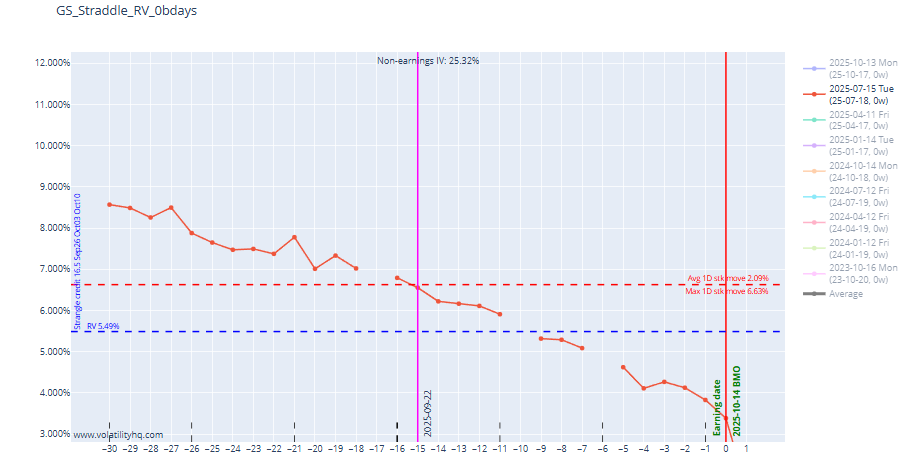
- rv chart
- volatilityhq.com
- (and 1 more)
- Yesterday
-
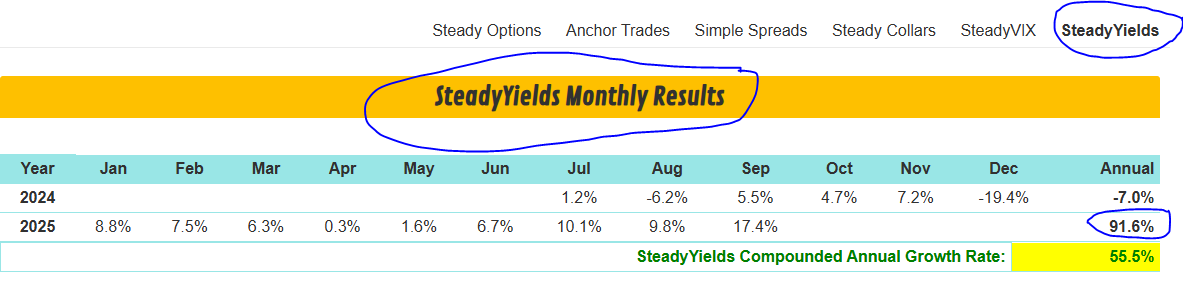
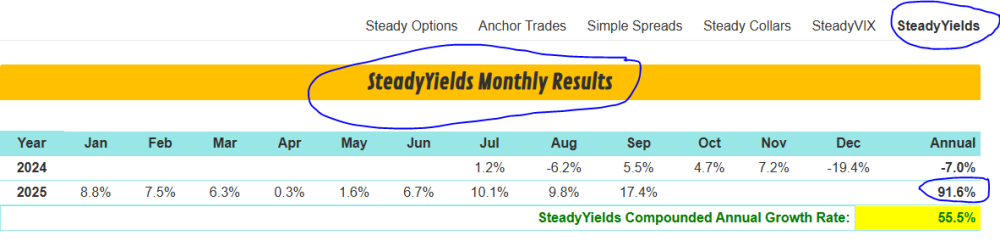
Steady Yields and Steady Options are different portfolios.
-
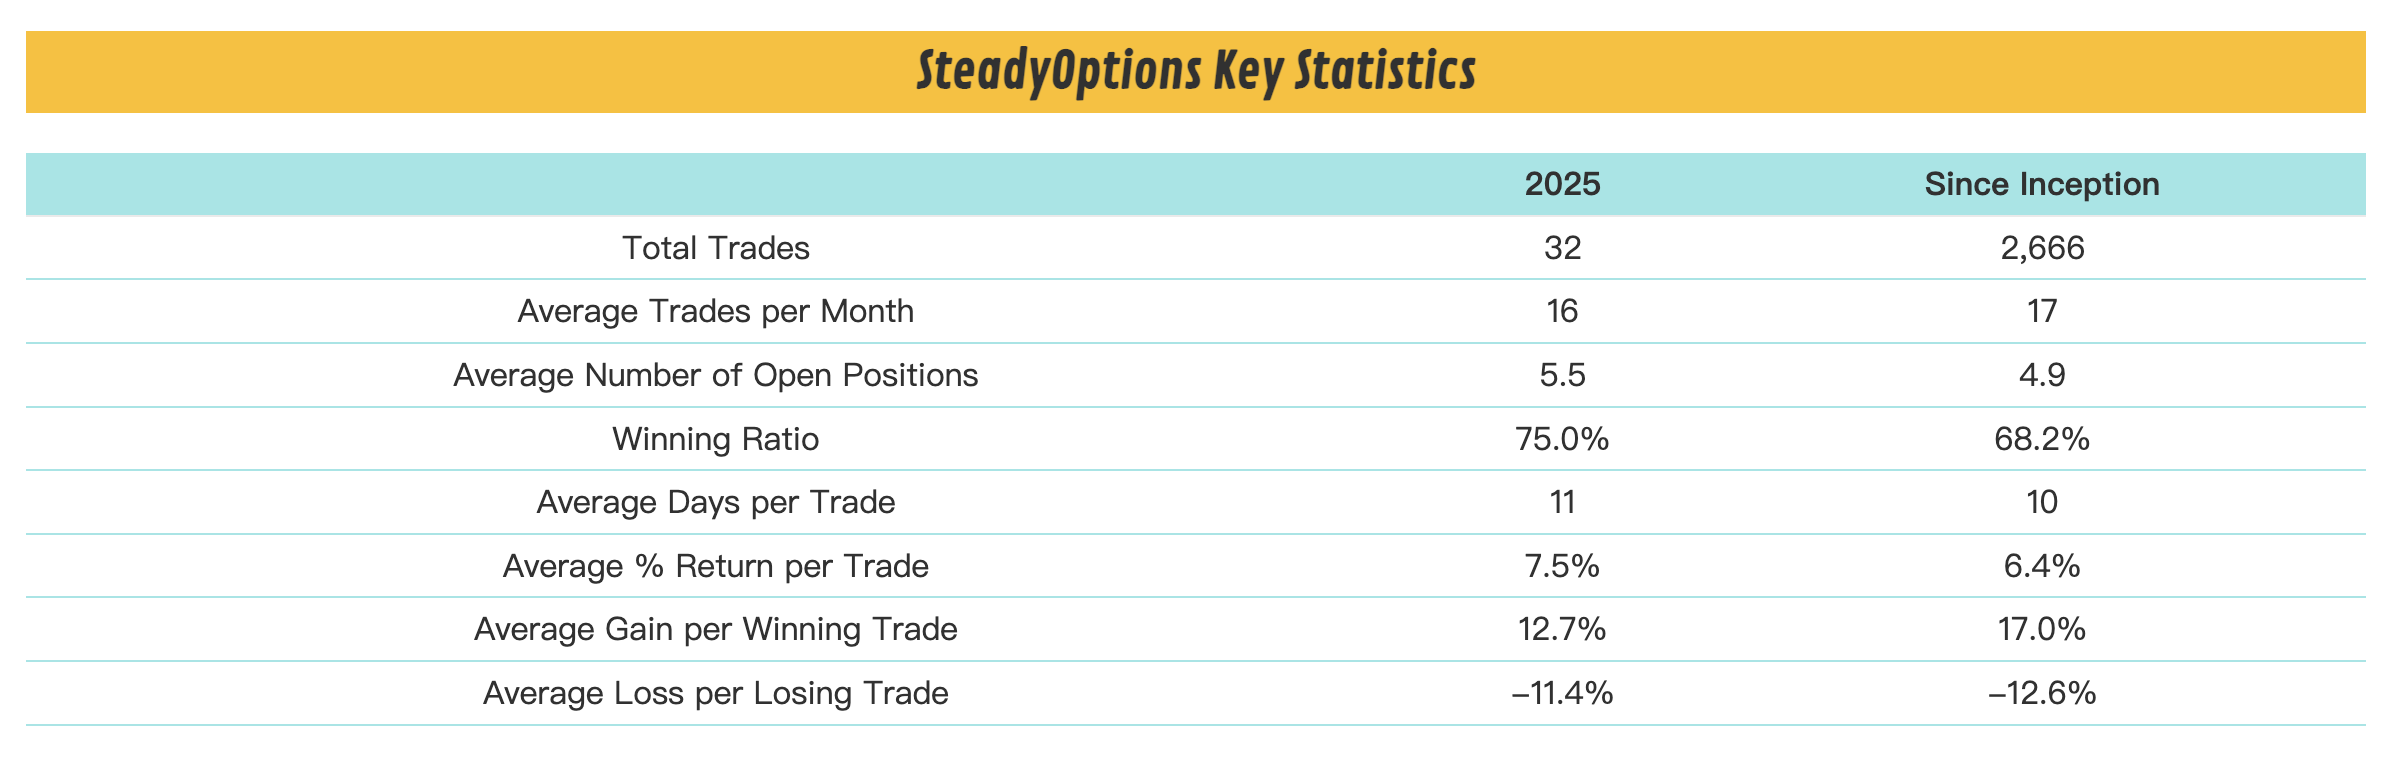
Why am i getting emails touting this program with a 91% truth? How can it have a 91% return YTD, as per the email I just got, when the model portfolio of $10K shows it is just over $10K with a YTD return of 5%. What am I missing?
-
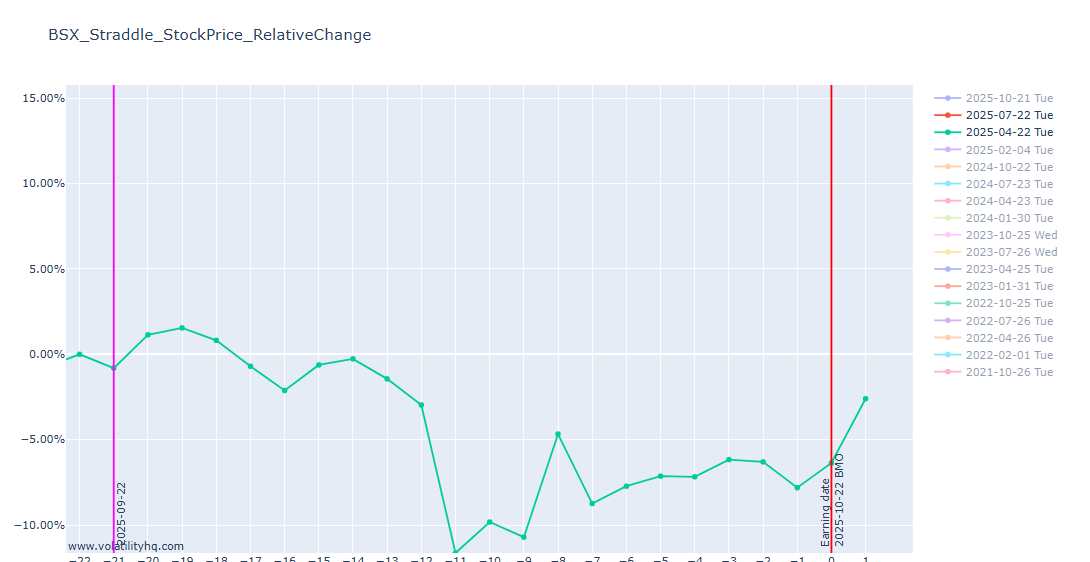
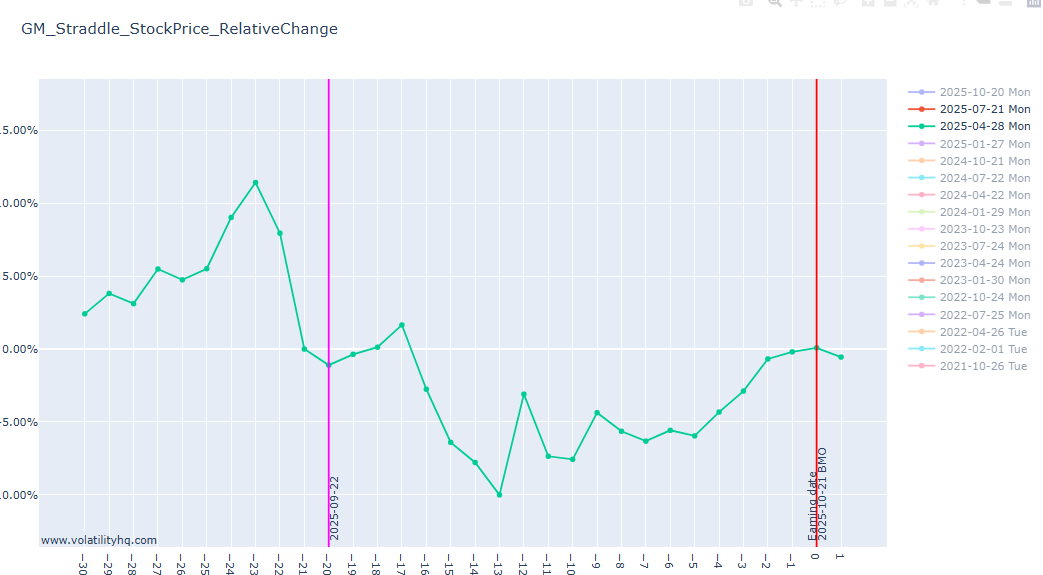
@DjtuxThe tool is missing data for quite a few days for the last Q. Please take a look.
-
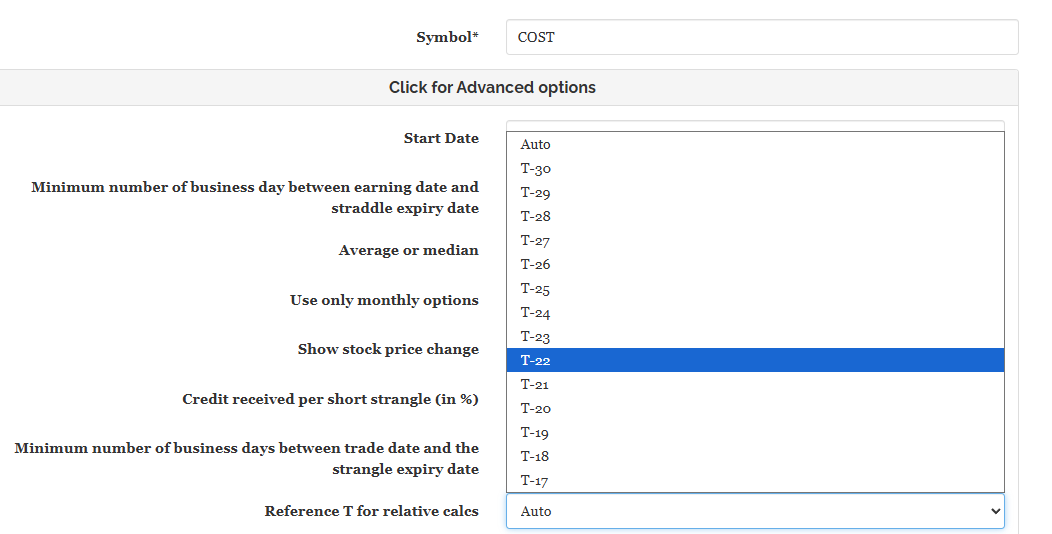
Hi @Djtux I noticed when I'm checking for relative stock movement for Q3 2025 (where earnings has already occurred) the data line is missing. Just wondering if I may be doing something wrong. Thanks!
-
 alison joined the community
 - Last week
-
 CCB001 joined the community
 -
 kevin669 joined the community
 -
Yes, most of the time it is possible to enter hours after the trade has been posted, sometimes even the next day. Of course the entry will depend of the underlying price - if the price moved significantly, sometimes the trade price can change as well. But for the most part, those are very slowly moving trades. The implementation is very different from the previous one. Yes, June 2024 performance would be very different from the previous implementation. In fact, it is possible it would actually make money in June 2024.
-
The strategy is described as low maintenance. How sensitive is the strategy to timing of entries, exits and rolls? With Double Diagonals, it was possible to enter (or roll) hours after a trade alert without impairment to performance. Is there a similar tolerance with this strategy? Also, how would the relaunched strategy have performed in April, May and June 2024? Would the June loss have been less? Thx
-
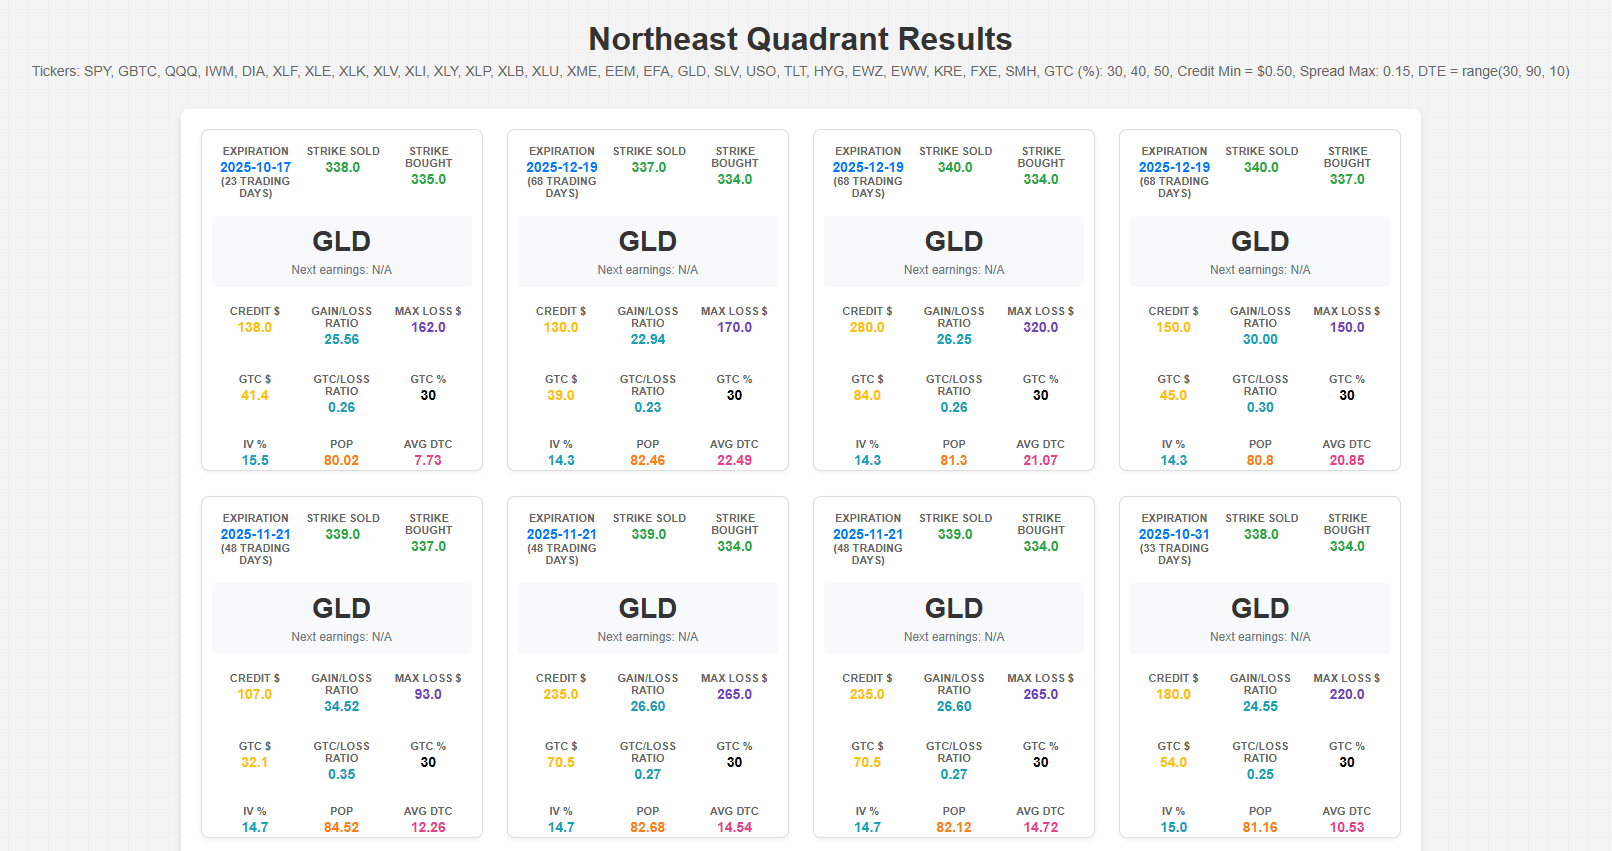
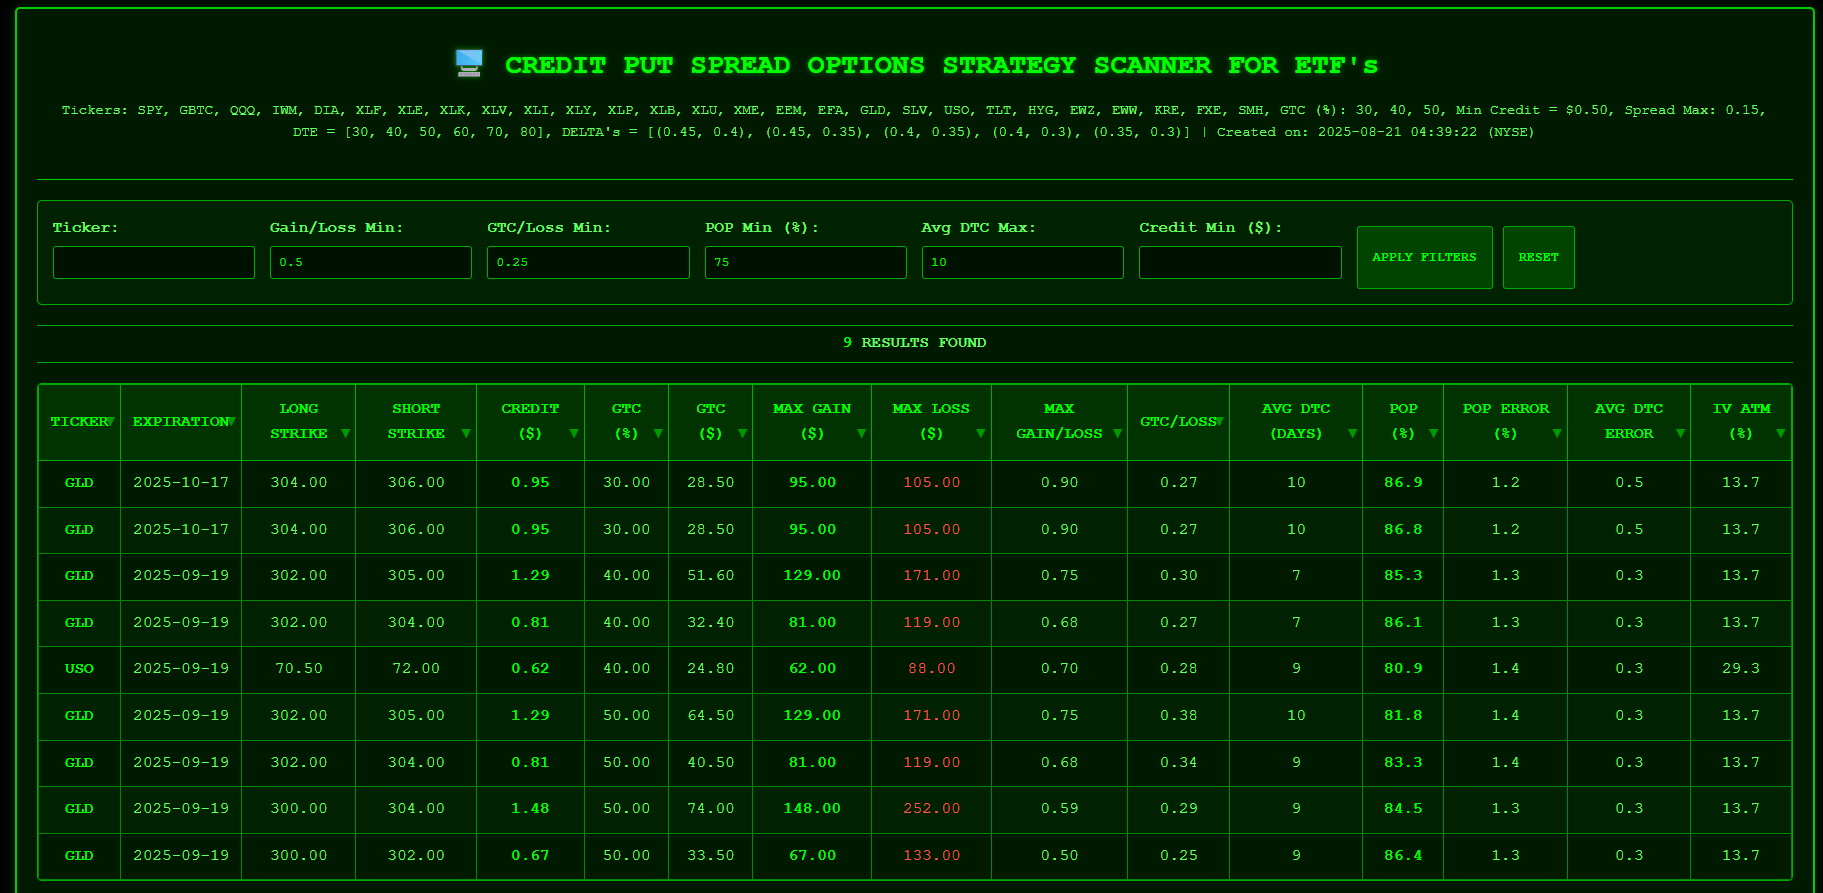
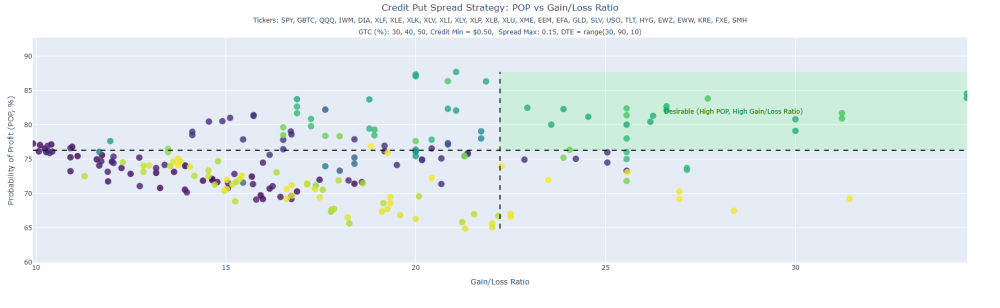
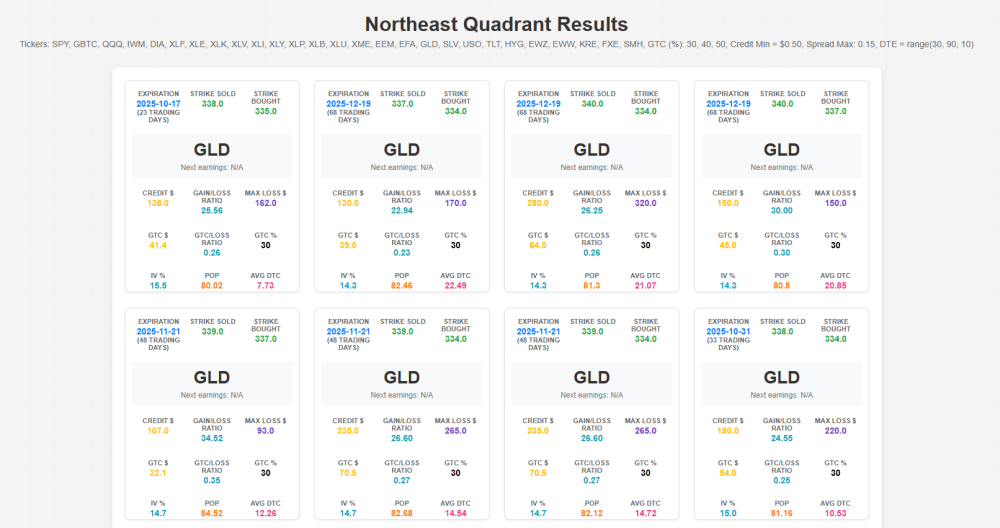
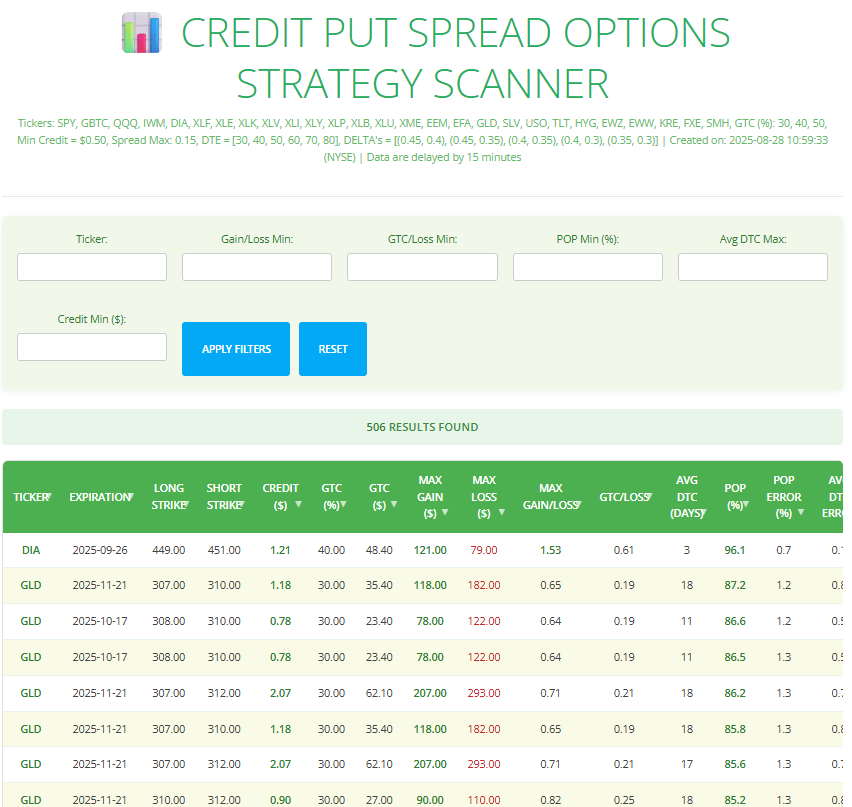
Every day, an algorithm of my design runs and performs millions of simulations to find the best Monte Carlo Probabilities of Profit (POP) for Credit Put Spreads on ETFs with different GTCs (30%, 40% and 50% of the max profit), which have a minimum credit of $0.50, a maximum spread of 0.15 and whose Days to Expiration (DTE) are in the range [30;40;50;60;70;90]. This produces a kind of "Stellar Map" with, on the ordinate, the POP and on the abscissa the Gain/Loss Ratio. 225 "stars" appear today, each "star" being a particular Credit Put Spread for a given ticker. To make this "stellar map" easier to read, you can see the results on my web site https://math-trading.com/scanner-credit-put-spread-etf/, in table form and choose the Credit Put Spread that best suits your needs, depending of course on market conditions, which must always be taken into account. Just for the fun, and because I am a scientist, my code is also showing up like a "Mendeleiev Table" of the best Credit Put Spread, the ones that are in the northeast quadrant of the table. But I'm afraid this is a bit more complicated to read than a table, and to avoid any overload or confusion, I'm only publishing the table on my website. So the "Mendeleev table" is just a scientist's whim 😉 Happy trading!
-
 CLGraham joined the community
 - Earlier
-
 rahulagarwal joined the community
 -
 Yoel.E joined the community
 -
how long before earnings do you measure the data for E.IV (implied volatility of the 1st expiry after the earning date)? we know it starts low and buildup toward the earnings date so a month before will be much lower than a day before ER
-
 NB6046 joined the community
 -
 NARAYAN BIYANI joined the community
 -
 HunterPointer joined the community
 -
 Raburn Kaufman changed their profile photo
 -
@DjtuxIs it possible to add functionality in the tool to chart multiple tickers RV with each other in same quarters? Also, if "Reference T for relative calcs" be available for all Days, rather than being limited to Current Cycle's past days?

-
I was thinking, can this become our one of the leading indicators of wary times? Also, Options Volume vs Avg. Volume? What do you guys think? I was also pondering the volatilityhq (RV Tool), if we can figure out somehow to reflect, if excessive/larger RV declines in individual tickers were in same quarters? Basically, ability to chart multiple tickers in RV Tool.
-
Hi everyone, I’ve been exploring different ways to refine my trading strategies, and I wanted to open up a discussion here. Most of us on SteadyOptions focus heavily on options, volatility, and disciplined strategies. But I’ve recently been reading about how AI-driven platforms are starting to play a bigger role in markets. One example is QUANTUM AI INDIA, an automated crypto and BTC trading platform. While it’s not directly related to options, I find the concept intriguing—using machine learning and quantum-inspired algorithms to make faster, data-driven decisions. It makes me wonder: could combining traditional options strategies with quantum ai trading signals (even from other markets like crypto) give us an edge? For instance, AI might help identify short-term momentum shifts or volatility spikes that we could translate into better entry/exit points in options trades. At the same time, sticking to a structured framework (like we do here) ensures we don’t fall into the trap of overtrading. I’d love to hear your thoughts: Do you see value in integrating AI-driven insights with established option strategies? Has anyone here experimented with automated platforms alongside traditional approaches? Or do you feel crypto-based AI tools are too far removed from options to be useful? Looking forward to your perspectives. Cheers,
-
Monte-Carlo Simulations, KDE probabilities and options implied probabilitiy are probalistic tools giving the probability to be above or below a given threshold or between two thresholds. So their are not bullish or bearish. The Credit Put Spreads for ETF's scanner, as its name suggests, is a bullish tool.
-
I’m currently travelling and don’t have all the data in front of me, but those numbers sound correct. I think the first few months of the year had especially low numbers. With declining VIX, we could not find enough high probability lower risk trades. Things started to look a bit better recently.
-
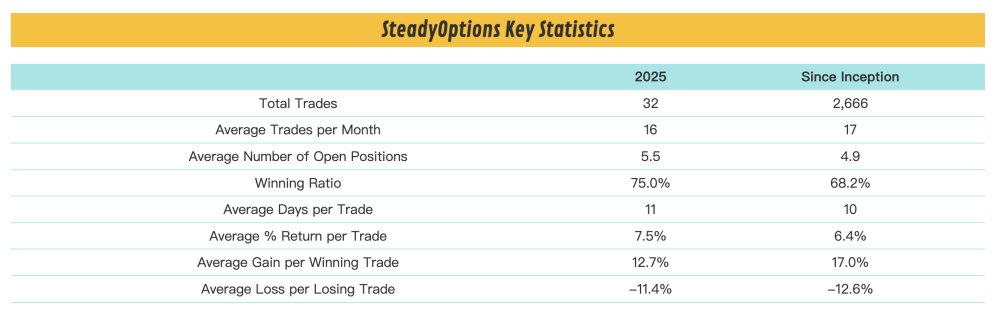
@Kim The number of transactions we have in 2025 is much less than in history. I hope to ask about this in depth. I counted 89 transactions so far in 2025. https://steadyoptions.com/performance/ Historically, we have done an average of 16 transactions per month, and an average of 192 transactions per year. It is equivalent to only 46% (89 / 192) done so far, but 75% has passed this year (9/12)
-
Are all your tools oriented toward the bull side or do you have any tools that identify likely bearish trades as well?
-
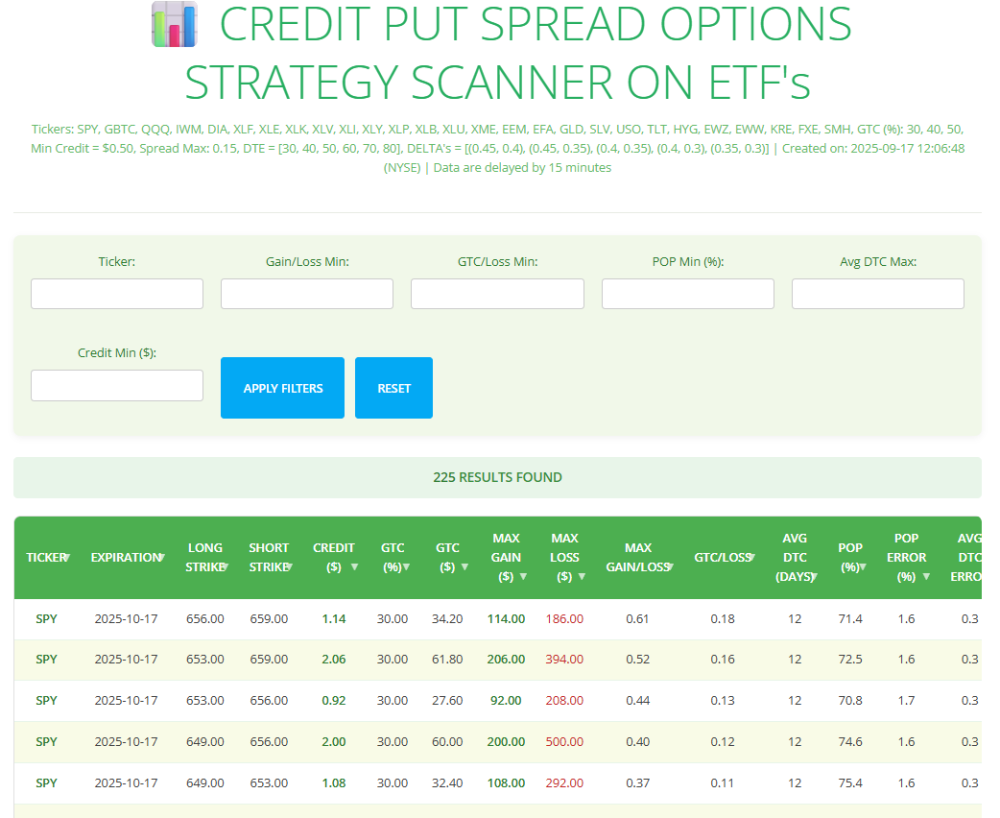
Here is an extract of the interactive table showing best credit put spread options strategies (from Monte-Carlo simulations POV) for ETF's as seen from my web site math-trading.com :
-
 Jason Rubin Insurance changed their profile photo
 -
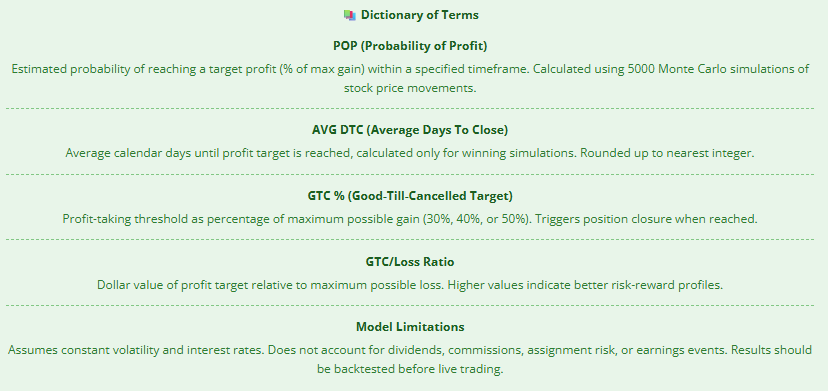
Hi everyone, I have added a new tool to my math-trading.com website. It is a table showing the results of a scanner that computes the Probability of Profit (POP) for Credit Put Spreads options trading strategies on some ETF's (the most liquid in options) using Monte Carlo Simulations. The Monte Carlo Simulation runs thousands of individual stock price simulations and uses the data from these simulations to average out a POP number, using the Black&Scholes formula. Unlike other calculators, this new tool lets you is a scanner and tries different target profits (as a percentage of maximum profit that will trigger the position to close when it's reached in the simulation. Here's how it works: The algorithm scans: ETF tickers For each ticker: DTEs between 30 and 60 days For each expiration, it tries different deltas combinations: (0.45, 0.40), # Short delta = 45, Long delta = 40 (0.45, 0.35), # Short delta = 45, Long delta = 35 (0.40, 0.35), # Short delta = 40, Long delta = 35 (0.40, 0.30), # Short delta = 40, Long delta = 35 (0.35, 0.30) # Short delta = 35, Long delta = 30 ] For each Credit Put Spread, for each day between today and the expiration date, it performs 5,000 simulations of Monte Carlo and, for each of the 5,000 prices obtained, applies the Black & Scholes formula to estimate the price of the initially opened Credit Put Spread. When the GTC of 30%, 40%, and 50% is reached, it looks at the number of days it took to reach it. If it is not reached, the Credit Put Spread is considered lost. It thus calculates, for all simulations, a profit probability and an average day to close. Note, of course, that the IV is considered constant and equal to the value when the Credit Put Spread was opened. The stock price volatility is equal to the implied volatility and remains constant. It makes the following assumptions for its simulations : Geometric Brownian Motion is used to model the stock price using Monte-Carlo simulations, Risk-free interest rates remain constant, The Black-Scholes Model is used to price options contracts, Dividend yield is not considered, Commissions are not considered, Assignment risks are not considered, Earnings date and stock splits are not considered, Of course, not all of these assumptions are true in real life and so there are limitations to this approach. For example, it's highly unlikely that the stock price volatility remains constant for several days. Thus, one should take these results with a grain of salt. Here are the results for yesterday 2025-08-20: On that image I have applied the filters : Gain/Loss min = 0.50, GTC/Loss min = 0.25 and Avg DTC (Day to Close) max = 10 : it means that I want the scanner to select the trades that have reached their GTC within the 10 days after the opening of the trade : this filter is because it is better to close these kind of trades once we get within a 2 weeks of expiration because gamma risk gets much higher closer to expiration. Of course you can click on each columns to sort by ascending / descending order. The computation process itself is very long, given that 5,000 Monte Carlo simulations must be carried out for every day over the 5 last years (for the history of Monte-Carlo simulations), for all tickers, for different combos of Deltas and different expiration dates. On my powerful PC, this takes about 3 hours, without running anything else. Therefore, it is only possible, on math-trading.com, to put the final results table every day. You can see in the image that I have put very interesting filters so that everyone can choose according to their wishes. I will put a complete user guide and deeper explanations in the coming days but, in the footer of the table, you already have a brief description of the different terms ("dictionary of terms"). I hope you all find this tool useful! In preparation : a new tool for calculating the Probability of Profit (POP) and the Average Day to Close for a lot of options trading strategies using Monte Carlo Simulations! Stay tuned! Romuald

-
-1_companylogo.thumb.png.e04f545d7b55e83c81f0432e837d329e.png) Digital WarRoom changed their profile photo
Digital WarRoom changed their profile photo -
Hi everyone, As some of you already know, I’m not only a fellow Steady Options member but also a physicist who loves coding Python tools to help me make better trading decisions—always grounded in probabilities and statistics. I’m excited to share that I’ve put some of these tools online at math-trading.com. One of the main ones available right now is my Monte Carlo simulation tool. Pricing: $39/month or $359/year (before applying the coupon). Special for SO members: you get 15% off all subscriptions until December 31, 2025. And here’s the bonus—new tools I’m currently developing (including a Monte Carlo + Credit Put Spread combo) will be added over time without any price increase. Feel free to check them out, and if you have any questions or ideas, just reach out through the math-trading.com website. Happy trading—and thanks for your trust! Romuald
-
If you used the New content or All activity as mentioned before, you would see this: Website Conversion issues - August 2025 We are having some issues since the upgrade and working to fix them. Viewing All activity is always the best option when in doubt.
-
Since 1-2 days ago, I haven't been receiving any notification emails from SO. (For instance, I missed the DELL trade today, among other unofficial trades.) I am still investigating the problem. Does anyone have a clue? Thanks!
-
.thumb.jpg.5b44c804d718174f3c87e8d8bbb13120.jpg) Rocket Bail Bonds changed their profile photo
Rocket Bail Bonds changed their profile photo -
Profits come in bunches. The trick when going sideways between home runs is not to lose too much in between - Michael Covel I keep repeating this quote again and again, just look at latest Simple Spreads performance. Every drawdown in S&P 500 was followed by a monster rally (it is now up over 30% from its April lows in just 3 months). Every time SO was "underperforming" for a few months, was following by a monster year.

-
Yes, IV still reflects future expectations. But for many stocks, those future expectations have been very different from the previous cycles. Macro events like tariffs can add or remove uncertainty to the global markets. This is why VIX jumped to 30+ when Trump first announced the tariffs, and this is why it kept going down gradually when the markets realized that things are not as bad as initially thought. And now it's back to the mid teens after few major deals have been announced. But even when this macro uncertainty is removed (or significantly reduced), there is still specific event risk like earnings. In case of SOFI, all previous cycles priced at least 14-15% move. So why this cycle would price only 10% move, even with reduced macro risk? The earnings are still there. And btw, if you look at the morning of earnings, SOFI moved 17% at the open (it retreated later, but this is not the point). So the market was very wrong in pricing earnings so low. Also, when you enter a straddle during periods of high VIX and VIX goes down during the life of the straddle, it has a negative effect on the straddle price. This kind of "mispricing" happened a lot in the last few months, and this was the main challenge.
-
I just received this email addressing some issues SO was facing in the past. I’m not a member anymore but I was and I’m familiar with the strategies. I’m a vol trader since over 20 years so here my 5 cents. There is no fundamental change in volatility. Volatility is behaving as it always does. Volatility reflects the future expectation of movement of an underlying during a certain time frame. One important driver of Volatility are events. The bread and butter of SO, earnings events. Since Trump took office, single stock volatility also incorporates a lot of Macro Event vol and there are a lot more than normal. Best example is the one you used: SOFI. Expiry is 1st of August. Thats Trump’s Tarif deadline and that’s something effecting all businesses. Hence to the normal earnings expectations you got additional macro risk that is specifically fixed on one date. But Trump started taking some expectations out of the deadline by announcing the sending out of letters with deals about two weeks ago and about one week ago announcement of a deal with Japan and on Monday the deal with EU. Hence 1st of August premium got priced out after several parts of the big event got communicated down the road. Thats like pre earning releases. There are a lot of these Macro Events around. Hence, if you trade volatility, you need to be aware of these (extra)events and what the additional premium for these events are on top of the normal micro events. It’s ok trading on backtesting but you need to be aware of the future, hence if the future has addition risk that isn’t replicate in past comparisons. I can clearly say, the SO edge isn’t lost, you just need to be aware what expiry vols you are buying/selling and what (additional) risk they incorporate.