All Activity
- Today
-
 venomcoupe joined the community
 -
 Jquattrone45 joined the community
 -
I'll add documentation about it later today.
-
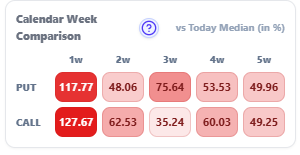
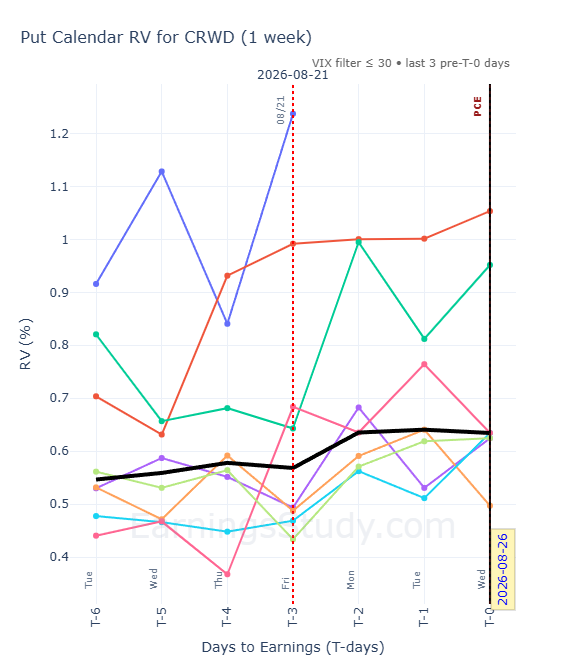
Hi Kim Can you please explain how this calendar week comparison table works and how the selection of the eg put strike distance in the graph is selected. Would according to the calendar week comparison in this case a call calendar 1 w be even better? Great site overall and so much to discover. Thank you.
-
Dashboard redesign is live — the app now starts with your day, not a blank search box The dashboard got a ground-up redesign. The idea behind it: you shouldn't have to go hunting every morning — the first screen should already know what today looks like and what you care about. What's new: Today, at the top. The day's report queue — who's in an entry window right now, before you've typed anything. Next to it, Your week: the full lane of what's coming, so Monday-you can see Thursday's setups forming. "Opportunities for you" — with your definition of an opportunity. Three presets to start: Top winning trades (highest median return on the board, any structure), Most consistent (sorted by win rate, and only names with 2 to 3 years earnings cycles of history behind the number — no small-sample heroes), and Tightest spreads (lowest NBAS first, so tradeable markets rank ahead of wide ones). "Where's your bar?" — the preferences wizard. This is the part I'm most pleased with. Tell the dashboard your standards once and it filters everything to match: minimum win rate, median return range, how much spread cost you'll tolerate, which structures you trade, weekly-options-only if that's your rule, and "only my symbols" if you want your watchlist and favorites and nothing else. Filter by how the trade wins, not just what it's called. Every structure is tagged by its profit mechanism — IV crush (iron flies), needs a move (straddles, strangles, long options), near-strike + IV (calendars), IV + move (double diagonals). If you're only in the mood to sell the ramp, or only want defined-risk movement bets, one filter shows you just those setups. It's a small thing that changes how you scan. Your tracked setups, front and center. Anything you're tracking from a strategy page now has its own panel on the dashboard — the day-by-day repricing you've pinned, waiting for you at login instead of three clicks deep. And it's fast. Everything here came from watching how you all actually start your mornings — and several pieces trace straight back to questions asked on this thread. Keep them coming: if your first five minutes in the app still involve a workaround, that's the next thing I build.
-

 Thinking about taxes proactively allows you to structure your investments and financial decisions to minimize your obligations and maximize long-term returns. This is the difference between reacting to a tax bill and strategically managing your financial future. Understanding Your Taxable Events For most investors, selling an asset for a profit is a taxable event. While this is a major component, it's not the full picture. A taxable event is any action that triggers a tax liability. This can include receiving dividends from stocks, earning interest from bonds, or even exercising certain types of employee stock options. Each of these events can add to your taxable income for the year. Forgetting to account for them can lead to an unpleasant surprise at tax time. A key part of modern tax planning is clearly understanding how your portfolio generates taxable income throughout the year, not just when you decide to sell. The Role of Stock Options in Your Tax Strategy Employee stock options can be a fantastic way to build wealth, but they also add a unique layer of tax complexity. Incentive Stock Options (ISOs) are particularly noteworthy. While they offer certain tax advantages, exercising them can trigger the Alternative Minimum Tax (AMT). This separate tax system ensures high-income individuals pay a minimum amount of tax. Exercising a large number of options might seem like a great move, but it can lead to a surprisingly large AMT bill if you're not careful. Proper planning around when and how many options to exercise is crucial to avoid an unexpected and substantial liability that could otherwise diminish your gains. Strategies for Managing Capital Gains Once you understand your taxable events, you can start using strategies to manage them effectively. One of the most common and powerful techniques is tax-loss harvesting. This involves selling investments at a loss to offset gains from profitable investments. This can reduce your overall capital gains tax and, in some cases, even allow you to deduct losses against your ordinary income. Another fundamental concept is being mindful of holding periods. Investments held for more than a year are typically taxed at the lower long-term capital gains rate. Those held for a year or less are taxed at your higher ordinary income tax rate. Simply being patient and holding a winning investment for a few more months can significantly impact your after-tax return. Leveraging Tax-Advantaged Accounts One of the most straightforward ways to manage your tax liability is to make full use of tax-advantaged retirement accounts like a 401(k) or an Individual Retirement Account (IRA). Contributions to traditional 401(k)s and IRAs are often tax-deductible, lowering your taxable income for the current year. The investments then grow tax-deferred until you withdraw them in retirement. Roth versions of these accounts work differently: you contribute with after-tax dollars, but your qualified withdrawals in retirement are completely tax-free. A combination of these accounts can give you flexibility in managing your tax burden today and in the future. Prioritizing these accounts for long-term growth is a cornerstone of sound financial and tax planning. Proactive Planning vs. Reactive Filing Ultimately, optimizing your portfolio's growth through tax management comes down to a simple mindset shift. Instead of seeing tax filing as an annual chore where you report what already happened, view tax planning as an ongoing strategic process. This means considering the tax implications of every investment decision you make throughout the year. Are you about to sell a stock? Check the holding period. Are you receiving a large cash bonus? Consider how much to put toward a tax-advantaged account. This proactive approach ensures you make decisions that align with your long-term financial goals, turning tax management from a liability into a powerful tool for wealth creation. Effective tax planning is not an afterthought. It's an integral part of a successful investment strategy. Understanding how taxes affect your returns and using the right strategies can significantly improve your ability to build wealth over the long run. This is a contributed post.
 - Yesterday
-
 GainzAlgo joined the community
 - Last week
-
He's probably in need of a break from all my questions 😉
-
-
Subscription is currently open.
-
Enjoy your time away will try not to break anything while you are gone
-
Away from Friday 21st Aug afternoon to August 31st Heads-up: I'm away from this Friday 8am ET until Monday August 31st. No scans will be interrupted — the daily pipeline and the scanners run on their own — but I won't be around to answer questions or look at setups during that stretch. Back on the 31st. Romuald - optionbench.com
-
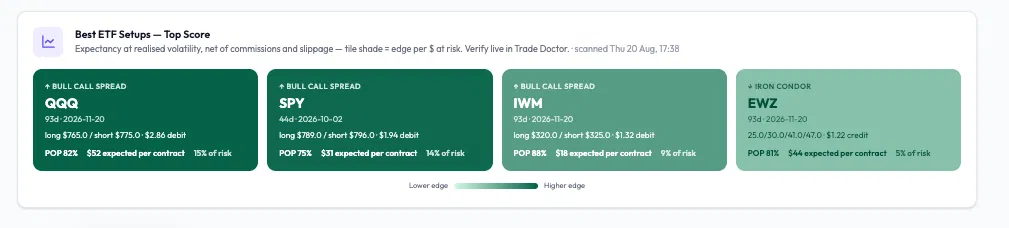
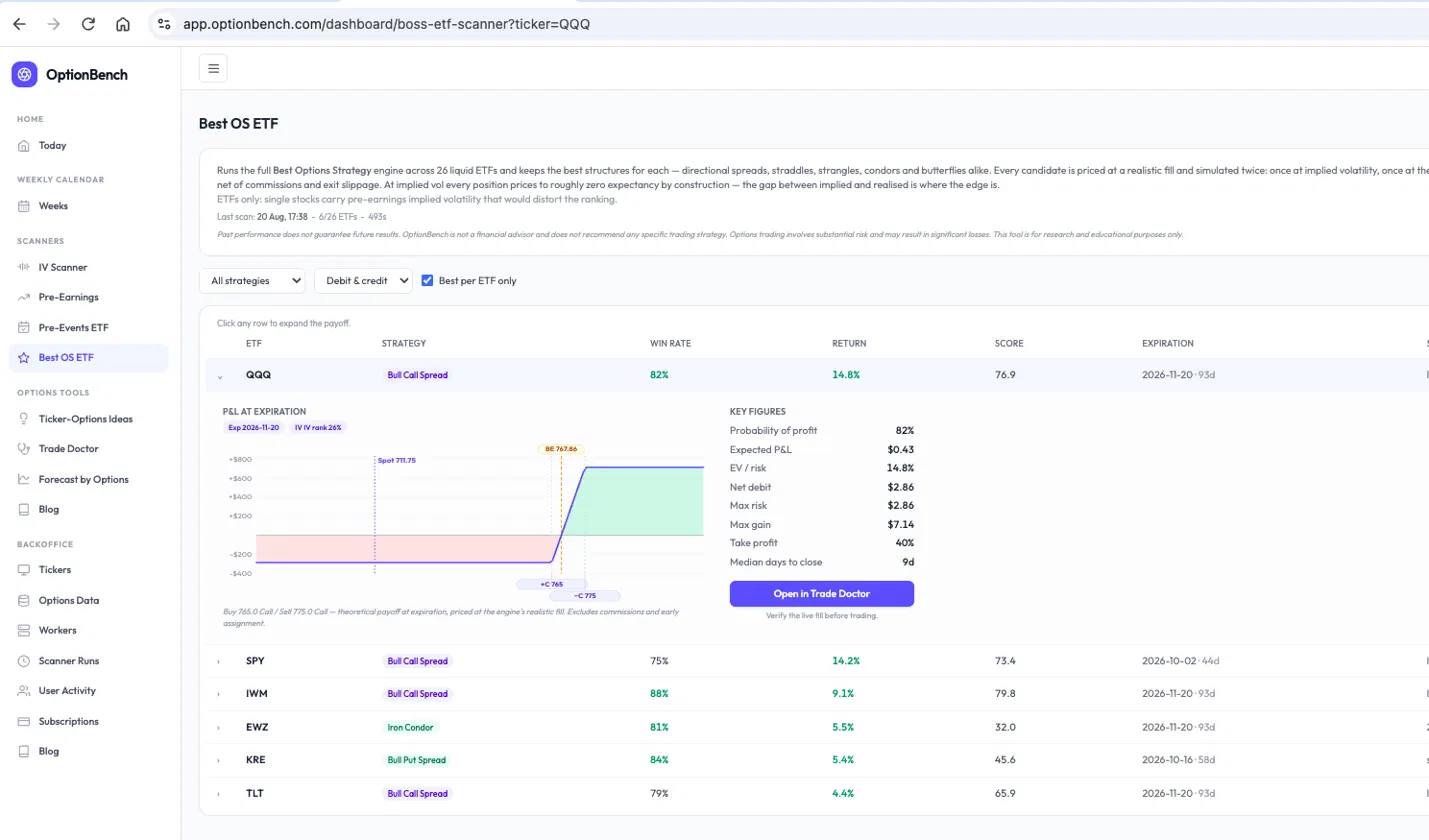
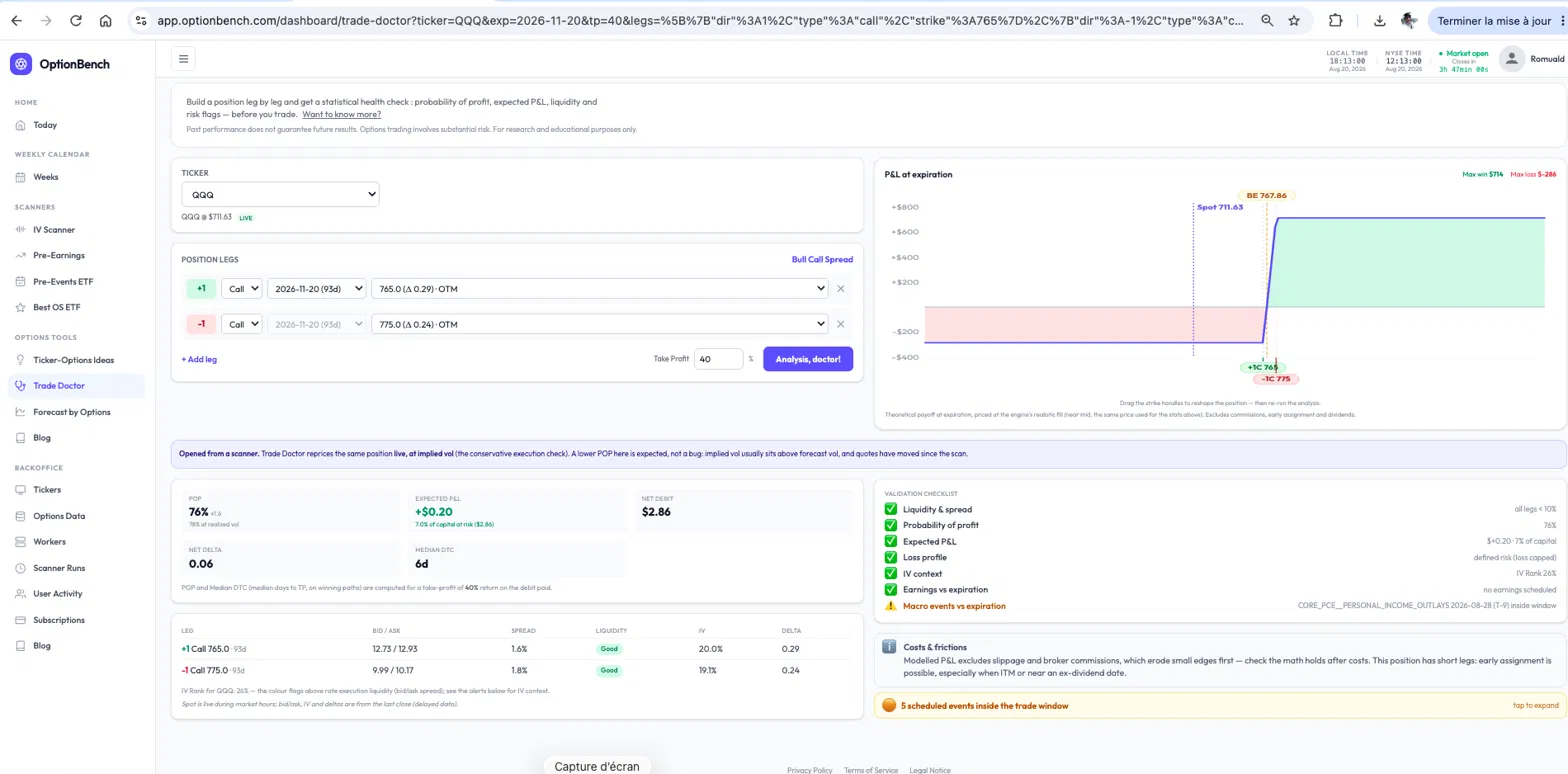
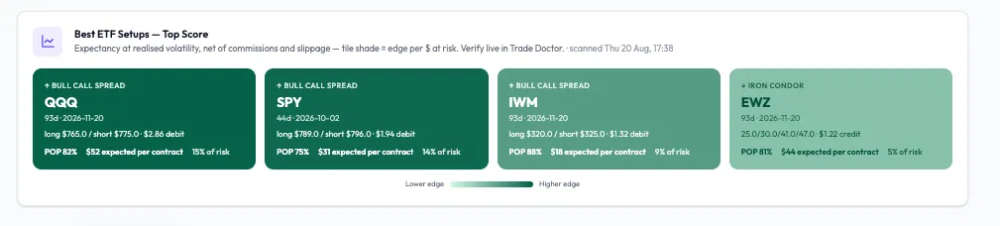
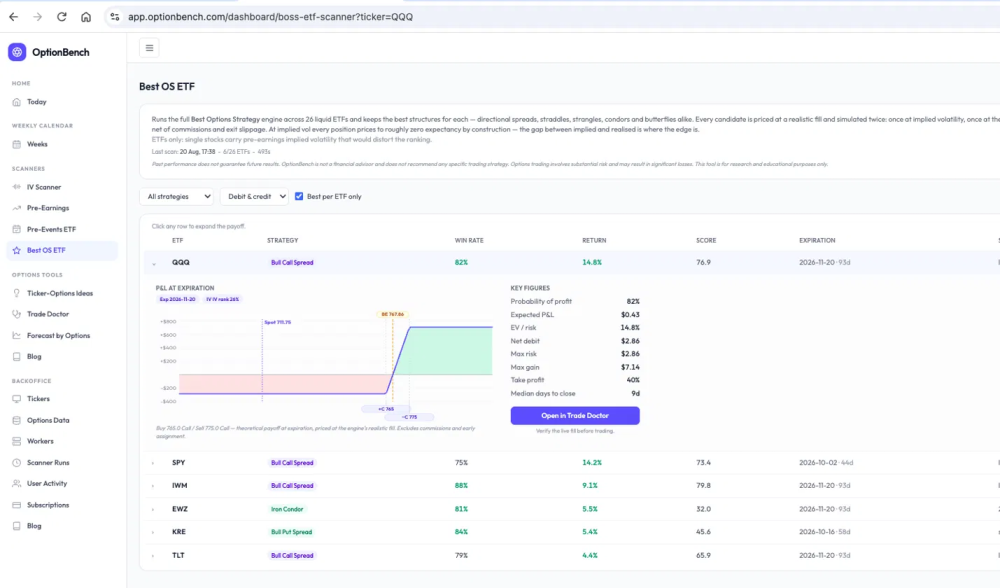
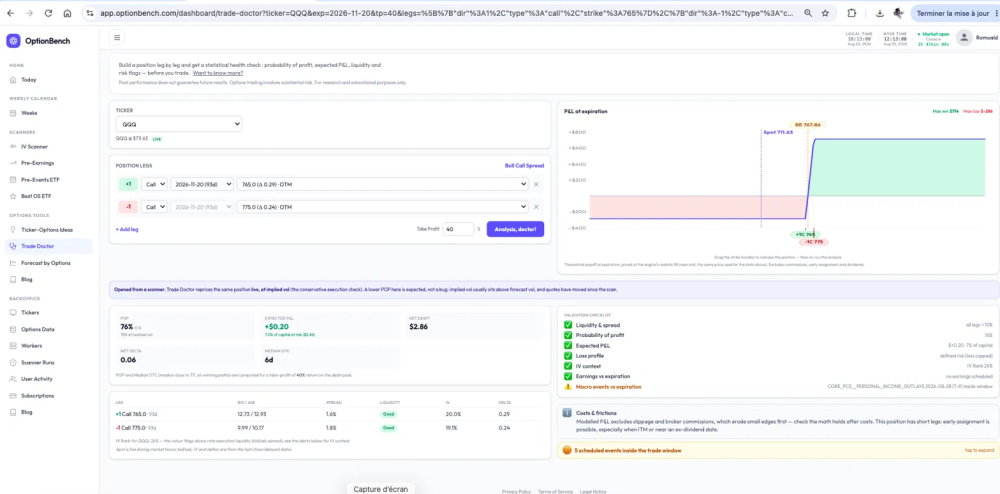
When two engines disagree, and why that's the reassuring case A worked example from today's scan — not a trade suggestion, a look at how the pieces fit together. The ETF engine surfaced a QQQ bull call spread, 765/775, November expiry, $2.86 debit. It reads 82% probability of profit, $0.43 expected P&L, 15% expected return on capital at risk. The interesting part is what happens next. Push the same position into Trade Doctor and the numbers change: 76% POP, +$0.20 expected. Lower on both counts. That looks like two tools contradicting each other. It isn't, and the difference is the whole point. The engine simulates at realised volatility. It asks what happens if the underlying behaves the way it has actually been behaving. Trade Doctor reprices live at implied volatility — what the market is charging for that risk today. Implied normally sits above realised; that gap is the volatility risk premium, and it's why the second reading is the more conservative of the two. So a lower POP in Trade Doctor is expected. What you're checking is not whether the numbers match — they shouldn't — but whether the position survives the harsher assumption. Here it does: expected P&L stays positive at implied vol, 7% of capital at risk. On a debit position that isn't automatic. Plenty of setups screen well on the engine and collapse to zero expectancy once you price them at implied. Two other things the cross-check surfaces that the card alone doesn't. Both legs quote inside a 2% bid/ask spread, so friction won't eat the edge — on a $2.86 debit that matters. And the validation checklist flags five macro prints inside the trade window, including Core PCE at T-9. Everything else runs green; that one doesn't. What I'd take from it. The engine tells you a structure looks good. Trade Doctor tells you whether it still looks good when the market's own pricing is the assumption. Agreement between them isn't confirmation that a trade will work — nothing is — but disagreement in the wrong direction is a reason to stop, and that's worth thirty seconds before committing capital. For the record, this one is a directional bull bet: break-even at 767.86 with QQQ at 711. Both tools are part of OptionBench — the scanners surface the structures, Trade Doctor is the execution check you run before committing. Free 7-day trial if you want to run this cross-check on your own tickers: optionbench.com
-
Hello, I'm interested in the Steady Options service. Please, add me to the wait list. Thank you!
-
 Majed joined the community
 -
 Lachin joined the community
 -
The right principle, and one the scanner tries to enforce rather than leave to memory. Every pre-earnings row carries a confirmation flag: when the provider hasn't marked the report time as confirmed by the company, the card shows an amber "unconfirmed" chip rather than presenting the date as settled. M has been flagged that way throughout. Straight about the current state though: the card still shows September 2. Macy's put out the September 10 confirmation an hour ago and my calendar feed refreshes each morning, so the corrected date lands tomorrow at the earliest. The chip says don't trust this date, which is right, but the date itself is stale until the provider catches up. I'm watching how long that takes. Every cycle in the sample knew its date; the live position doesn't. No amount of better data closes that asymmetry, and it belongs in the trader's head rather than in a win rate. On the narrow exceptions — cheap calendars, far-dated diagonals — those cards now show the executable debit next to the mid and the spread on each leg, after Yowster flagged the gap. If someone's taking date risk deliberately for cheap relative value, they should at least see what the fill really costs first.
-
Follow-up on my note about M last week: Macy's has now confirmed earnings for September 10 — about a week later than the estimated date that was floating around. This is a clean illustration of why we don't enter pre-earnings positions before the company confirms. Anyone positioned for an early-September report got repriced: options expiring before the 10th lose their event premium outright, and longer-dated positions built for a Sep-2 IV ramp now sit through an extra week of decay waiting for an event that moved. Nothing in a backtest protects you from this — the historical cycles all 'knew' their dates; your live trade doesn't until the company speaks. The exceptions we make are narrow and deliberate: structures where the date risk is partially hedged and the relative value is cheap enough to compensate — a cheap calendar, a far-dated diagonal. If you're making that exception, know you're making it.
-
I think a lot of traders lose because they confuse activity with edge. This applies outside options too. I have seen the same thing with small crypto trades on BYDFi: the platform can be simple to use, but that does not mean every trade has a real setup. If someone keeps clicking because the market is moving, fees, bad entries and emotions slowly eat the account. For me, the hard part is not finding more tools or more markets. It is reducing trades, sizing smaller, and only taking setups where the risk/reward is clear before entering.
-
 Maplecccoin joined the community
 - Earlier
-

Pre-Earnings Entry Price: What 31,000 Cycles Say
greenspan76 commented on Romuald's article in SteadyOptions Trading Blog
Great! You answered the exact question I was wondering about - whether you had data that backs up the idea that "richer" trades actually have lower expected returns over time than "cheaper" trades. I haven't traded calendars as much the last few years, but I remember back when I did in the 2016-2018 period, I was surprised to find in my own trading that pre-earnings calendars with higher RV than the past 8-12 cycles still had excellent returns, but they also were frequently the trades where I would get in, set a 20% GTC gain and be out within a day. I never really tracked to see what would have happened if I kept holding, so I couldn't really prove anything with anecdotal data, but it led me to wonder if a trade being "richer" might not really matter to long-term results. Looks like it does - at least for straddles/strangles. Good info. -
Based on what was being done in another service I was subscribed to backtests were best around a 20 delta spread .... -40/+20 or -30/+10 were usually the ones used in trades
-
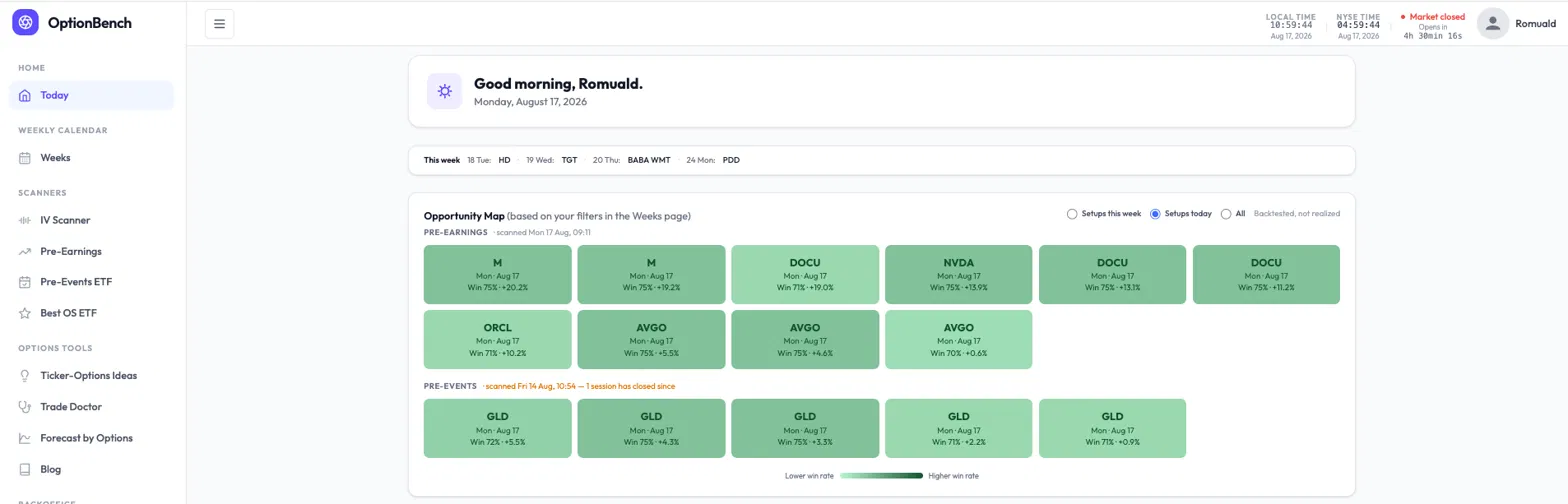
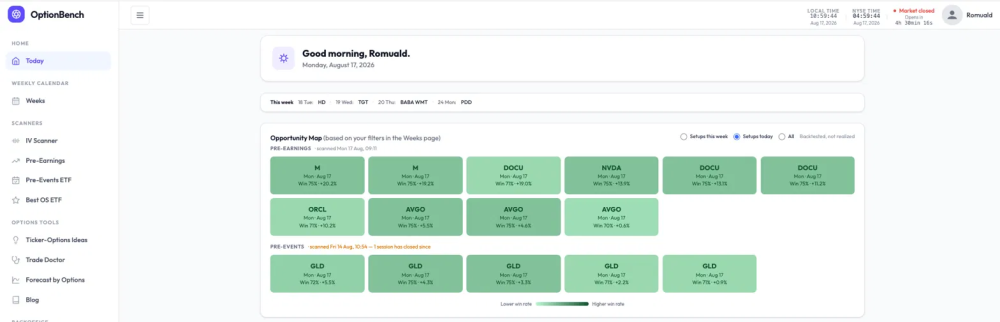
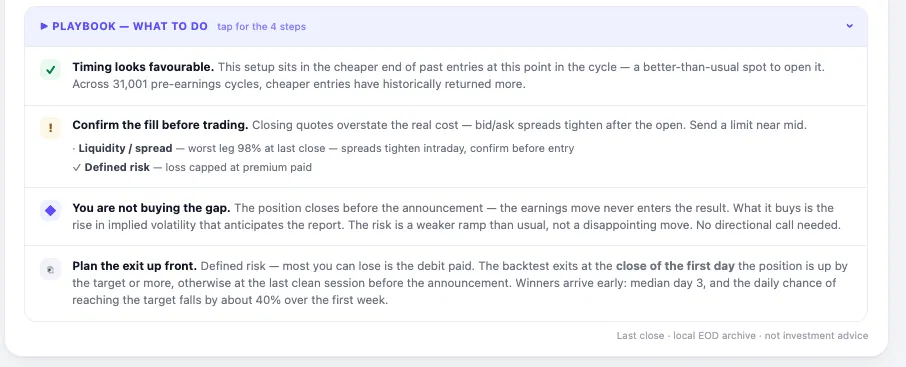
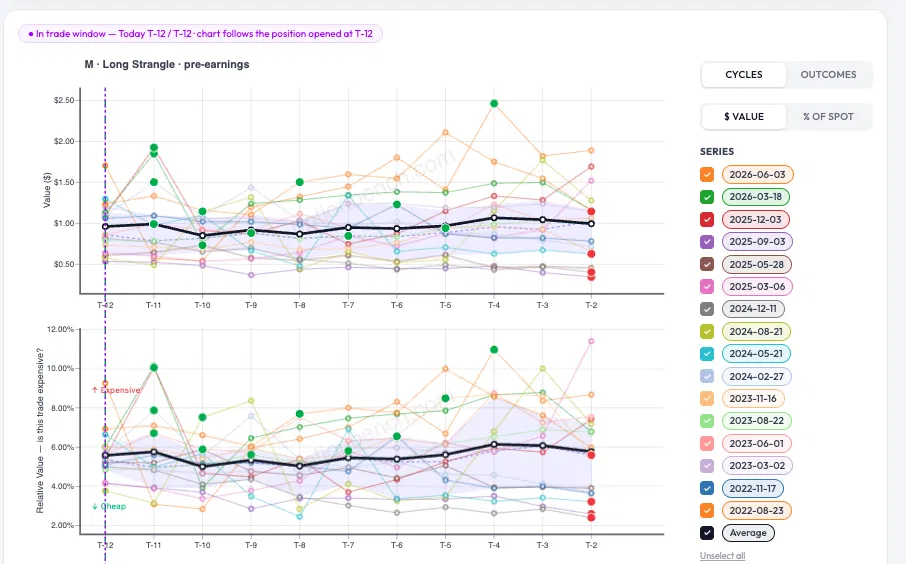
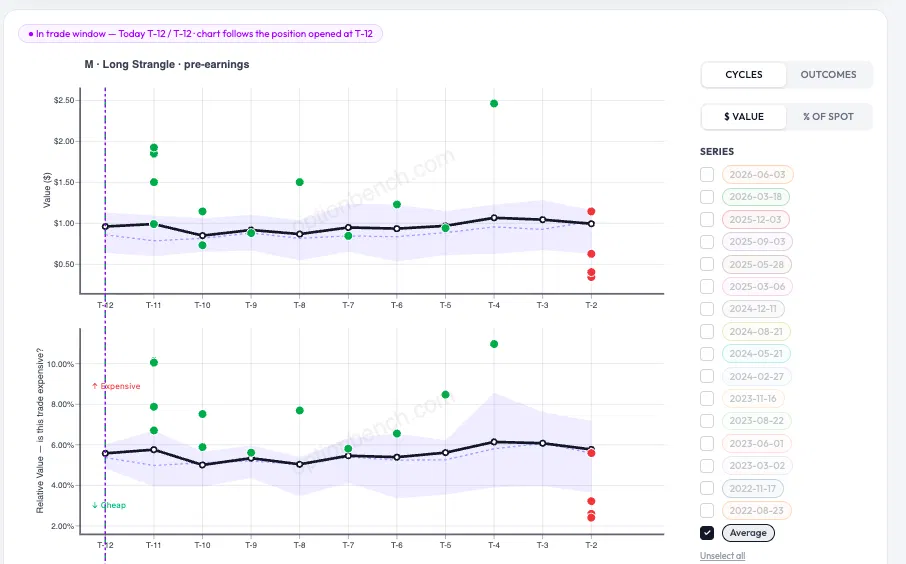
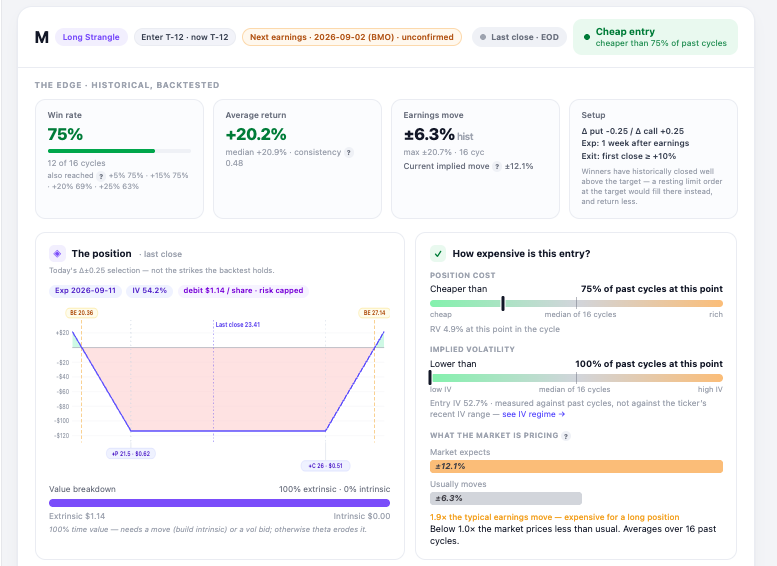
What a Monday morning looks like on OptionBench Someone asked what the workflow actually feels like rather than what the features are. Easiest way to answer is to walk through this morning. You land on Today. No search, no setup — the Opportunity Map is already there, showing what's in its entry window. One radio button switches between setups opening today and setups opening this week. Tiles are shaded by win rate, and each one carries the ticker, the entry date and the historical return. Markets are still closed as I write this, and the card says so — pre-earnings scanned this morning at 09:11, pre-events still on Friday's data. That's deliberate: you should always know which session you're looking at. Macy's caught my eye, so I clicked the tile and the row opened. The top strip is the backtested edge: win rate over 16 cycles, average and median return, the size of the move this name usually makes on earnings, and the exact rule the statistics were measured under — Δ±0.25, one week out, exit on the first close at or above +10%. Underneath, two things worth separating. On the left, the position as it prices right now — strikes, debit, and the fact that it's 100% extrinsic, which means it needs a move or a vol bid or theta gets it. On the right, whether that entry is expensive: cost cheaper than 75% of past cycles at this same point, implied vol at the bottom of its own range. Both needles sit left of the median, which is the reading you want. Below that, what the market is pricing against what the stock usually does: ±12.1% implied versus a ±6.3% average earnings move. Nearly twice the usual — which matters when you're buying. The playbook is four steps, collapsed by default. Timing, execution, what the trade is actually buying, and how it exits. The third one is the part most people get wrong: the position closes before the announcement, so the earnings move never enters the result. You're buying the ramp in implied volatility, not the gap. And the history. Every past cycle, value and relative value, with the current cycle overlaid. Green dots hit the target, red didn't. It gets busy fast, so you can strip it to the average band and read the shape instead. That's the whole loop: land, scan, open one row, decide. Free to look at — https://optionbench.com Not investment advice. The tool describes what setups have done historically; your broker's chain is where you check what actually fills.
-
Glad the scales read better: that was the intent, and you're the first to say so. On short strategies: yes, and closer than you'd think. Credit put and call spreads already exist in the platform as ETF screeners, but they're general screeners — not anchored to an event. What you're describing is different: selling premium into an earnings or macro event to collect the IV crush afterwards. That's been in my backlog since July under exactly that framing. The reason it hasn't shipped is that it's the mirror image of everything currently in there. Every strategy in the pre-earnings and pre-events scanners exits before the announcement: they buy the ramp in implied vol and never touch the move itself. A credit spread held through the print is the opposite trade: defined risk, but the event is now in your result rather than out of it. Different entry window, different exit rule, different backtest. Worth doing though, and the machinery for the backtest already exists in my code. If you have a view on where the short strike should sit — 15 delta, 20 delta — I'd take it, because that's the parameter I'd otherwise pick arbitrarily.
-
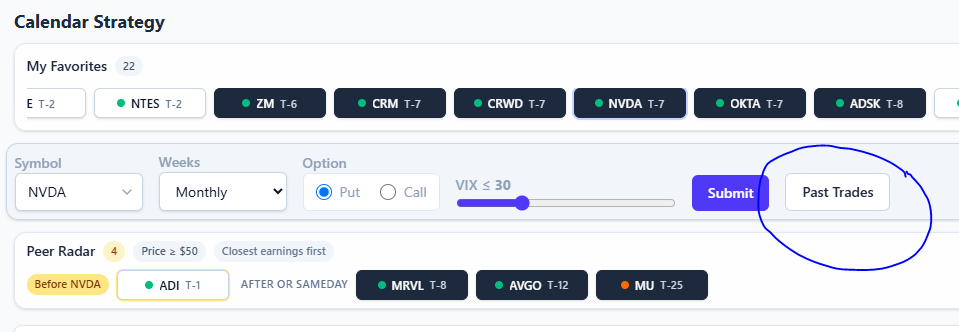
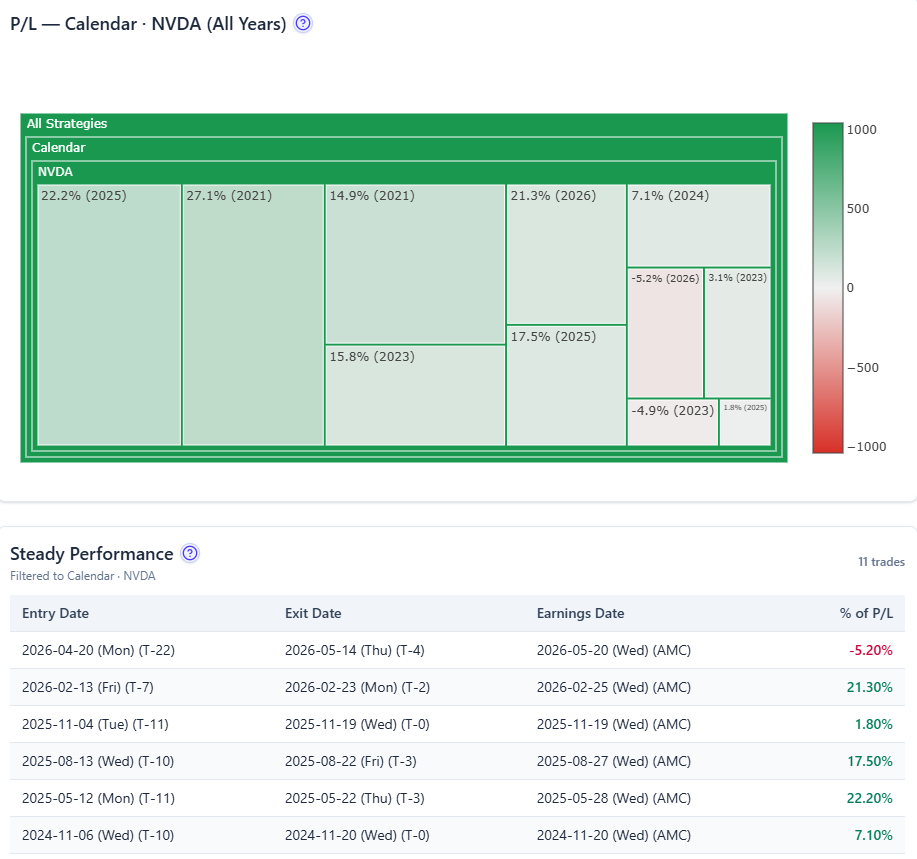
Here is another cool feature. Say you consider NVDA calendar, and you want to see how it performed in the past. It is one click away:
-
 Opening Process The opening rotation process for equity options traded during GTH will follow the existing RTH opening process for multi-list options with minimal modifications. A class will begin the GTH opening rotation upon receipt of the first round-lot print in the underlying from any exchange and observation of a two-sided bid/ask in the underlying from any exchange following the start of the GTH session (7:30 a.m. ET). For more information regarding the equity options opening process, see the U.S. Options Opening Process. Risk Management If a firm has existing Default Risk Management rules, those will automatically apply to both the GTH and Curb trading sessions. Alternatively, firms may choose to upload new rules for the GTH and Curb sessions. In order to have a new GTH or Default risk rule apply to the new multi-list GTH trading session, rules must be uploaded prior to 7:00 a.m. ET. Risk rules specified as Default or GTH and uploaded between 8:15 p.m. and 9:00 a.m. ET may optionally be applied immediately via the Customer Web Portal Risk Management Application. Firms cannot use the Secure Web API to make new rules immediately effective. In order to have any updated or new Curb risk rules apply to the multi-list Curb trading session, rules must be uploaded prior to 3:40 p.m. ET. The scheduled system risk reload times will be adjusted. Risk reloads will be scheduled to occur at 2:35 a.m., 7:05 a.m., 9:05 a.m., and 3:45 p.m. ET. In addition, the scheduled risk reload behavior will change. Scheduled reloads will only reset active risk counters for rules that have been changed. The existing Pre-Open/GTH Session exchange default fat-finger limits will apply to the equity options products eligible to trade in GTH. For more information, see the Cboe Titanium U.S. Options Risk Management Specification. Membership and Eligibility Trading Permit Holders (TPHs) must be authorized for GTH trading at the OCC and Cboe. Such authorization will allow GTH trading of equity options and Cboe proprietary index options. Thus, TPHs that are already authorized for GTH trading do not need any further authorization to trade equity options during the GTH session. No additional action is needed to participate in Curb trading. Order Handling and Market Functionality To ensure system readiness, please note the following: The existing SessionEligibility (FIX Tag 22017) will be used to designate session eligibility. GTC Orders carried over from prior sessions will retain their session eligibility. NBBO protection and routing functionality will apply during both GTH and Curb sessions. Quoting and trading activity will be sent over existing OPRA RTH channels. Quoting Obligations Quoting obligations for Designated Primary Market Makers (DPMs) will apply collectively across all classes and sessions for the DPM.* Quoting obligations for non-DPM Market Makers will apply collectively across all classes and sessions for the Market Maker. RTH DPMs for applicable classes can choose to retain or give up their DPM status during the GTH session. If DPM status is retained for the GTH session, then all DPM obligations will apply, including those applicable during opening rotation. Cboe may solicit for Market Makers to perform the GTH DPM role in classes where the RTH DPM declines.* *Subject to regulatory review Additional regulatory guidance will be provided in a forthcoming Regulatory Circular. Source: https://www.cboe.com/notices/content/?id=61230 What’s actually changing Cboe’s new structure adds two sessions to the trading day. The morning Global Trading Hours (GTH) session runs from 7:30 a.m. to 9:25 a.m. ET, with order acceptance starting at 7:15 a.m. ET. After the regular session closes at 4:00 p.m. ET, a brief 15-minute “curb session” extends trading to 4:15 p.m. ET. Why this matters for traders The practical impact centers on one thing: timing. Options traders have long faced an awkward gap between when market-moving information hits and when they can actually act on it with options contracts. If Nvidia drops guidance in a pre-market press release at 8:00 a.m. ET, equity traders could already adjust their stock positions. Options traders had to wait until 9:30 and hope their intended trade still made sense at whatever price the market had already moved to. That gap created a structural disadvantage for options-based strategies, particularly hedging. Portfolio managers holding large equity positions who rely on options for downside protection essentially had a 90-minute blind spot every morning where they could watch their stocks move but couldn’t adjust their hedges. That window just got significantly smaller. Institutional traders may benefit most in the near term. The 7:30 a.m. start aligns with European market hours, which could appeal to global funds managing cross-border portfolios. A London-based trader hedging US tech exposure no longer needs to wait until 2:30 p.m. local time to put on an options position.
 -
Thank you @Kim — and welcome to everyone who registered this week. A few of you asked what's actually inside. Fair question — the screenshots only ever show a corner of it. Here's the full picture, same platform for both paths: free with the All-services bundle for as long as you keep it, or $39.99/month at the introductory rate, grandfathered at whatever price you join at. The scale of it first, because it's the part you can't see from a screenshot. This isn't one strategy with a win rate on top. The platform models 27 distinct strategy variants on every name: Calendars — put and call, each at monthly or 1–5 weeks: 10 variants Strangles — ATM, ATM+1, ATM+2 wings Iron Flies — base, wing 1, wing 2 Double Diagonals — base, wing 1, wing 2 Long options — 40Δ and 90Δ, calls and puts Straddles and call debit spreads Few more strategies to be opened for public soon Every variant gets its own full return matrix — entry day × exit day, median historical return per path, every underlying earnings cycle preserved. Across 2,000+ symbols with backtested history, that comes to over 191 million backtested entry-to-exit outcomes sitting behind the screens — recomputed as new cycles complete, refreshed every trading day. When a tile shows you "Win 88%", the cycles behind it are one click away, with the VIX each one happened under. No summary stat without its receipts. How you actually use it, day to day: The Summary page — type a symbol, get the whole picture on one screen: next earnings date, current setup, where today's relative volatility sits against that name's own history, and the suggested structure. It's the "should I even look closer?" page. The Daily Screener — every name opening an entry window, across all variants at once, filterable by median return, win rate, strategy, weeklies, and spread. Liquidity (NBAS) is one gate among several, not the headline — probability and consistency do the ranking; the spread column just keeps the backtest honest about fills. The return matrix — the deep dive. Compare entering T-12 vs T-5, exiting before the print vs holding through it. Click any cell for the cycle-by-cycle history. Holding through the print — the matrices don't stop at T-0. The T-0 → T+1 paths show what historically happened when a position was held through the release — for every variant, every name. Whether holding through earnings has historically paid or punished on your specific setup isn't a debate; it's a column. Post-earnings outcome analysis — after each print, see how the setups you were watching actually resolved, so the review loop is built in. Peer earnings view — read HD's print against TGT and WMT before they report. Read-through weeks are half the season. Macro events calendar — FOMC, CPI, PPI [+GDP/PCE/JOBS if live] next to the earnings calendar, because some weeks the vol you're buying isn't earnings vol. And it's not just a calendar: the same backtest engine runs on macro events too — 130,000+ backtested outcomes on straddles and strangles entered around scheduled macro releases. Watchlists, favorites, and setup tracking — pin a setup, watch its pricing and expected move evolve daily through the print, review it after. Every tracked setup becomes a lesson. And it keeps moving. Check the What's New page: 8 additional features shipped in the last 4 weeks (we are not even 2 months after go-live) — the spread filter, peer earnings date overlaying on RV charts, macro events overlaying on charts...— nearly all of them because someone here asked. Lately the pace has been one to two releases a week, and the roadmap is mostly this thread's questions, ranked. If something's missing or confusing, DM @Kim or @krisbee — that's how the product gets built. Everything in the platform is historical/educational analysis, not trade recommendations or financial advice. Options trading involves substantial risk.
-
 Because most option traders live in 15-45 days-to-expiration land, there’s a myriad of factors they have to take into account when considering a trade in LEAPS options which aren’t present in short-term options. Implied Volatility is Higher in LEAPS Because of the long time to expiration for LEAPS, they carry higher implied volatility levels. This is intuitive, as in standard times, the VIX term structure is typically in contango, meaning future months get more expensive as you go into the future. Here’s an example of the VIX term structure at the time of writing, which is in contango: In other words, more can happen in more time. So the price of uncertainty goes up with time and hence the IV on LEAPS is expensive. Furthermore, there’s less selling pressure in LEAPS from option sellers. Premium sellers tend to pick shorter-dated options (<15 days) so they can quickly recycle their capital quickly. Selling LEAPS ties up your capital for long periods in exchange for a marginal increase in yield. It’s generally a bad trade, at least when it comes to systematic premium selling. They stay out of LEAPS and that keeps the IVs in LEAPS high. It might be obvious, but the best time to buy LEAPS is when the VIX is below its long-term average, and ideally when the underlying stock has a low IV Rank. The general consensus among academics who study volatility is that it clusters and trends in the short-term and mean-reverts in the long-term. For this reason, buying LEAPS at a low VIX and IV Rank puts extra wind at your back. Interest Rates and Dividends Actually Matter The average options trader lives in 15-45 days-to-expiration land. They seldom need to think hard about how their positions are impacted by the distributions of dividends, or changes in interest rates (Rho). But when it comes to LEAPS on a stock that pays a dividend, there’s going to be several dividend payments throughout the life of the option, and as we well know, interest rates can change dramatically over the course of 1-3 years. While these factors are mostly priced into market prices already, future changes in rates or dividends can impact your position in ways you don’t understand if you go into LEAPS blindly. Below is a chart from Lawrence McMillian’s excellent book Options As A Strategic Investment displaying a series of expirations and how their pricing differs with changes in interest rates. Note that the bottom line is value at expiration. And here’s a chart from the same book displaying how changes in dividends affects call option pricing: These two factors are of special importance in 2022’s market environment of rising interest rates and energy being the leading sector. Due to a myriad of factors, energy companies often choose to distribute earnings as dividends in lieu of investing in growth as tech companies might. Traders holding LEAPS in energy equities have probably learned a thing or two this year. LEAPS Have Far Less Liquidity Besides having less interest from option traders, market makers are generally less active in LEAPS and tend to quote very wide spreads. This can make establishing a position of any reasonable size a pain. Because option prices have definitive and knowable characteristics allowing you to ascribe a theoretical fair value to them, it’s far easier to get someone to trade with you if you’re will to pay a premium to the theoretical value. However, as good traders often say, getting into a trade is seldom a problem, getting out when out when you need to is the issue. How Traders and Investors Use LEAPS? Position Trades Many short-term traders who are used to holding their positions in the area of hours or days don’t like to/aren’t experienced at managing a longer-term delta-one position. Instead, they’ll often use LEAPS to express these longer-term views. Whatever their initial risk (perhaps 1% of their trading equity) would have been on the trade, they’ll use that to buy LEAPS, which they can kind of “set and forget” and not fiddle with stop losses and gap risk. This has the added benefits of providing leverage to their positions as well as not tying up much of their capital for long periods. An Alternative to Index Investing Whatever you think of the Boglehead philosophy of index investing being nearly the only way to invest smartly, they’ve had a pretty good track record for the last few decades when compared to actively managed fund options. But skeptics of passive investing still have a problem with blind faith in long-term return averages continuing into the future, but don’t want to miss out on potentially amazing yield. One way to replicate a return profile similar to that of passive index investing is to use LEAPS on index ETFs like SPY by periodically rolling at-the-money calls forward and funding the negative carry with the dividends supplied by a modestly sized high-yield dividend portfolio. Enhancing Returns of Long-Term Holdings Many hedge fund managers for whom their largest position is asymmetrically larger than the rest of their positions are presented with a problem. They’re loaded up to full size and then the position declines in value, creating an excellent opportunity to buy more at a great price. But they don’t have the capital or simply can’t risk more on what is already their largest position. In this case, they might use LEAPS to increase their upside for a small relative cost. Betting Against a Short Seller’s Nightmare Tesla (TSLA) is the perfect example of a stock that many traders desperately want to short exposure to, but the volatility is simply too high. There’s a whole graveyard of long/short managers who got taken to the cleaners shorting Tesla (TSLA). This is where buying LEAP puts would be a viable alternative. You still get the upside if your thesis is correct In the situation of Tesla, the bet was binary in nature for many of the company’s skeptics. They’re sure that the company is an eventual zero and if not unless they can find a strategic buyer like Volkswagen before the worst happens. Do note that this isn’t our view, instead, we’re just explaining the thinking of many Tesla shorts. In a binary situation like the one above, the put premium paid isn’t even of much concern if you expect such a dramatic move to the downside. The only concern is timing, of which LEAPS provides plenty. There’s a number of stocks in the same camp as Tesla in that the volatility is too difficult to deal with. Protecting Long-Term Positions Just as the Tesla bear might opt to use LEAPS calls to express their bearish view in a risk-defined manner, the Tesla bull might, too. With a stock like Tesla being such a high-risk, high-reward bet, even the bulls are aware of the significant risks to their thesis. For them, the trade is semi-binary in nature as it is for the shorts, at least far more so than buying the S&P 500 is. This is where they might use out-of-the-money LEAPS to protect their worst case downside while still benefiting from the same upside. Bottom Line While LEAPS aren’t very popular among traders due to opportunity cost on capital, they provide an excellent avenue for traders to limit their risk while making long-term leveraged bets. It’s for this reason that LEAPS are frequently overpriced, because there are few natural sellers. If you dip your toe into LEAPS, make sure you take heed of the differences between LEAPS and short-term options: Lower liquidity Higher IV Dividends and interest rates actually have a significant impact on LEAPS positions.
 -
Pre-Earnings Entry Price: What 31,000 Cycles Say
Kim commented on Romuald's article in SteadyOptions Trading Blog
@TrustyJules spot on. I actually had couple of articles discussing it: Why Winning Ratio Means Nothing Risk/Reward Vs. Win Ratio Risk Reward Or Probability Of Success? -
 As a reminder, a strangle involves buying calls and puts on the same stock with different strikes. Buying calls and puts with the same strike is called a long straddle. Strangles usually provide better leverage in case the stock moves significantly. So let’s see how it works. First, you must identify stocks which have a history of big post-earnings moves. Some examples include AMZN, Netflix, Google, Priceline (PCLN), and others. Then you buy a strangle or a straddle a day or two before the earnings are announced. If the stock has a big move, you sell for a big profit. The problem is you are not the only one knowing that earnings are coming. Everyone knows that those stocks move a lot after earnings, and everyone bids those options. Following the laws of supply and demand, those options become very expensive before earnings. The IV (Implied Volatility) jumps to the roof. The next day the IV crashes to the normal levels and the options trade much cheaper. Let’s examine a few test cases from the 2011 earnings cycle. AKAM announced earnings on Oct. 26. The $24 straddle could be purchased for $4.08. IV was 84%. The next day the stock jumped 15%, yet the straddle was worth only $3.81. The reason? IV collapsed to 47%. The market “expected” the stock to move 17-18%, based on previous moves, but the stock moved “only” 15% and the straddle lost 7%. BIDU announced earnings on Oct. 26. The stock moved 4.5% following the earnings. You could purchase the straddle at $19.55 the day before earnings. The same straddle was worth $13.47 the next day. That’s a loss of 31%. TIVO moved 2%, the straddle lost 29%. FSLR moved 3%, the straddle lost 55%. Now let’s check a couple of good trades. NFLX announced earnings on October 24. The stock collapsed 34.9% the next day, a move of historical proportions. The 120 strangle could be purchased the day before earnings at $24.52 and sold the next day at $43.00. That’s a 75% gain, but this is as good as it gets. This is a move of historic proportions but the trade is even not a double. AMZN straddle gained 57%. CME straddle gained 62%. GMCR straddle gained 84%. It is easy to get excited after a few trades like NFLX, GMCR, CME and AMZN. However, we have to remember that those stocks experienced much larger moves than their average move in the last few cycles. In some cases, the move was double what was expected. NFLX and GMCR moved more than 35%, the largest moves in at least 10 years. Chances are this is not going to happen every cycle. There is no reliable way to predict those events. The big question is the long term expectancy of the strategy. It is very important to understand that for the strategy to make money it is not enough for the stock to move. It has to move more than the markets expect. In some cases, even a 15-20% move might not be enough to generate a profit. Some people might argue that if the trade is not profitable the same day, you can continue holding or selling only the winning side till the stock moves in the right direction. It can work under certain conditions. For example, if you followed the specific stock in the last few cycles and noticed some patterns, such as the stock continuously moving in the same direction for a few days after beating the estimates. Another example is holding the calls when the general market is in uptrend (or downtrend for the puts). However, it has nothing to do with the original strategy. From the minute you decide to hold that trade, you are no longer using the original strategy. If the stock didn’t move enough to generate a profit, you must be ready to make a judgement call by selling one side and taking a directional bet. This might work for some people, but the pure performance of the strategy can be measured only by looking at a one day change of the strangle or the straddle (buying a day before earnings, selling the next day). The bottom line: Over time the options tend to overprice the potential move. Those options experience huge volatility drop the day after the earnings are announced. In most cases, this drop erases most of the gains, even if the stock had a substantial move. Jeff Augen, a successful options trader and author of six books, agrees: “There are many examples of extraordinary large earnings-related price spikes that are not reflected in pre-announcement prices. Unfortunately, there is no reliable method for predicting such an event. The opposite case is much more common – pre-earnings option prices tend to exaggerate the risk by anticipating the largest possible spike.” It doesn’t necessarily mean that the strategy cannot work and produce great results. However, in most cases, you should be prepared to hold beyond the earnings day, in which case the performance will be impacted by many other factors, such as your trading skills, general market conditions etc. To hedge your bets and reduce the loss if the stock doesn't move, you might consider trading a Reverse Iron Condor. This article was originally published here. Related articles: How We Trade Straddle Option Strategy Exploiting Earnings Associated Rising Volatility Buying Premium Prior To Earnings - Does It Work? Can We Profit From Volatility Expansion Into Earnings? Long Straddle: A Guaranteed Win? Straddle, Strangle Or Reverse Iron Condor (RIC)? How We Made 23% On QIHU Straddle In 4 Hours Why We Sell Our Straddles Before Earnings Selling Strangles Prior To Earnings How To Calculate ROI On Credit Spreads Straddle Option Overview Long Straddle Through Earnings Backtest Straddles - Risks Determine When They Are Best Used The Gut Strangle Long And Short Straddles: Opposite Structures
 -

Pre-Earnings Entry Price: What 31,000 Cycles Say
TrustyJules commented on Romuald's article in SteadyOptions Trading Blog
Thank you - great insight. A side remark, in options trading it is standard that high probability trades create frequent serial wins and incidental massive losses whereas low-probability ones give incidental high returns and frequent series of low losses. This is a pattern that returns all the time in any strategy and cannot be defeated. The entry and management of the trade is therefore always essential to gain the edge - as you put it a high probability trade is not an edge but neither is a low probability trade the lack of an edge. If you can find low probability trades and reduce your number of losses you will come out ahead - same with high probability trades avoiding the one killer loss is the real edge. Iron Condors are the most simple example of them - opening them on a low vol. underlying like SPY will get you profits most of the time and then one loss that will swallow 5 wins. End of the year - barring management is a zero sum game.