All Activity
- Today
-
@Romuald The new opportunity map is great! Cant wait to test it!! May be you can ask subscribers to inform you of their results, with some details so that you can estimate the win rate and what the subscribers did right & what they need to be cautious about.
-
@Romuald great post and like the new look of the opportunity map ... excited to see what the week ahead brings us ... one question (you know I had to have at least one 😁) when reload cheapness is initiated only certain tickers display a value (AKAM, CVS) ... I know they are based on Friday's close and we won't see live updates until appx 30 minutes after open tomorrow but curious why AMD and PBR don't show a value now
-
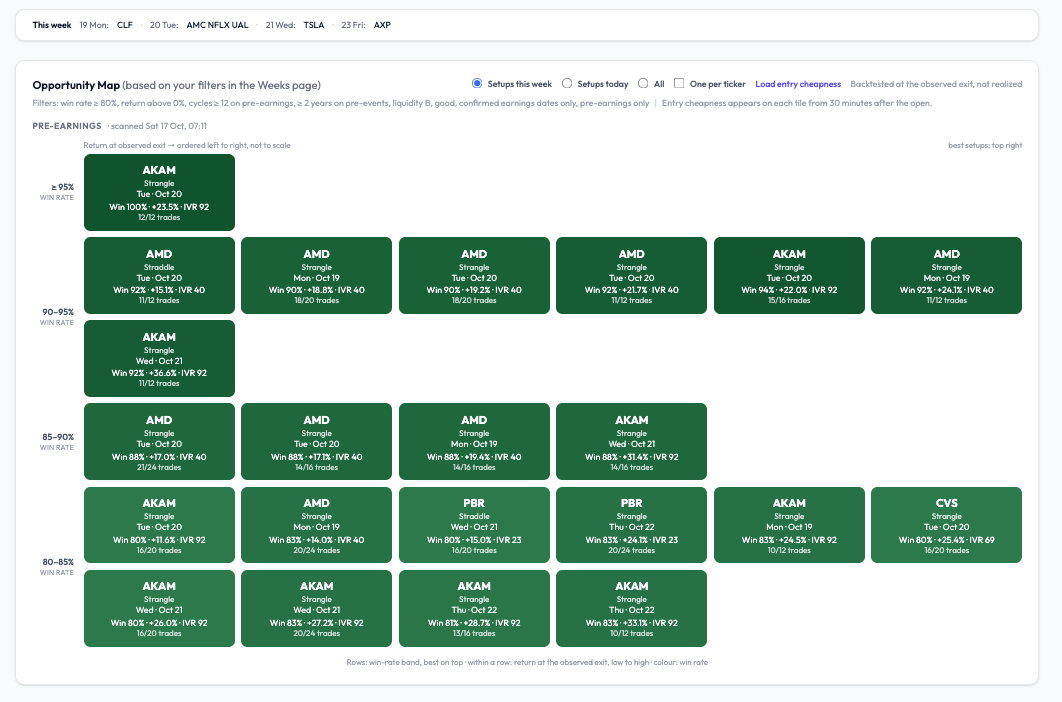
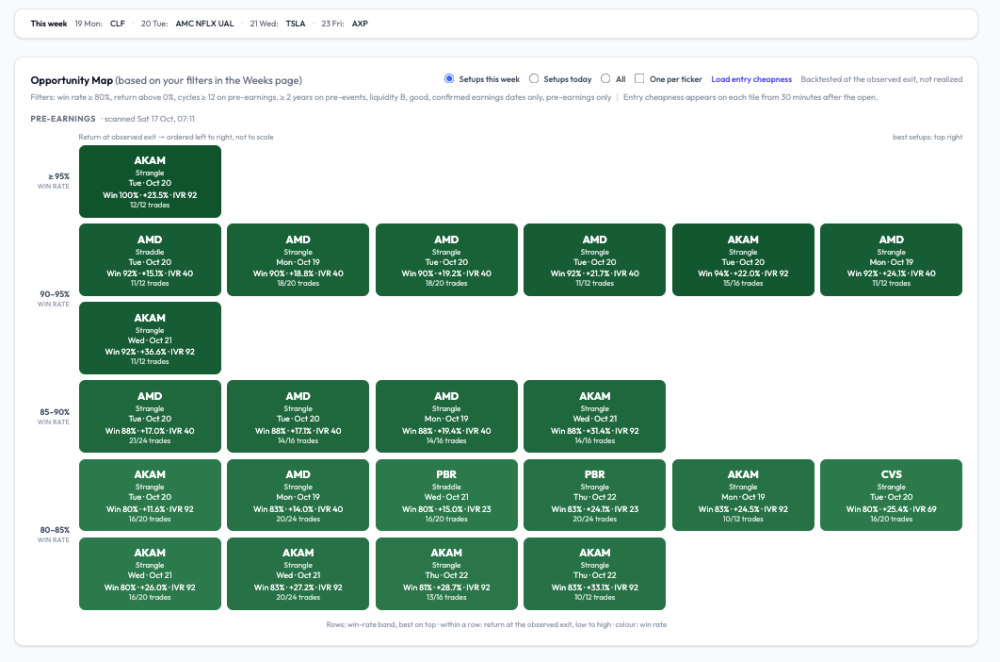
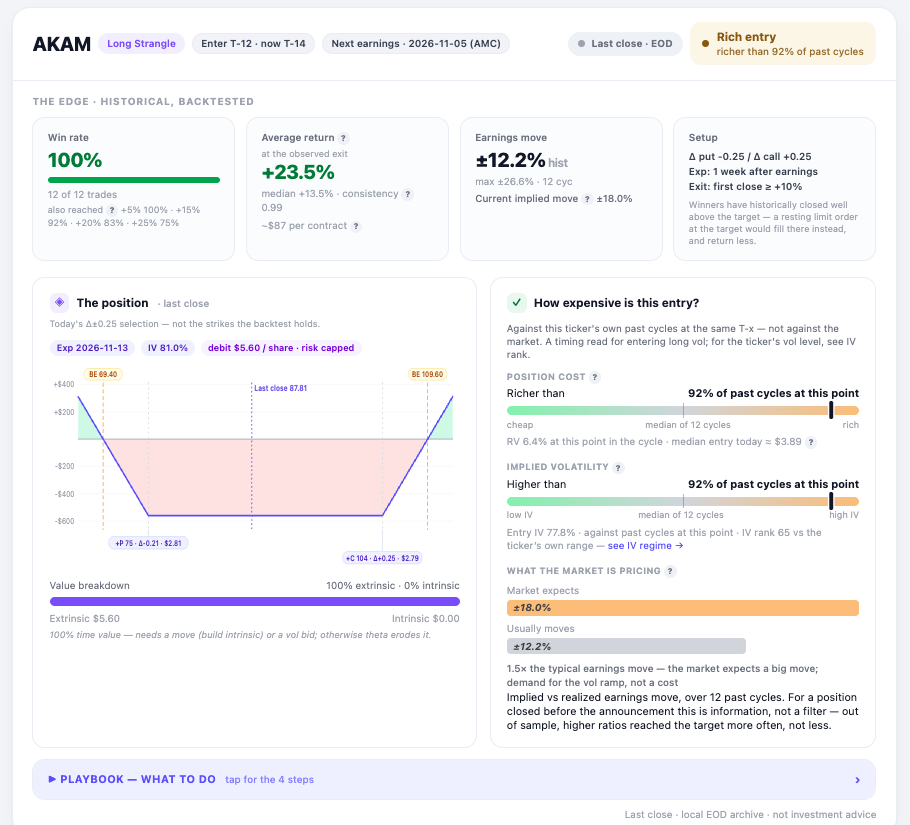
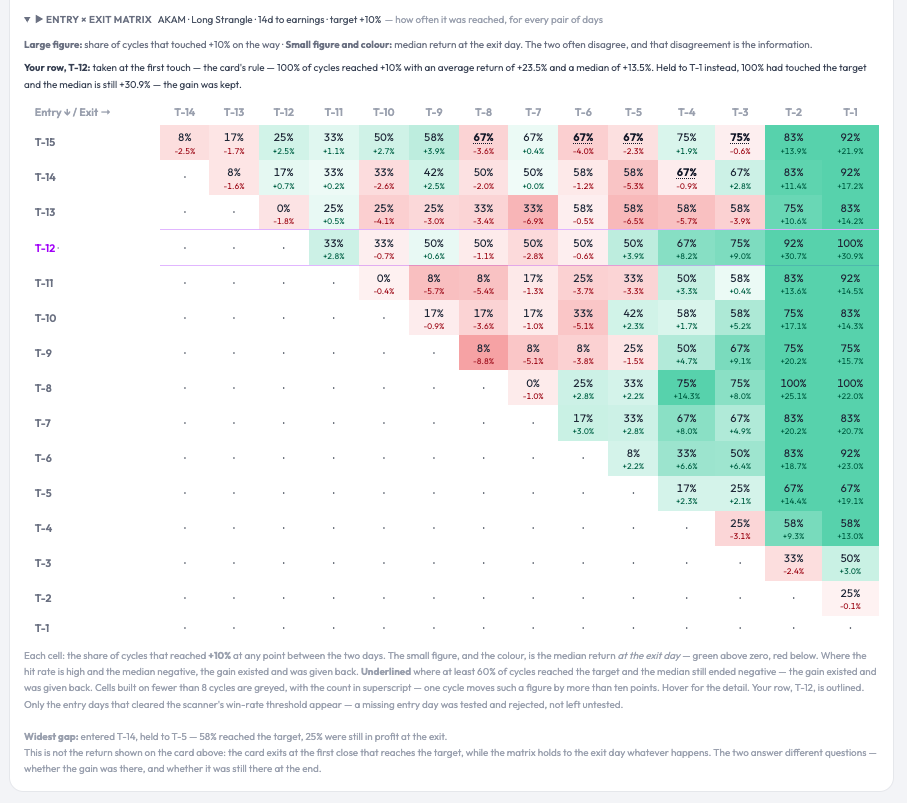
A good-looking pre-earnings week — on paper. The entry will decide. Next week’s scanner is unusually rich in pre-earnings setups with long, clean records: AMD (reports Nov 3, confirmed), AKAM (Nov 5, confirmed), CVS (Nov 4, confirmed), PBR (Nov 10, confirmed). Screenshot below, filtered to confirmed announcement dates only, win rate ≥ 80 %, at least 12 cycles, liquidity B or better. Two things changed in how the grid reads on optionbench, and I’d rather explain them than let you guess. The layout is now an X-Y ranking. Rows are win-rate bands, best on top (≥ 95 %, 90-95 %, 85-90 %, 80-85 %). Within a row, tiles are ordered left to right by return at the observed exit, low to high: ordered, not to scale. So the best setups sit top right, and a tile’s position tells you two things at once without reading it. Colour still encodes win rate. Every tile shows the sample as a fraction (12/12, 18/20) next to the percentage, because 100 % on 12 is not the same evidence as 90 % on 20. The return is “at the observed exit.” That’s the close of the day the position first crossed +10 %, which overshoots the target: AKAM’s +23.5 % average comes with a +13.5 % median. A resting limit at +10 % books less. Both figures are on the card. Now the part that matters. AKAM at T-12 is the strongest line of the week: 12 of 12 cycles reached +10 %, and the entry×exit matrix shows the gain was still there at T-1 in 100 % of them (median +30.9 % held: unusual; on most names the gain exists and has to be taken). Yet today the same card reads Rich entry - richer than 92 % of past cycles at this point, IV higher than 92 % of them, implied move 18 % against a 12 % realised average. The historical record says the setup works; the gauge says Friday’s close was a poor moment to pay for it. Both are true, and the gauge is the one that has been monotonic out of sample: the richer the entry, the worse the outcome, at every level. So the week is promising and no tile is a trade. On each entry day, after the first half hour, the live gauge on the card decides — cheaper than the median, or pass. Click any tile and you get the full card: the historical edge, the live position with its gauges, the playbook (what to do, in four steps), and the entry×exit matrix that shows, for every pair of entry and exit days, how often +10 % was touched and what the median return was if held — the two numbers that usually disagree, and that disagreement is the point. One correction on labelling, since someone will check: when a date shows “estimated”, it means our calendar source has not published a report time yet — the company may well have announced it. The screenshot excludes those on purpose. Romuald - OptionBench.com
-
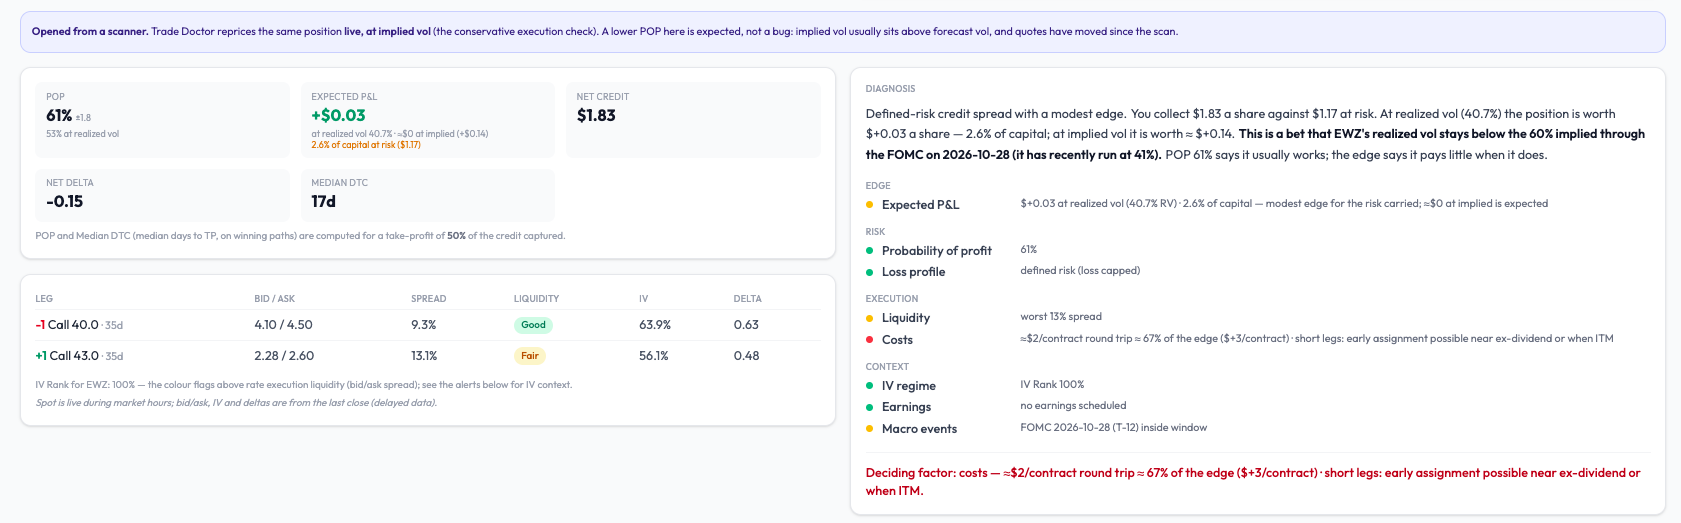
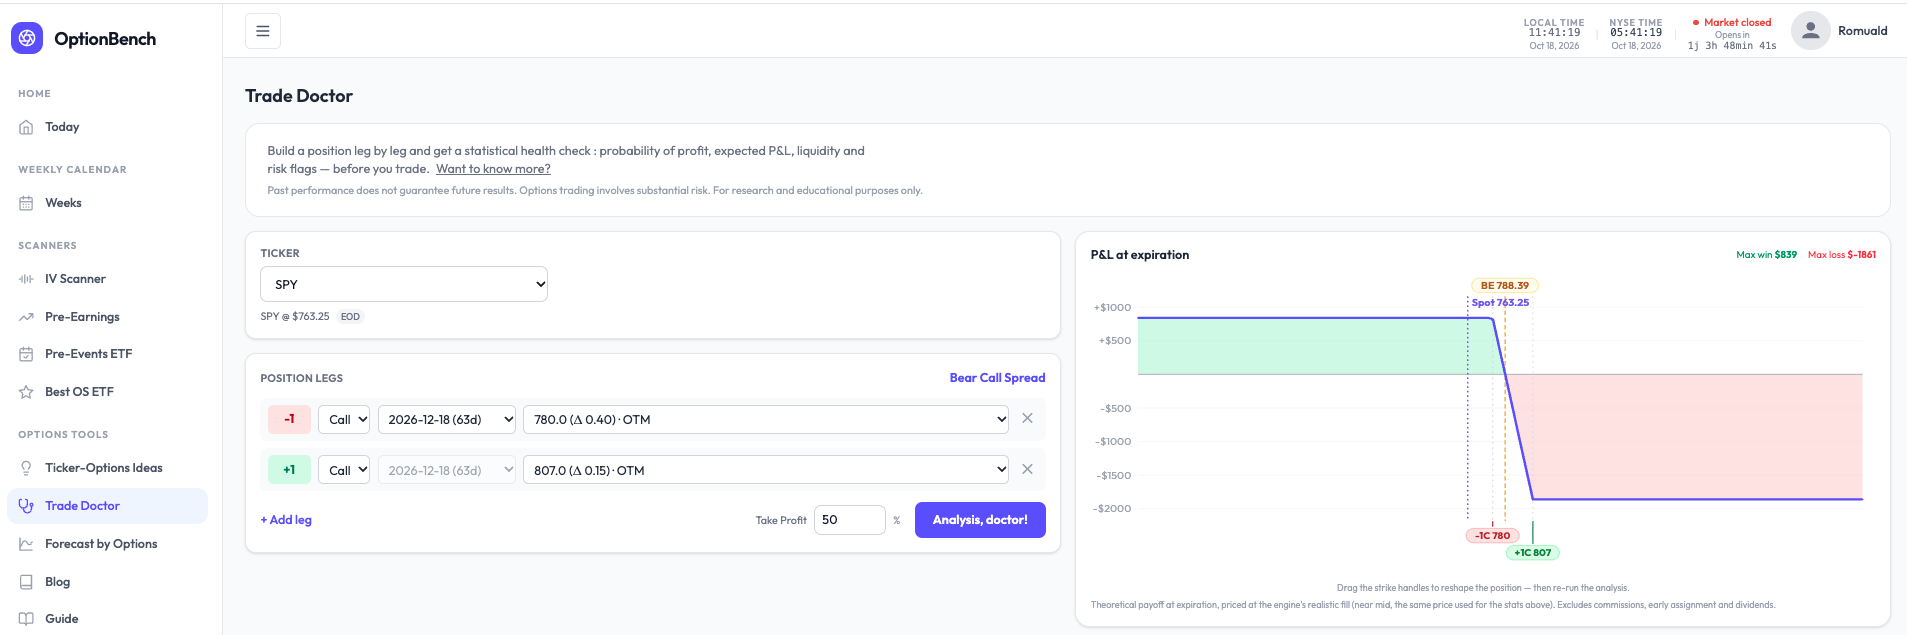
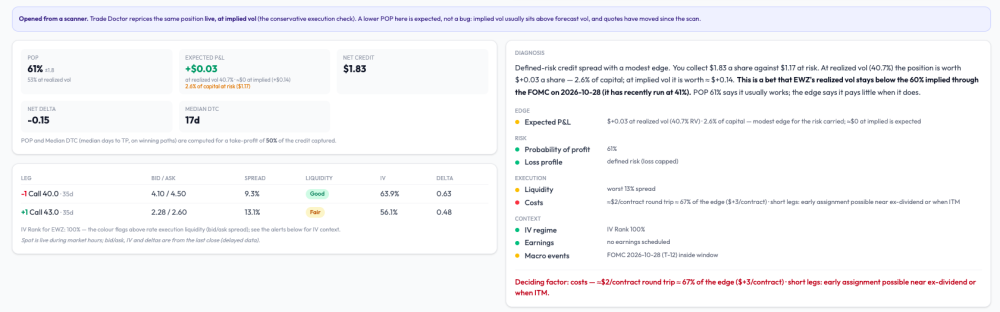
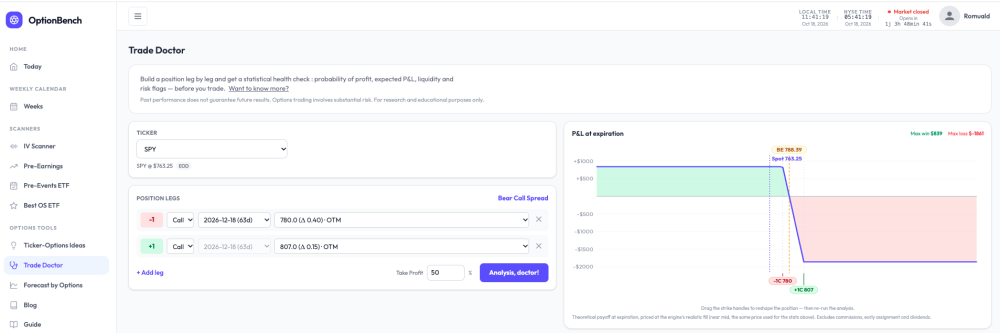
What are you actually betting on? A small change to how Trade Doctor reads a position. Every options tool shows a POP. Almost none tells you what the bet is. A bear call spread on SPY with POP 81% reads like a good trade — until you ask what has to be true for it to pay, and what it pays when it does. I rebuilt the diagnosis block of OptionBench’s Trade Doctor around that question. It now opens with a plain-language reading, computed, not written by a model. For that SPY spread (−780/+807 calls, Dec 18): Defined-risk credit spread with a modest edge. You collect $8.39 a share against $18.61 at risk. At realized vol (10.1%) the position is worth +$0.69 a share — 3.7% of capital; at implied vol it is worth ≈ $0. This is a bet that SPY’s realized vol stays below the 12% implied through the FOMC on Oct 28 (it has recently run at 10%). POP 81% says it usually works; the edge says it pays little when it does. Then four questions — edge, risk, execution, context — one finding per line, one number per finding, all in the same convention. And one last line naming what weighs most: Deciding factor: the edge — +$0.69 a share at realized vol, 3.7% of capital. A rise in realized vol toward implied erases it. No verdict. The tool doesn’t say take it or pass. It says what the bet is, where it’s thin, and what would break it — the three things you need to decide for yourself, in the order you need them. On an EWZ spread it wrote “Deciding factor: costs — a $3/contract edge against ≈$2 of commissions; little is left after the broker.” That sentence has saved a few of us from a few trades. The point isn’t the SPY spread. It’s that “81% POP” and “pays little when it works” are both true of the same position, and most screens only show you the first one. Romuald - OptionBench
- Yesterday
-
An OptionBench member asked me whether “rich” pre-earnings vol means we should be selling it. Worth answering in public, because the premise is where most people trip. “Rich” on our gauge is relative: the straddle today versus that same name’s past cycles at the same distance from earnings. It says nothing about absolute vol; and absolute vol is low right now (SPY sits at IV rank 13). Selling index premium here collects little for the same risk. Our structure scanner (it sweeps straddles, strangles, condors, butterflies, debit and credit spreads on 26 ETFs and ranks them by expected value over risk at realized vol) built a SPY bear call spread on Friday and rejected it at 2.4% EV/risk: under the 3% we treat as the friction floor. Selling vol isn’t missing from the toolbox; the toolbox is saying it doesn’t pay this week. Selling single-name vol into earnings because the straddle is rich is a different trade: short gamma into a gap. We backtested that family this summer. The seller’s edge holds as long as nothing moves and collapses on the moves above 10%: a 75% win rate with the losses doing all the work. Not something I’d publish with a win rate attached. What does make sense in a rich regime is what the member actually did: he passed. Entry richness is the strongest single predictor we’ve measured on 95,000 pre-earnings cycles, and it’s monotonic — the richer the entry, the worse the outcome, at every level. Waiting is a position.
- Last week
-
 William Lento joined the community
 -
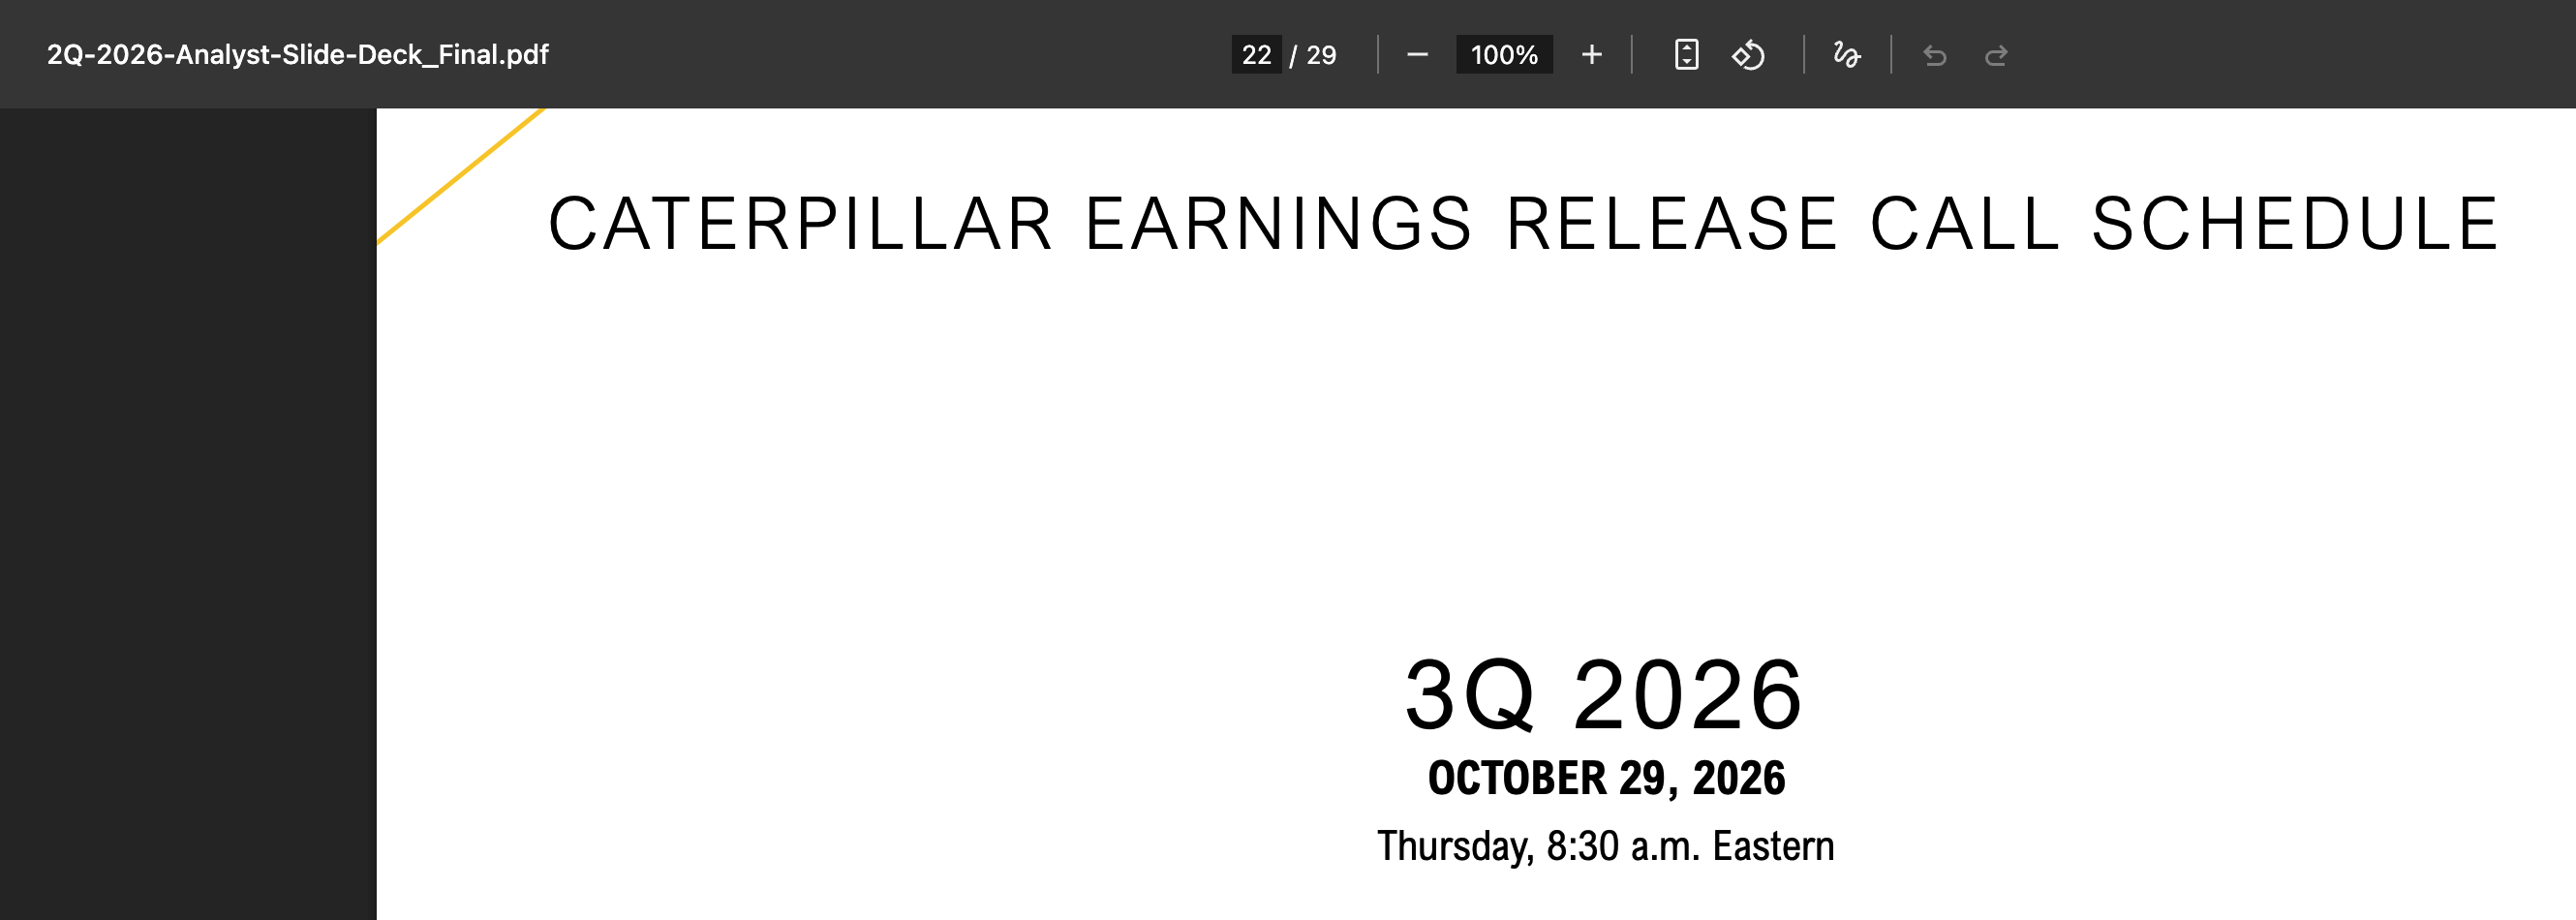
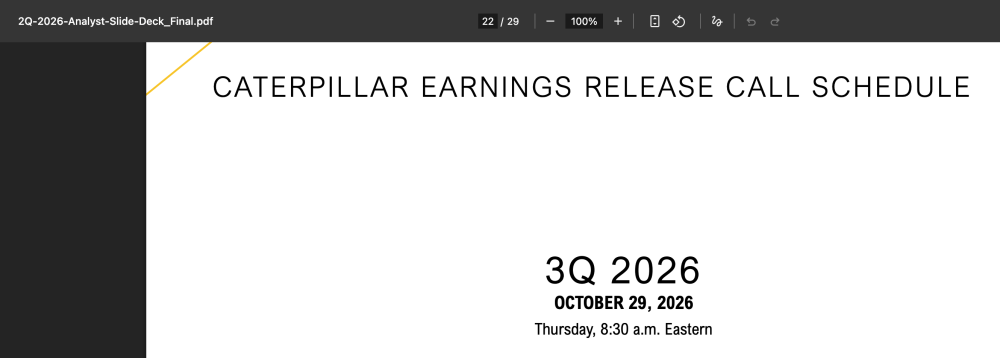
I'm glad you used those links to double check the dates. Thats the whole purpose of making lives easy to click the IR link before placing the trade. Regarding CAT they gave the dates in different place on their website here https://s25.q4cdn.com/358376879/files/doc_financials/2026/q2/2Q-2026-Analyst-Slide-Deck_Final.pdf Page 22. In our experience 90% of the time the confirmed flag aligns with the dates, but there could be misses when the company decides to push the date, they even cancel the earnings call. I have a routine to keep checking the dates across all earning symbols. As a good practice we need to always check the investor relations page to confirm again. I'll try to add the features on the Earnings calendar pages. In the month of August we added 40+ features & improvement, September 30+, this month we rolled out 10+ features. Please check out Gex & RSI in the menu. Articles coming out on those soon.
-
Confirmed Earnings Dates - I am confused. I love your approach and the simple filter earnings date confirmed, even adding the IR web link leading to the investors page. I have great belief in your resources getting earnings dates confirmed so I just want to verify how you get the dates verified even when the IR page does not have the date yet (CAT) or shows projected (AMAT)? Can you please add an USD range, liquidity and a strategy filter to your EarningsCalendar page?
-
 froilancin joined the community
 -
We are doing another round of research on traders' views around psychology. The survey is now live: https://www.surveymonkey.com/r/steadyoptions
-
- 2
-

-
 darkhand3001 joined the community
 -
 Greenberg Rapp Financial changed their profile photo
 -
Greenberg Rapp Financial joined the community
- Earlier
-
 ronbeton joined the community
 -
Thanks, sorry i didn’t see this before. You can follow this link with the original inspiration https://steadyoptions.com/forums/forum/topic/3885-volatilityhqcom-official-thread/?page=14#findComment-152525
-
 Hi everyone, I’ve been experimenting lately with how we build and backtest options strategies — especially Iron Condors, Calendar Spreads, and simple directional setups that many of us discuss here. For a long time, I’d sketch out ideas manually, then translate them into TradingView code line by line — tweaking entry rules, exit conditions, stop levels, and Greek filters. It’s slow work, and it’s easy to introduce small errors that throw off the whole backtest. Recently I came across a tool that writes full, usable Pine Script from plain descriptions — things like “sell Iron Condor when IV is above 25, wings 15 delta, close at 50% profit or 2x loss” — and it produces compilable code right away. It’s at tradingviewai.dev — I’ve been using it to turn strategy concepts into testable scripts in minutes instead of hours. It doesn’t replace the thinking — you still need to define the logic, understand the Greeks, and validate the results — but it removes the coding friction so you can iterate faster, test more variations, and actually focus on whether the edge is real. Has anyone else been using AI to generate or refine their TradingView scripts? Curious how you’re integrating it into your workflow — or if you’ve found it helps speed up your strategy development cycle.
 -
Leander joined the community
-
Hi everyone, I’ve been following discussions here about refining entry/exit timing, backtesting spread setups, and spotting high-probability setups across different timeframes—great insights shared lately, especially around managing Iron Condors and adjusting deltas. One challenge I keep running into is turning a proven strategy idea into actionable signals or reusable scripts. I’ve spent evenings writing and tweaking code, only to find small syntax differences or data handling quirks throwing results off. It got me wondering: what’s your workflow for translating a strategy into something you can actually apply on the chart? Recently I came across a tool that generates ready-to-use scripts directly from strategy descriptions—no manual coding line-by-line. You describe your setup, rules, filters, and it produces working code you can drop straight into TradingView. It’s been a huge time-saver when testing variations of credit spreads and trend-following approaches, letting me iterate much faster. Has anyone here tried AI-assisted code generation for their trading scripts? Do you prefer building everything fully manually, or do you use tools to speed up the drafting phase? I’d love to hear what workflows or tools others in this community rely on. Thanks!
-
 jiaozi577 joined the community
 -
 PropFirmKey joined the community
 -
 PropFirm Experts joined the community
 -
@Djtux, I started using the site a few months ago, and wanted to let you know I absolutely love it! I do have a question. Can you explain to me the non-earnings income calculator page? If you've done so already, can you point me to that? I wasn't able to find anything. Thanks! Sean
-
My understanding is that we should invest a maximum of $100K in SO options trades, which means a maximum of $10K per trade.
For example, if a $10K portfolio grows to $13,225 (As of Today), then proportionally a $100K portfolio would grow to approximately $132K.
From that amount, we would still need to deduct the SO fee ($1,500), options trading commissions, and short-term capital gains taxes, which can be significant.
Even after these deductions, the percentage return still looks very good and appears to outperform the market (for example, SPY). However, the actual net profit after fees, commissions, and taxes may be around $20K( Very Less) , depending on the tax rate.
Is my understanding correct, or am I missing something in this calculation?
-

-

-
As I mentioned, it will depend on your broker commissions and your tax rate. Broker commission should be close to zero if you use broker like Tradier. Taxes are paid on any gains, no matter if you make them with SO or independently. Knowing your tax rate, you should be able to calculate the net gain pretty easily.
Personally I prefer to pay high taxes because it means I made high gains.
-
-

Schwab and ThinkOrSwim Outages - login, transfers
mrputsncalls replied to mrputsncalls's topic in General Board
I was able to do options trades on ToS, unrelated to SteadyOptions. Fund transactions on website still not available. Hopefully not affecting many... -
Schwab and ThinkOrSwim Outages - login, transfers
mrputsncalls replied to mrputsncalls's topic in General Board
Hopefully they have ways (server farms) to process at least some of the requests. I finally was able to login to ToS. Still not able to do fund transactions on Schwab website. -

Schwab and ThinkOrSwim Outages - login, transfers
rasar replied to mrputsncalls's topic in General Board
Hmmm. I don't see a problem at my end. I've been logged into ToS since 8:20 CST this morning. -
Not sure if it helps to community but Schwab and ThinkOrSwim seems to be experiencing outages of completely not letting users login nor do transactions once logged in (website seems to allow login). Seems to be consistent with DownDetector dot com reports...
-

Delta-Neutral Options Strategies for Earnings
krisbee posted a article in SteadyOptions Trading Blog
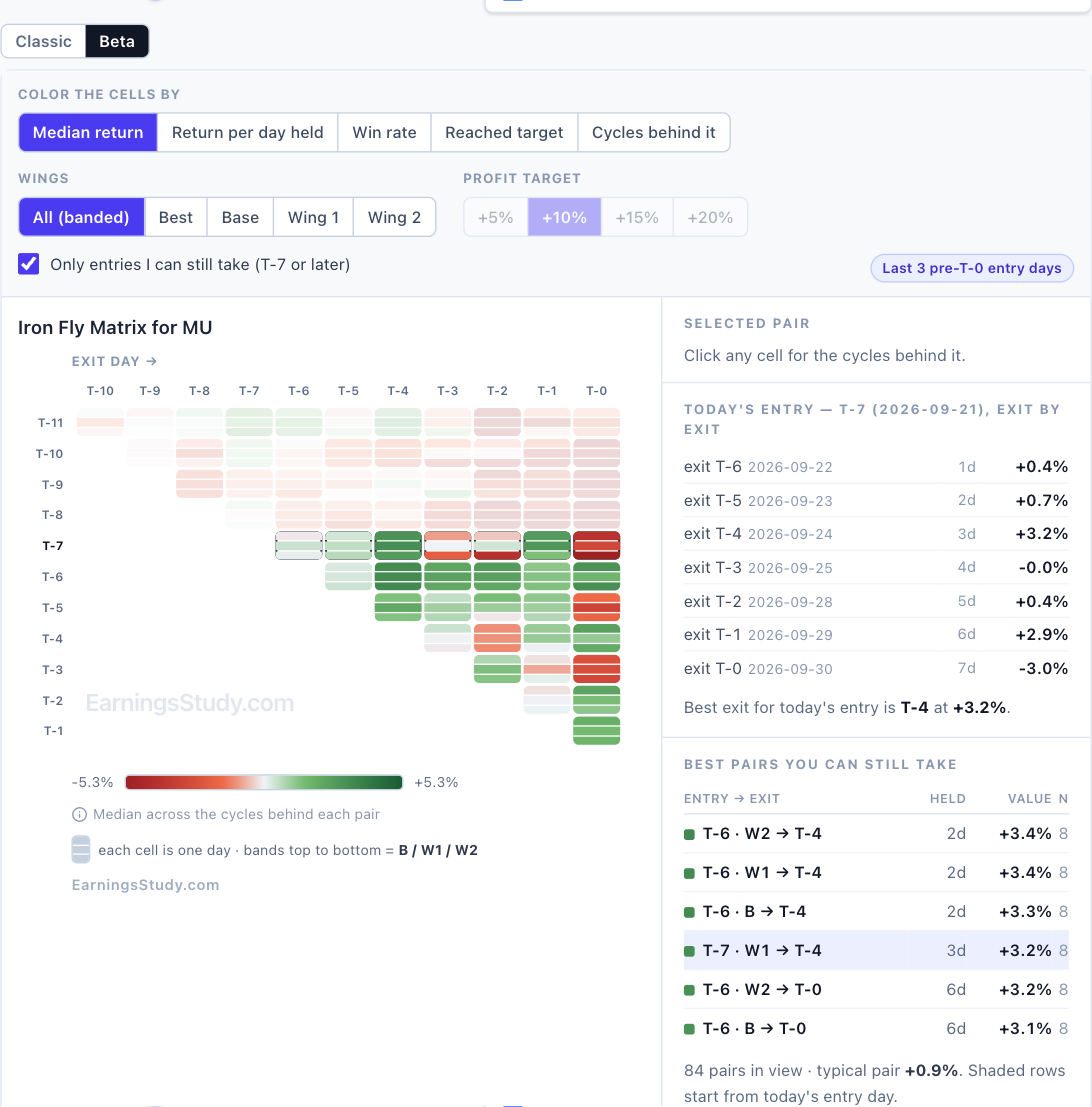
 The foundation of these strategies is a concept called delta-neutral. This guide explains what delta-neutral means, walks through the core neutral structures traders use around earnings, and shows each one on a real setup using EarningsStudy — with the actual strikes and relative-volatility readings the platform generates. We'll use Micron (MU), Costco (COST), and JPMorgan (JPM) as running examples, all heading into confirmed earnings reports. First, what is delta? Delta measures how much an option's price changes when the underlying stock moves $1. A call has a positive delta between 0 and 1; a put has a negative delta between 0 and -1. Beyond that, delta has a second use that matters most here: it's your directional exposure. Positive total delta means you profit when the stock rises; negative total delta means you profit when it falls. A position is delta-neutral when its legs' deltas add up to approximately zero. At that instant, small moves in the underlying — either direction — have roughly no effect on the position's value. You've removed directional risk and positioned yourself on something else: volatility and time. Once direction is neutralized, your profit and loss is driven by the other Greeks — gamma (how fast delta changes), theta (time decay), and especially vega (sensitivity to implied volatility). That vega exposure is why delta-neutral strategies and earnings go hand in hand. Why go delta-neutral at all — and the one thing that splits these strategies Removing direction sounds like removing opportunity, so it's worth being clear on what you gain. Direction is the hardest thing to forecast — especially around a binary event like earnings, where the stock can gap either way on the same news. A delta-neutral position sidesteps that guess entirely and lets you bet on something more studiable: how far the stock moves, and what happens to implied volatility. You're no longer asking "up or down?" You're asking "big or small?" and "is volatility rich or cheap?" But "delta-neutral" does not mean "indifferent to volatility." This is the single most important idea in the whole article: every neutral structure starts with zero delta, yet they split cleanly into two camps by how they react to two things once the event hits — how far the stock moves (gamma) and which way implied volatility travels (vega). One camp wants a big move and rising IV; the other wants stillness and the IV crush. Getting this backwards is how traders put on exactly the wrong structure for their view. Long-gamma (long-volatility) structures — the straddle, strangle, and double diagonal — want a big move, and they want rising implied volatility. Two forces help them, not one. First, movement: as the stock runs, their delta grows in the direction of the move, so they make money faster the further it goes (that's the long gamma). Second, IV: because these positions are net long options, they're long vega — so if implied volatility on those long legs rises, the options gain value even before the stock moves. A violent earnings reaction into rising IV is their best friend. Their enemy is the opposite pair: a stock that sits still while IV falls, letting the crush and time decay bleed the premium they paid. Short-gamma (short-volatility) structures — the calendar and iron fly — want stillness, and they want falling implied volatility. Again, two forces working together. Because these positions are net short the near-term options, they're short vega on that leg — so when implied volatility collapses in the post-earnings crush, those sold options lose value and the position profits. And because they're short gamma, they also want the stock to stay near where it started so time decay works in their favor. A big move is their enemy: push far enough from the center and the calendar's short leg or the iron fly's short strikes turn against you, and the move can overwhelm the crush and the decay you were counting on. Table 1. The same delta-neutral starting point splits into two opposite bets. Each camp is driven by two forces working together — the direction of the stock's move and the direction implied volatility travels. Long-vol structures want a big move and rising IV; short-vol structures want stillness and the IV crush. So the real question a delta-neutral earnings trader asks is: do I expect this particular stock to move more, or less, than the options are pricing in — and does its history favor the move or the crush? That's not something to guess stock by stock. It's something to measure — which is where EarningsStudy's backtesting and screening come in. Why earnings is a volatility event, not a direction event Before a company reports, implied volatility (IV) swells as traders bid up options in anticipation of a big move. After the report, the uncertainty resolves and IV collapses — the IV crush. This is the central dynamic of earnings trading, and it's why neutralizing direction makes sense: the thing you can actually study and anticipate isn't which way the stock goes, but how its volatility behaves around the event. That's exactly what EarningsStudy is built to measure. Rather than guessing, you can look at how a specific stock's option structures have actually behaved across many past earnings cycles. Let's walk through the neutral strategies one at a time, each on a real setup. The Calendar Spread — Selling Near-Term Volatility A calendar spread sells a near-term option and buys a longer-dated option at the same strike. Around earnings, it leans on the front-month IV being pumped up more than the back month — the near leg you sold crushes harder than the far leg you own. Built at the money, it starts roughly delta-neutral, and — as Table 1 showed — it wants the stock to sit still. Here's a put calendar on Micron (MU) heading into its confirmed 2026-09-30 report, seven days out (T-7). The key panel is the Relative Volatility (RV) reading: the current RV of 1.40% sits against a median of 1.18%, a quick read on whether this calendar is pricier or cheaper than it usually is at this point in the cycle. The same view for Costco (COST), three days out, tells a different story — its RV of 0.78% sits right on its median, so this calendar is priced about where it typically is. The Beta Calendar Matrix — Every Entry/Exit Pair at a Glance This is where the newly released Beta Calendar Matrix earns its place. Instead of a single RV number, it shows the historical median return of the calendar for every combination of entry day and exit day around earnings, color-coded so the profitable regions are obvious. Read it like a heatmap: each cell answers "if I had entered on this day and exited on that day, what did this calendar historically return?" The right-side panel translates today's actual entry into concrete exit options. The Classic / Beta toggle switches between the original view and this new matrix. A crucial caveat, and it applies to every matrix and RV reading in this article: these are historical medians, not predictions. A green cell means the structure tended to work at that timing in the past; it is not a guarantee about the upcoming report. Backtests and calculations may be inaccurate and must be independently verified. The Straddle — the Pure Long-Volatility Bet A long straddle buys a call and a put at the same at-the-money strike. The positive call delta and negative put delta roughly cancel, so you're delta-neutral at entry — you don't care about direction, only that the stock moves enough in either direction to overcome the combined premium. It's long-gamma and long-vega: a big move is exactly what it wants, but it's fighting the post-earnings IV crush. Here's the MU straddle at T-7. Its RV of 10.26% sits below its median of 12.16% — a hint the straddle is relatively cheap versus its own history, which is what a straddle buyer wants. The Strangle — the Same Bet, Wider and Cheaper A strangle is the straddle's cheaper cousin: buy an out-of-the-money call and an out-of-the-money put. Lower cost, but the stock has to move further to pay off. EarningsStudy lets you step the wings out (Base / Wing 1 / Wing 2) to see how the tradeoff shifts. The Iron Fly — the Defined-Risk Short-Volatility Play Now we flip to the short-volatility side. An iron fly sells an at-the-money straddle and buys protective wings above and below, collecting a net credit. It's delta-neutral at entry, short-vega (so it benefits from the IV crush), and — critically — defined-risk, because the long wings cap the loss if the stock gaps. Like the calendar, it wants the stock to stay put. Here's the iron fly on JPMorgan (JPM), heading into its confirmed 2026-10-13 report. Note this is a net credit ($13.78) rather than a debit — you're paid to take the position, and you profit if the IV crush deflates the options faster than the stock moves against you. The Iron Fly Matrix shows every entry/exit timing pair, color-coded by historical median return. The Double Diagonal — Combining Calendar and Directional Structure A double diagonal combines diagonal call and put spreads, selling near-term options and buying longer-dated ones at different strikes. It's a neutral, income-oriented structure that benefits from front-month IV crush while the longer-dated longs retain value — and, unlike the calendar, it leans long-volatility, so a move toward its wings helps rather than hurts. Four legs across two expirations means execution and commissions matter more, which is exactly why seeing the historical payoff before committing is valuable. Finding the Right Symbol for the Right Strategy Here's the payoff of everything above. Once you understand that each stock has its own volatility personality — some make violent earnings moves, others barely twitch and simply crush — the natural question is: which stocks have historically rewarded which strategy? A name that routinely gaps hard on earnings is a candidate for the long-vol structures (straddle, strangle, double diagonal); a name that reliably sits still while its inflated premium collapses is a candidate for the short-vol structures (calendar, iron fly). Guessing that stock by stock is hopeless. Measuring it is exactly what EarningsStudy's backtesting and screening are for. Two capabilities do the work: Per-strategy backtesting. For any symbol, each strategy page reconstructs how that structure actually performed across the stock's past earnings cycles — the RV reading against its own median, and the Beta return matrix that scores every entry/exit timing pair. A symbol whose calendar matrix is a field of green has a history of the stillness-and-crush that calendars and iron flies want; a symbol whose straddle repeatedly paid has a history of the big moves that straddles and strangles want. You're reading the stock's tendency, not forecasting a single report. Screening across symbols. Rather than checking tickers one at a time, the screener surfaces the names entering their earnings window and flags where a given structure has historically lined up — filtered by the same VIX and confirmation conditions you'd trade under. That turns "which of tonight's reports suits an iron fly?" from a manual hunt into a sorted list. The workflow that ties the whole article together looks like this: Start from the concept: decide whether you're hunting a big-move (long-vol) or a stay-still (short-vol) setup — Table 1 is the map. Screen for candidates entering their earnings window that fit that profile. Backtest each candidate on the specific structure — read the RV vs. its median and the Beta matrix to confirm the stock's history actually favors it. Check the volatility environment: rich IV for this stock favors selling it (calendar, iron fly); cheap IV favors buying it (straddle, strangle). Size and manage with the reminder that all of it is historical tendency, never a guarantee about the next report. Put simply: the concept tells you what kind of setup you're looking for, and the backtesting and screener tell you which symbols have historically delivered it — so you're pairing each stock with the strategy its own earnings history supports, instead of forcing one strategy onto every name. The One Caveat That Governs All of It Delta-neutral is a snapshot, not a permanent state. Each structure is neutral only at the instant you put it on, at one stock price. The moment the stock moves, gamma pushes your delta away from zero and the position takes on direction — helping the long-vol structures and hurting the short-vol ones, exactly as Table 1 lays out. These are positions to understand and monitor, not set and forget. And every number in the tool is a measured history, not a forecast; the market can and does behave differently on any given report. The Bottom Line Delta-neutral strategies free you from the hardest problem in trading — predicting direction — and let you trade something more studiable: how a stock's volatility behaves around its earnings. Long-volatility structures (straddles, strangles, double diagonals) want a big move and cheap IV; short-volatility structures (iron flies, calendars) want stillness and the IV crush. The skill is matching the structure to the stock — and that's a question you answer by studying real history with backtesting and screening, not by guessing. This article is for educational purposes only and is not investment advice. EarningsStudy provides research tools and market information, not personalized recommendations; backtests and calculations may be inaccurate and must be independently verified. Options trading involves substantial risk, and multi-leg and short-volatility strategies in particular can produce large losses. Understand the maximum risk of any position before entering it. Example figures reflect a data snapshot and will not match live prices. A quick note on scope: this article uses US-listed options and standard US options terminology. The concepts apply anywhere options trade, but the examples and any tax references assume a US context.
 -
thanks for this @krisbee
-
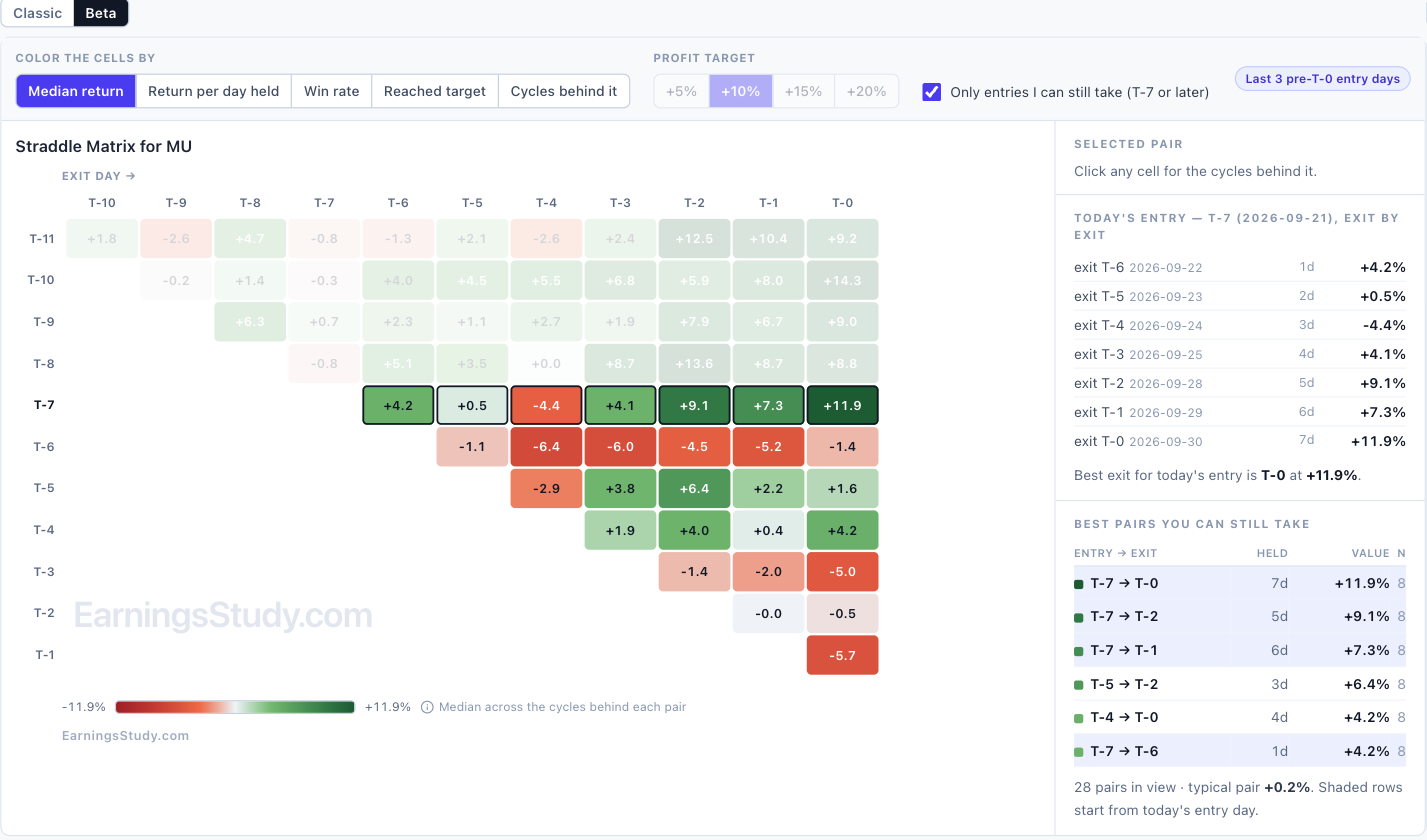
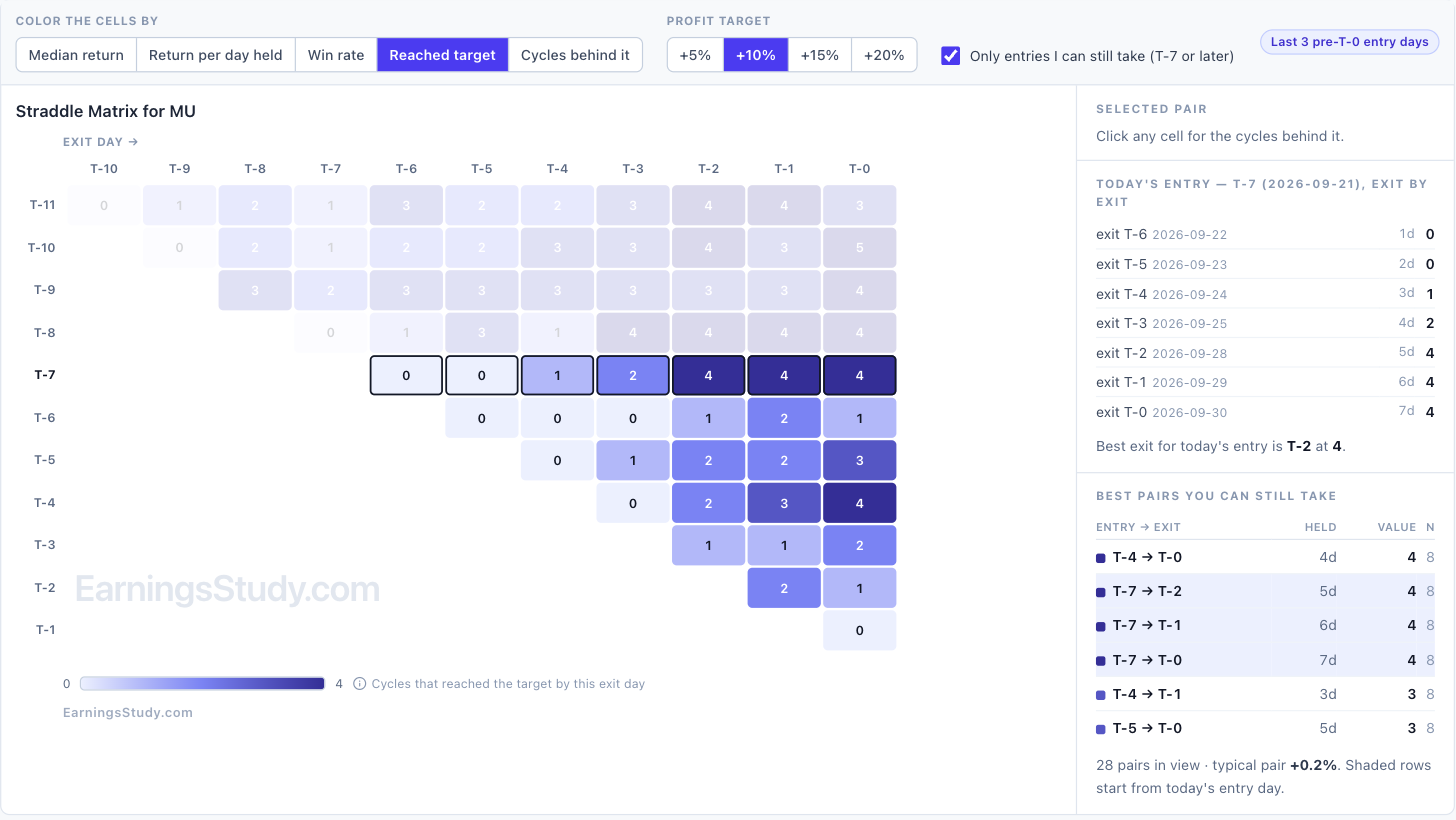
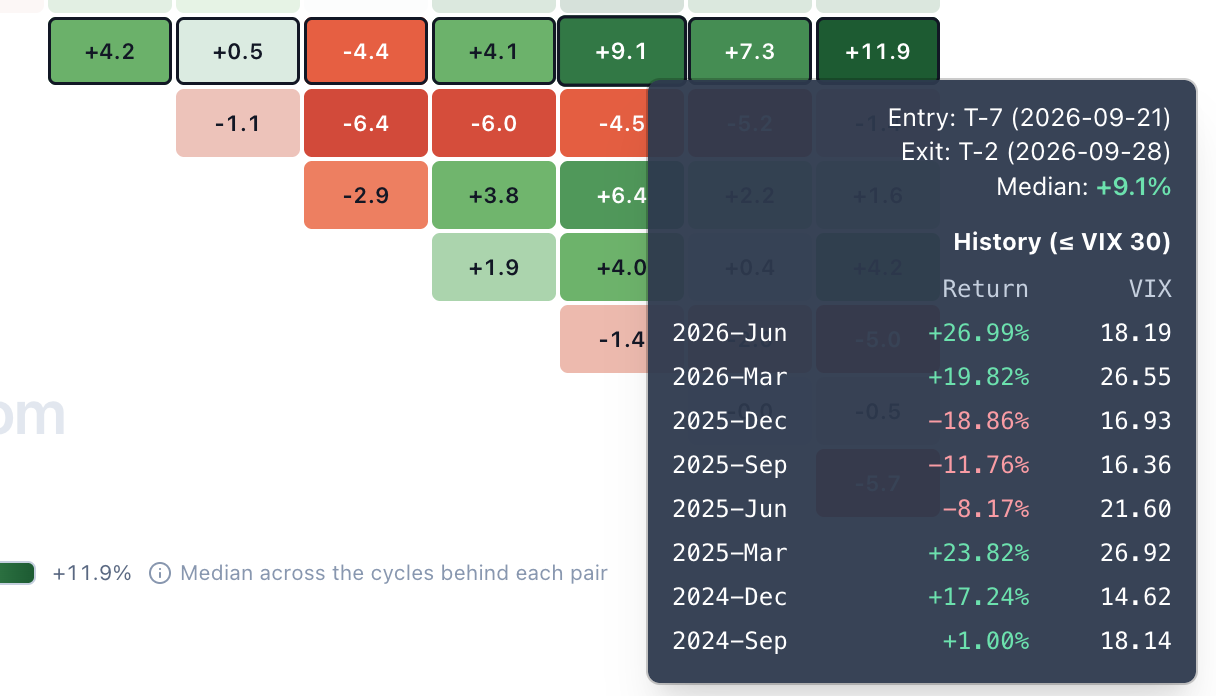
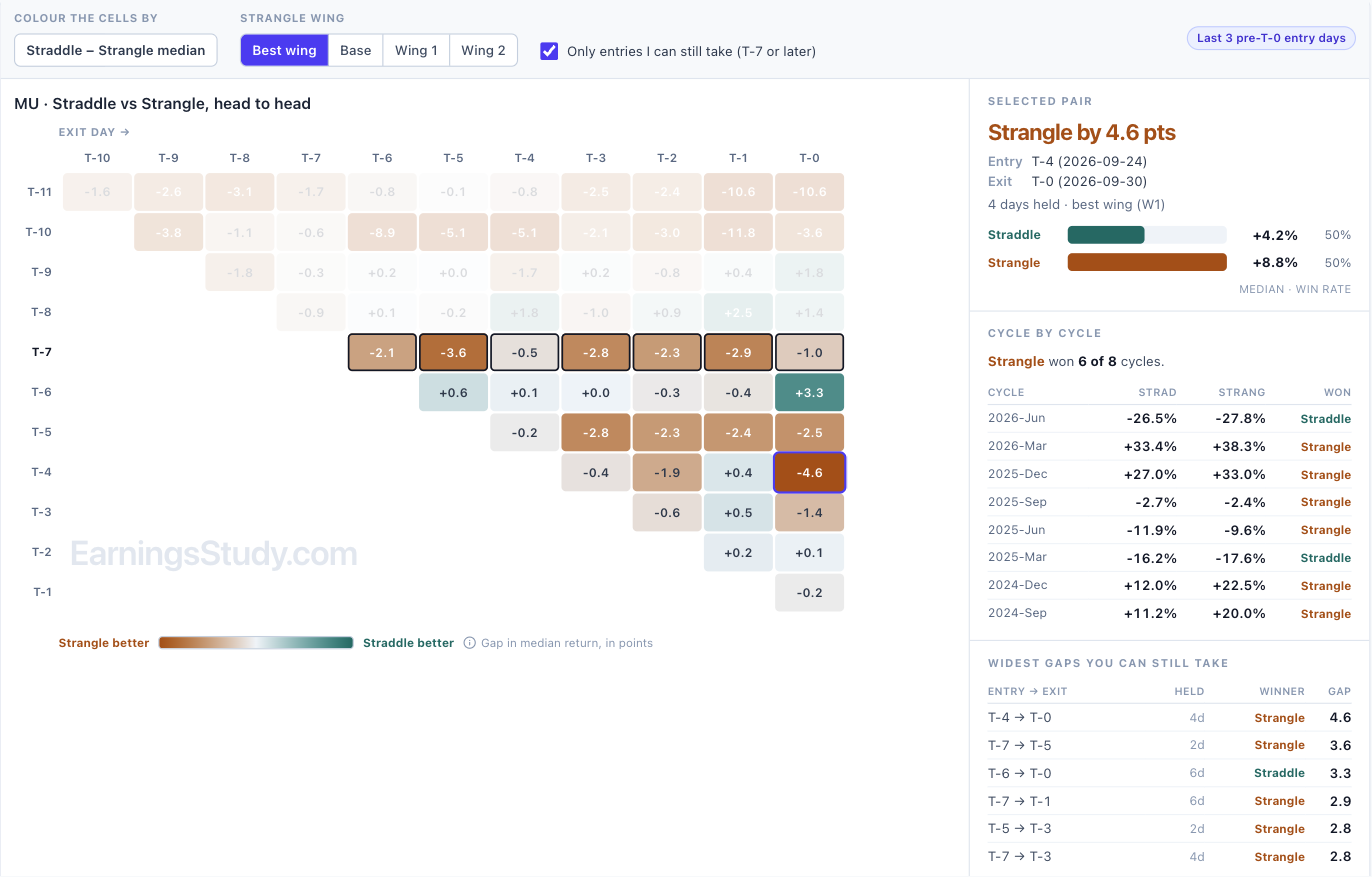
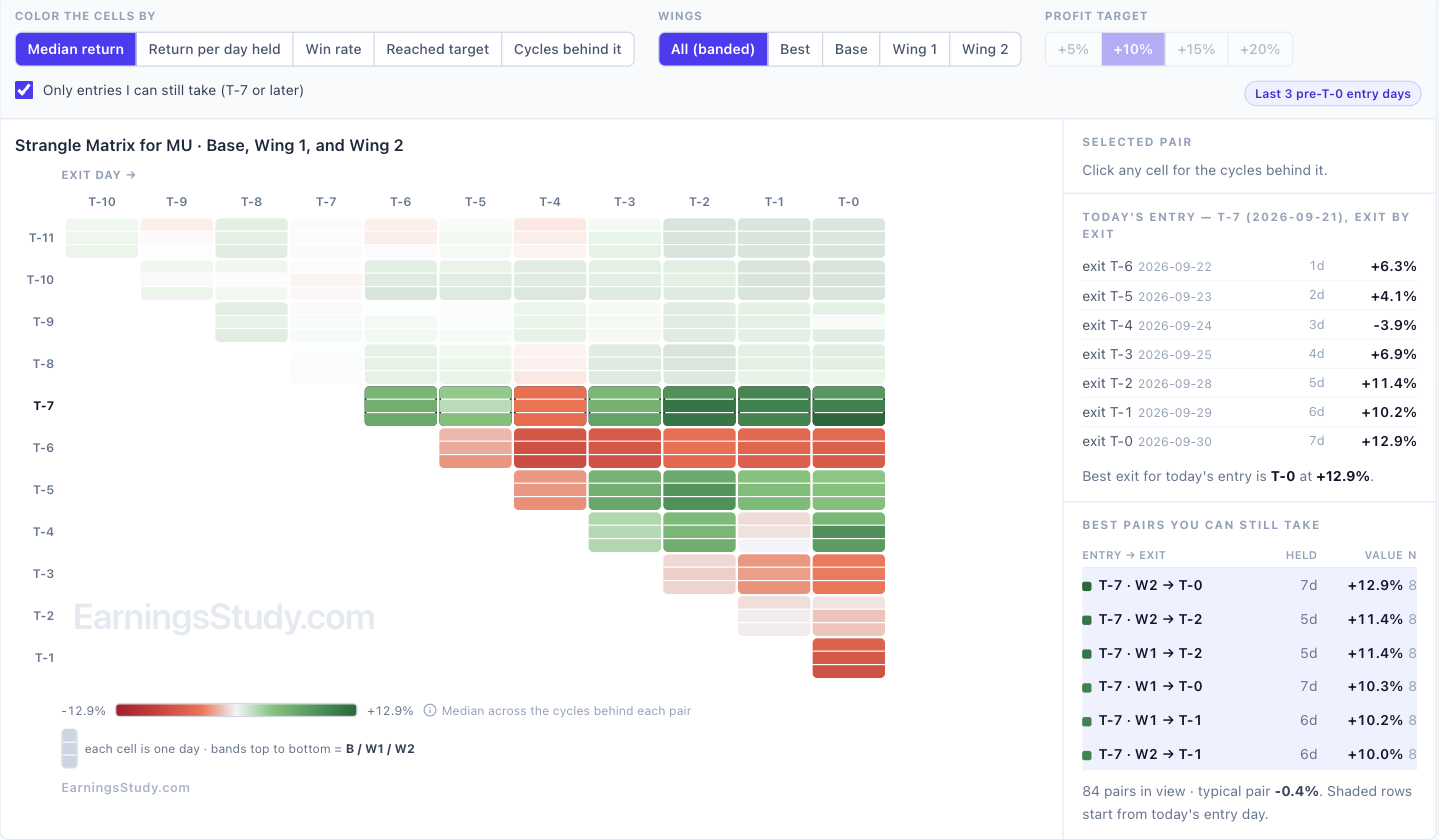
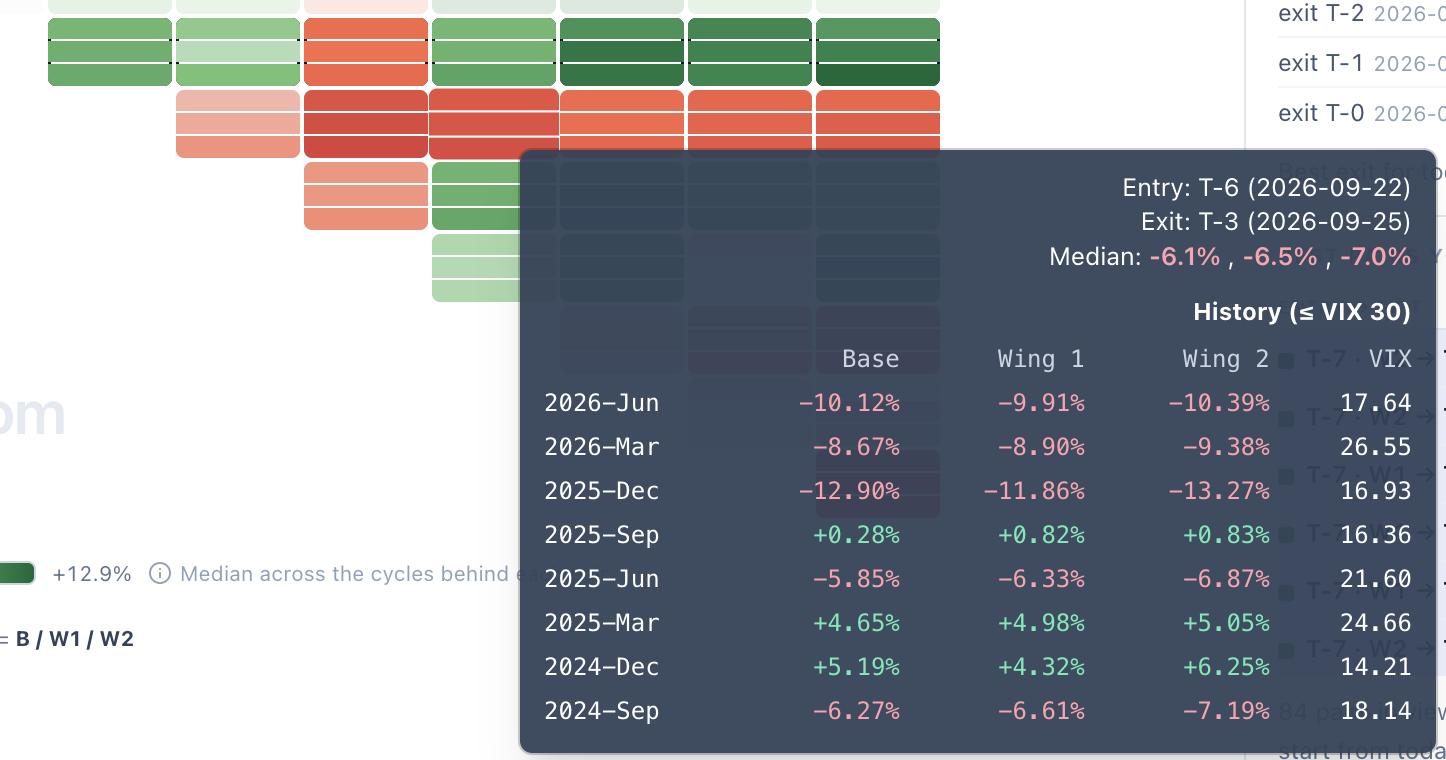
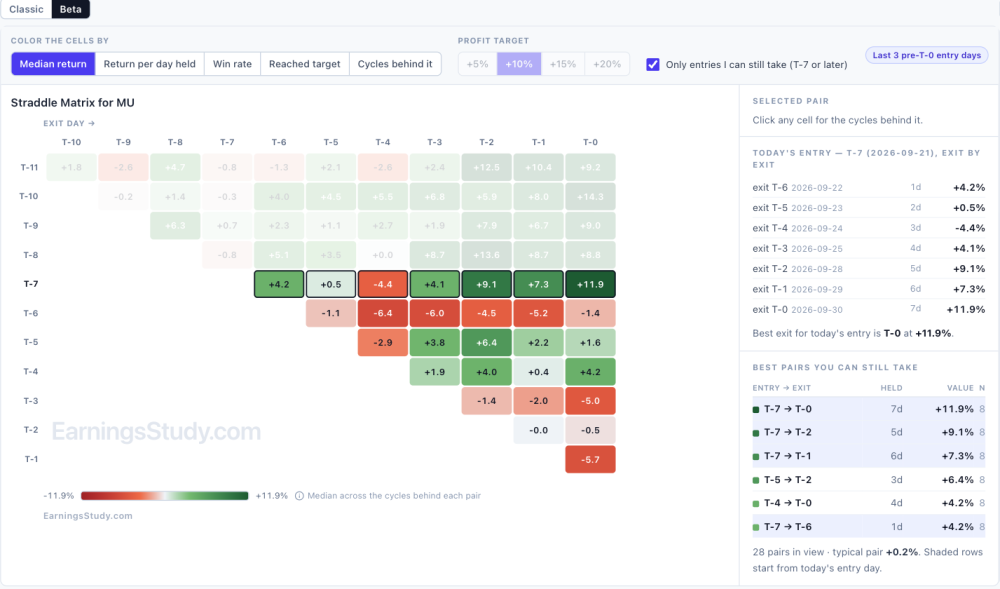
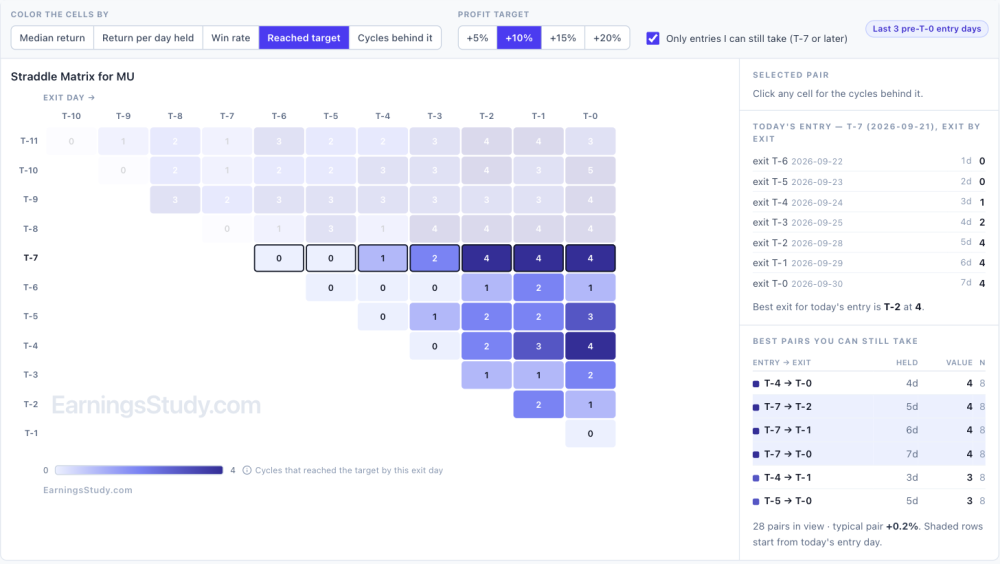
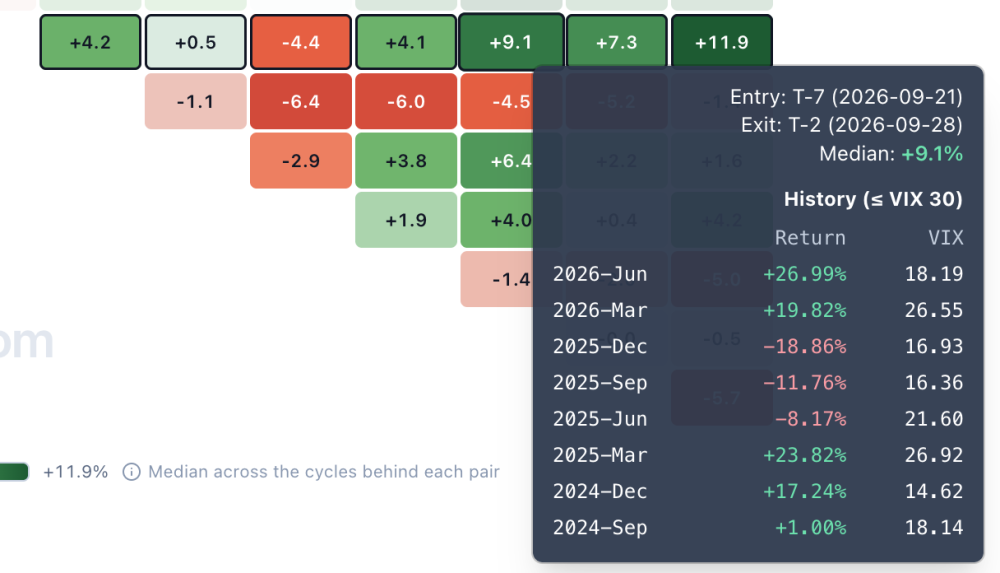
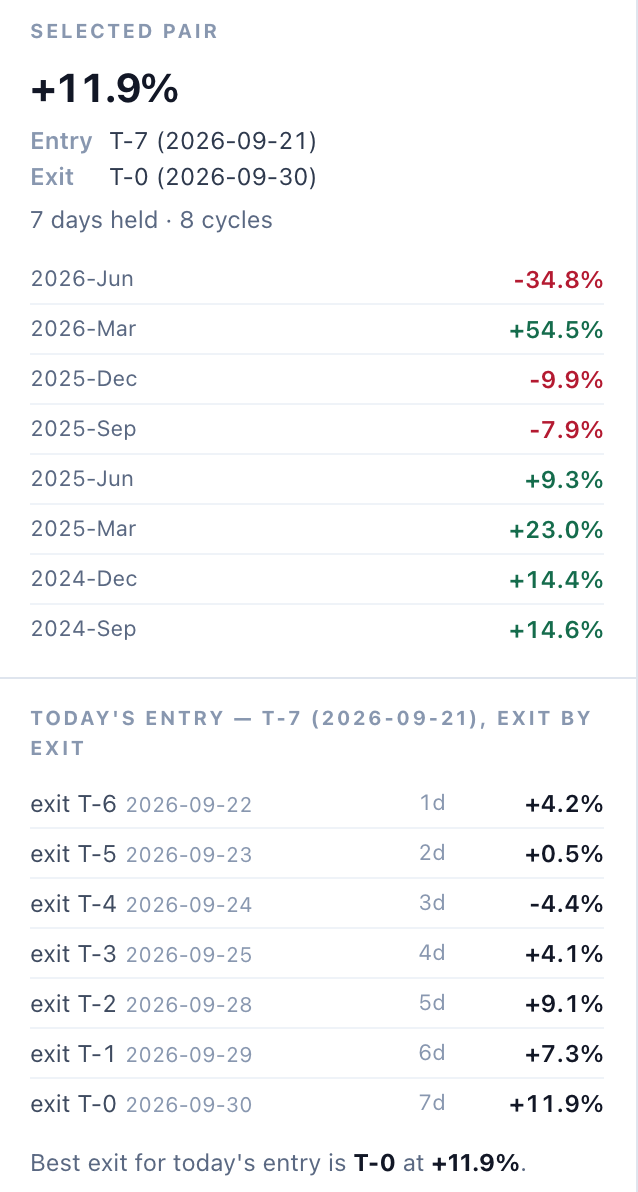
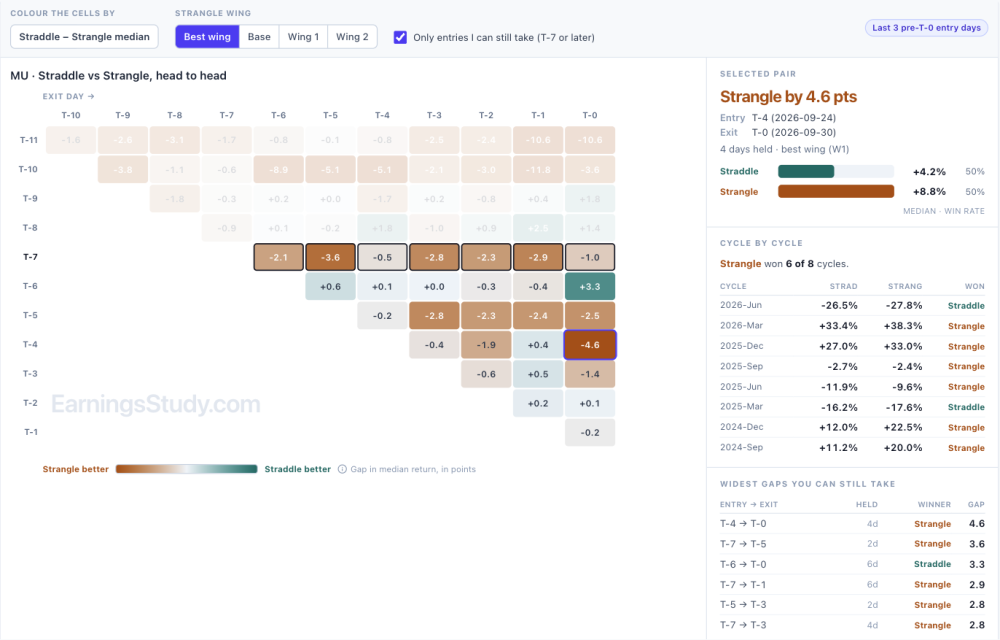
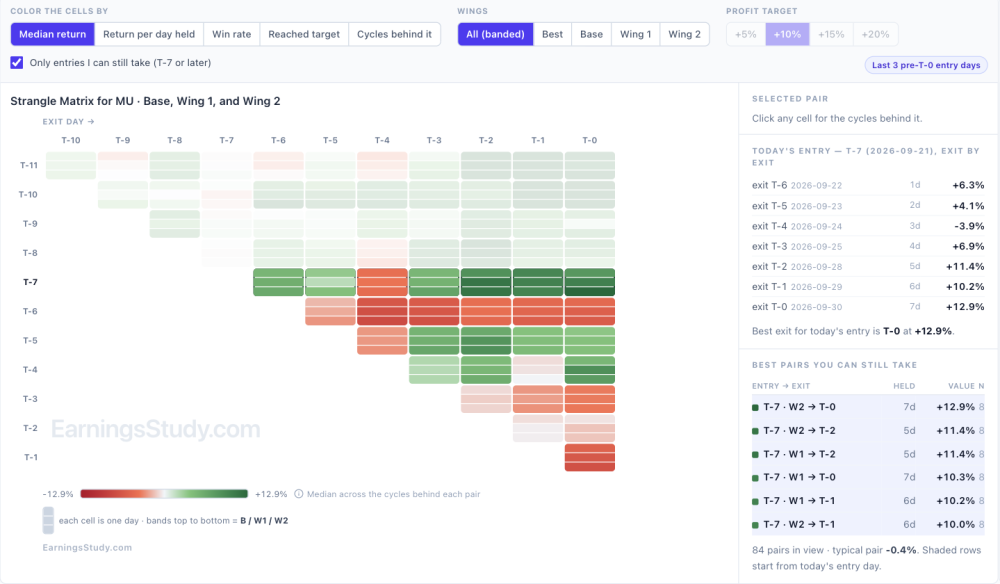
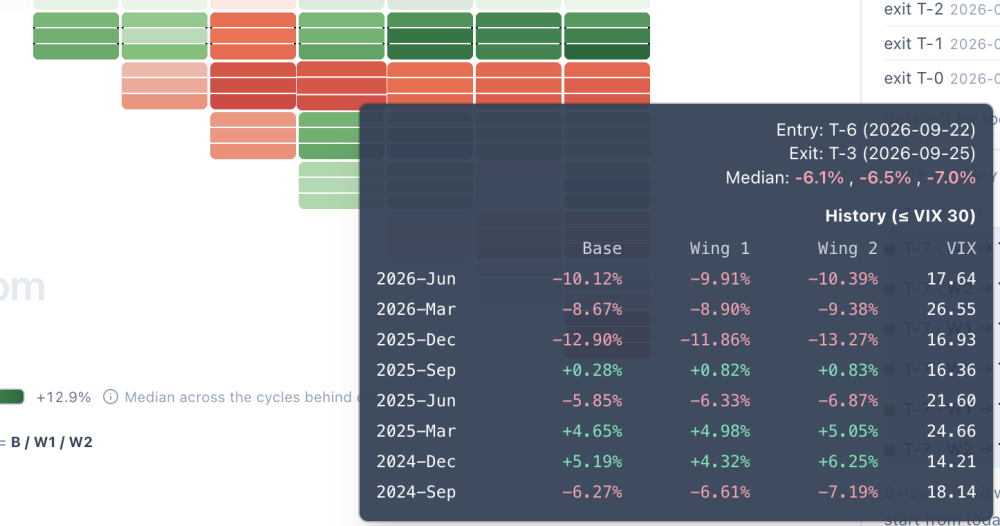
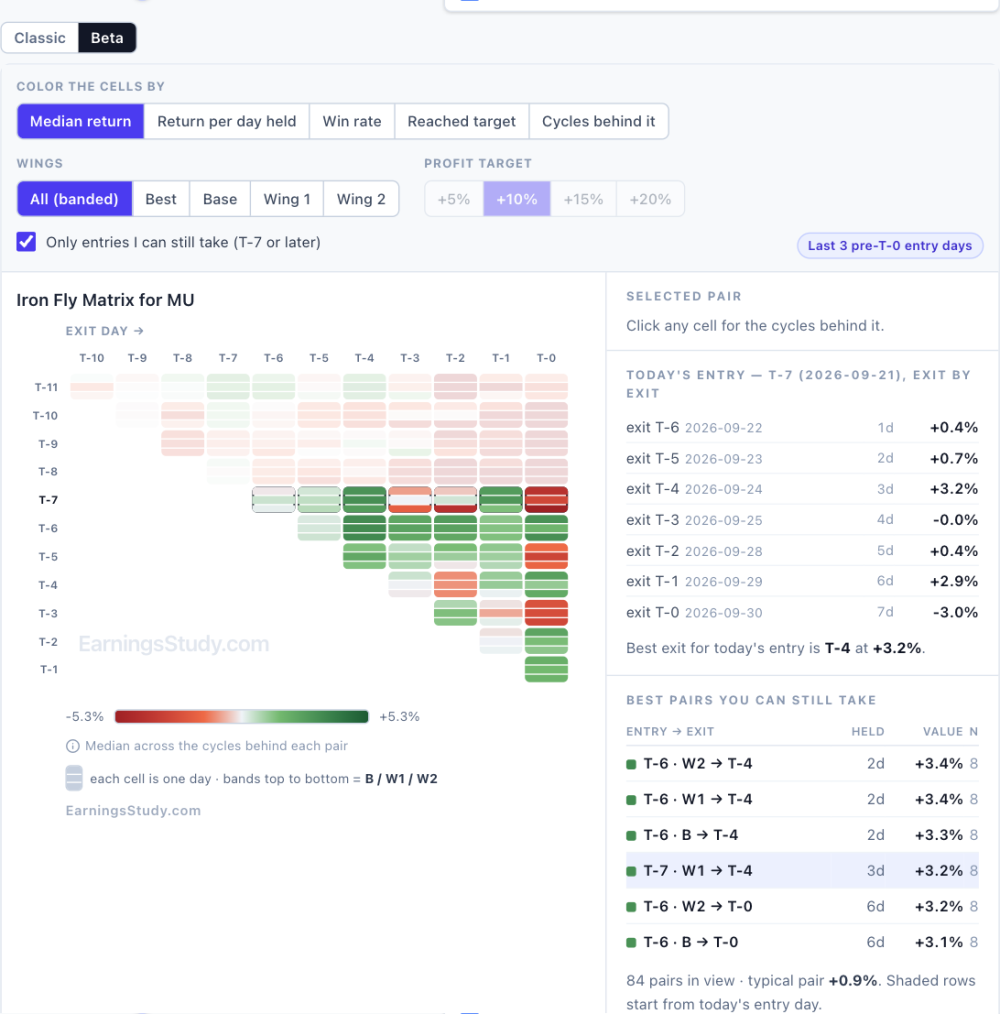
One grid, five questions — the new return matrix (Beta) The return matrix has always answered one question: what does the median cycle pay for every entry/exit pair? That is a good question. It is not the only one worth asking, and the same grid can answer the others without changing shape. The Beta matrix lets you change what the color means. Same entry × exit triangle, same history behind it, five different questions. It is live on every pre-earnings strategy page: Calendar, Straddle, Strangle, Iron Fly, Double Diagonal, Long Options, Call Debit Spread, etc., Screenshot 1 — MU straddle, colored by median return. Today’s entry, T-7, is the boxed row. The five questions Color the cells by The question it answers Median return What does a typical cycle pay? This is the Classic view. Return per day held Which pairs pay fastest? Median return divided by days held, so a two-day hold and a seven-day hold are compared on equal terms. Win rate How often did the pair finish positive at all? Reached target How many cycles reached +5%, +10%, +15% or +20% by that exit day? Cycles behind it How much history is each number actually built on? Reached target is the one I would look at first. Screenshot 2 — Same grid, now counting cycles that reached +10% by each exit day. On MU, a T-7 straddle reached +10% in 4 of 8 cycles by T-2 — and holding on to T-0 added no new ones. Those last two days bought more exposure, not more hits. The median view cannot tell you that; this one says it in a glance. The rows you can actually trade Half the triangle is entry days that have already passed. Only entries I can still take is on by default and fades them, so the ranking on the right lists only trades you can still put on today. It also makes the grid easier to read honestly. Look at the T-6 row in screenshot 1: one day later than today’s T-7 entry, the same straddle is red across the board. Every number opens up A median over eight cycles hides a lot. Hover any cell and you get every cycle behind it with the VIX that ruled it — gains in green, losses in red. Click it and the side panel pins the cycle list, with the actual calendar dates of your entry and exit. Screenshot 3 — Hover a cell: every cycle, its return and its VIX. Screenshot 4 — Click a cell: the side panel pins it, with real entry and exit dates. That is the honest read on MU’s best pair. T-7 → T-0 has a +11.9% median, but the individual cycles ran from −34.8% to +54.5%, and five of the eight were winners. A real edge with wide dispersion — size accordingly. Straddle vs Strangle, head to head Two matrices side by side ask you to subtract two colour scales in your head — and they were never on the same scale. In Beta, Compare with Strangle draws one grid instead: each cell is Straddle minus Strangle, teal where the straddle wins and amber where the strangle does. Click a cell for the cycle-by-cycle scorecard. Screenshot 5 — MU, T-4 → T-0: the strangle leads by 4.6 points (+8.8% against +4.2%) and won 6 of 8 cycles. The scorecard is the part two separate grids can never show. A small median edge that came from one lucky cycle looks identical to one that held up in six of eight — until you count them. It works the other way round from the Strangle page, and the wing selector lets you compare against a specific wing or the best one. Three wings, one row Strangle, Iron Fly and Double Diagonal each have three wings, which used to mean three rows per entry day and a matrix three times taller than the rest. Beta folds them into one row: each cell is split into three bands — Base, Wing 1 and Wing 2 from top to bottom. A third of the height, all three wings visible at once. Pick a single wing, or Best, and the numbers come back into the cells. Screenshot 6 — MU strangle: one row per entry day, one band per wing. Hover a banded cell and the three wings line up cycle by cycle: Screenshot 7 — MU strangle, T-6 → T-3: every wing lost in the same five cycles. When all three wings agree like that, the wing is not the problem — the timing is. Screenshot 8 — The same banded view on Iron Fly. Double Diagonal work the same way. How to turn it on Open any pre-earnings strategy page and load a symbol. Above the History Matrix, click Beta. Classic is one click away, and your choice is remembered. The VIX filter, earnings cycles and “3 days before current day” settings all carry over. It is labelled Beta because I want your feedback before it replaces anything. Tell me which view you end up using — and which question you wish the grid could answer that it cannot yet.
-
I'd be careful with high balance requirements and auto-liquidation risks. Scaling can be tempting, but safety first
-
Please take a look: https://steadyoptions.com/forums/forum/topic/51-email-notifications/?page=4#findComment-216778 It's always worth to enable notifications and/or follow the contributors. Also it is better to post in the members forum and not the public forum.
- 1 reply
-
- 1
-

-
I have not received the email for yesterday MU trade and COST trade of today. I have already checked my spam folders also. I received the emails for earlier trades. Please let me know if there are any changes in the notifications.
-
Two things from my side this weekend. A guide. I've written the document I wish every options tool came with: Reading OptionBench — 26 pages, one screen at a time, on what each number means, how it was computed, and where it stops being reliable. The two return conventions (observed exit vs target), why thin samples are greyed, how to read the entry × exit matrix, why a credit spread shows an expectation near zero at implied vol. Free, no account needed: https://optionbench.com/guide An article. When implied volatility hits its floor, does it come back up? — 6,600 episodes, 122 tickers, earnings controlled. The folklore is right: from a floor, IV rises within ten sessions 74% of the time against 57% from anywhere else, and the lower the start, the stronger the bounce. It also says why that isn't a strategy yet: https://optionbench.com/blog/implied-volatility-floor-mean-reversion The follow-up comes next: I tested the structures that are supposed to capture that rise — single leg, straddle, calendar, diagonal — one configuration each, declared before looking at the data, priced at the ask in and the bid out. The result isn't what the folklore says. It'll be published whichever way it reads. Questions and objections welcome, as always.
-
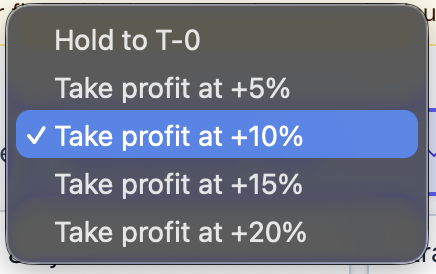
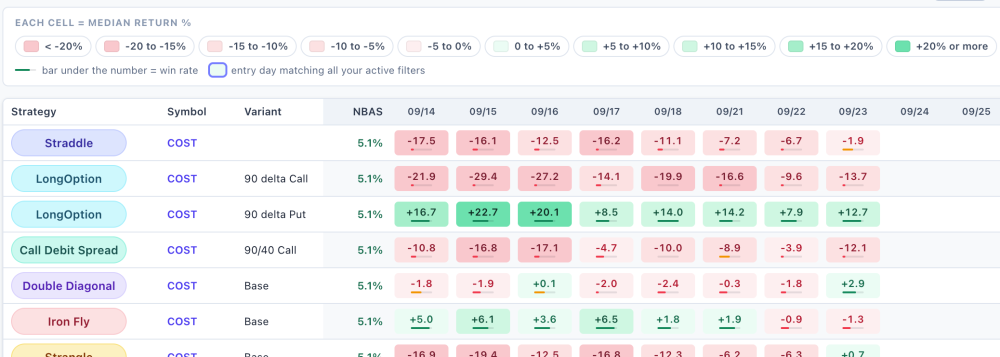
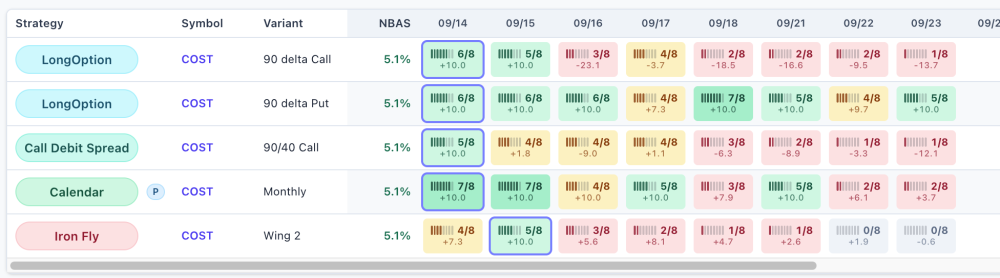
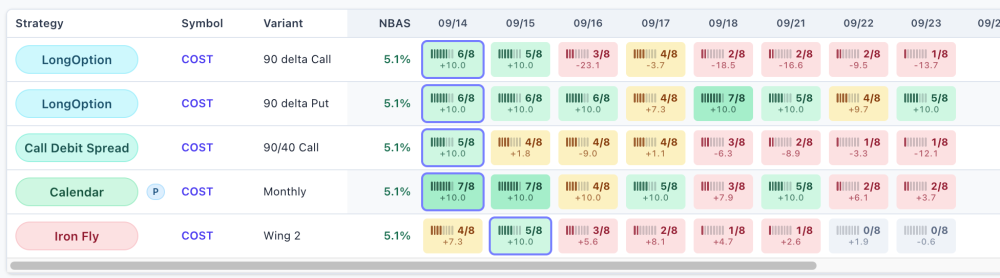
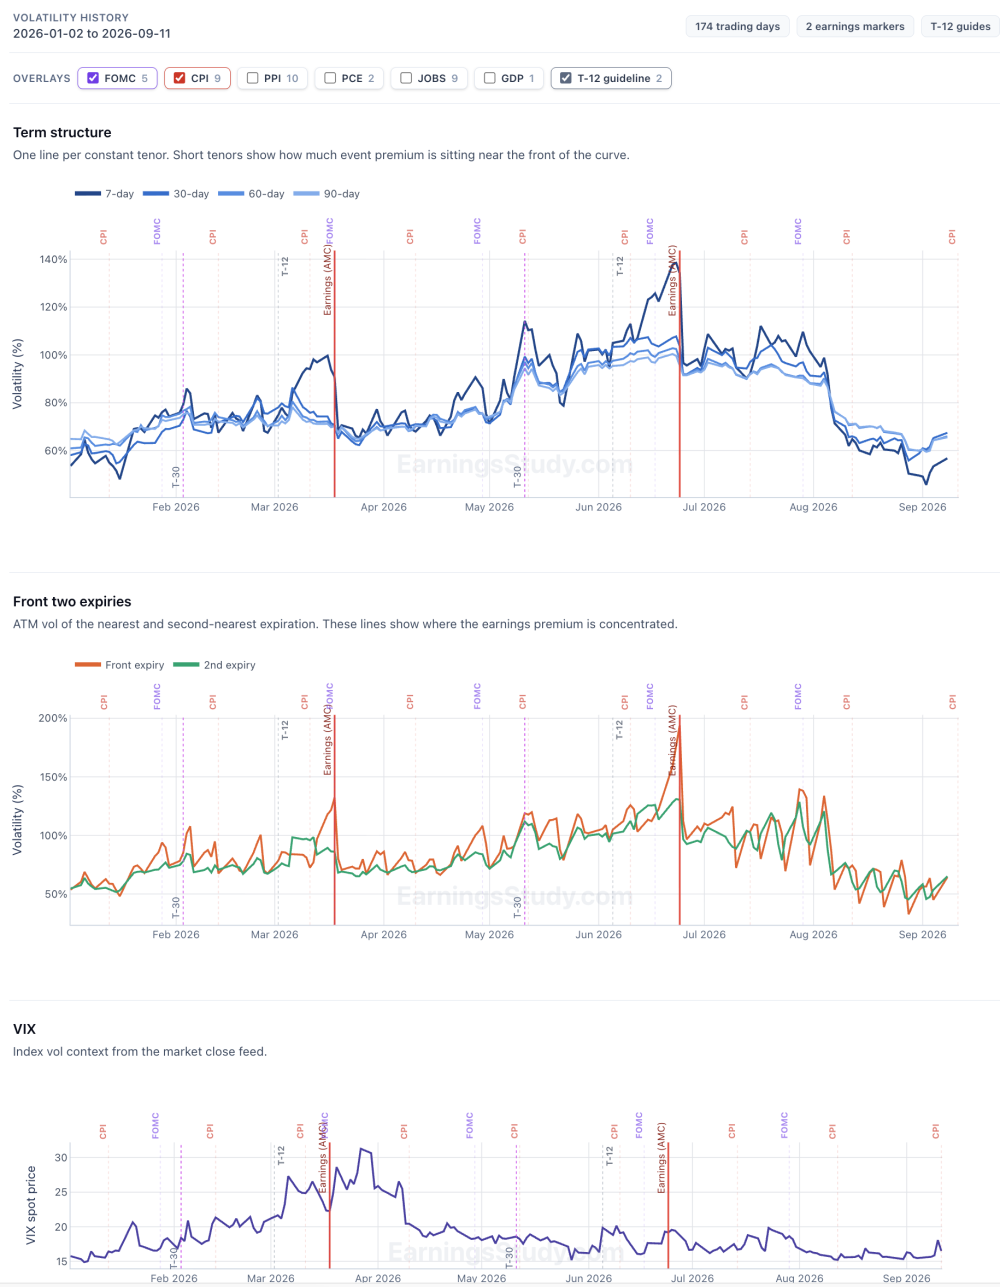
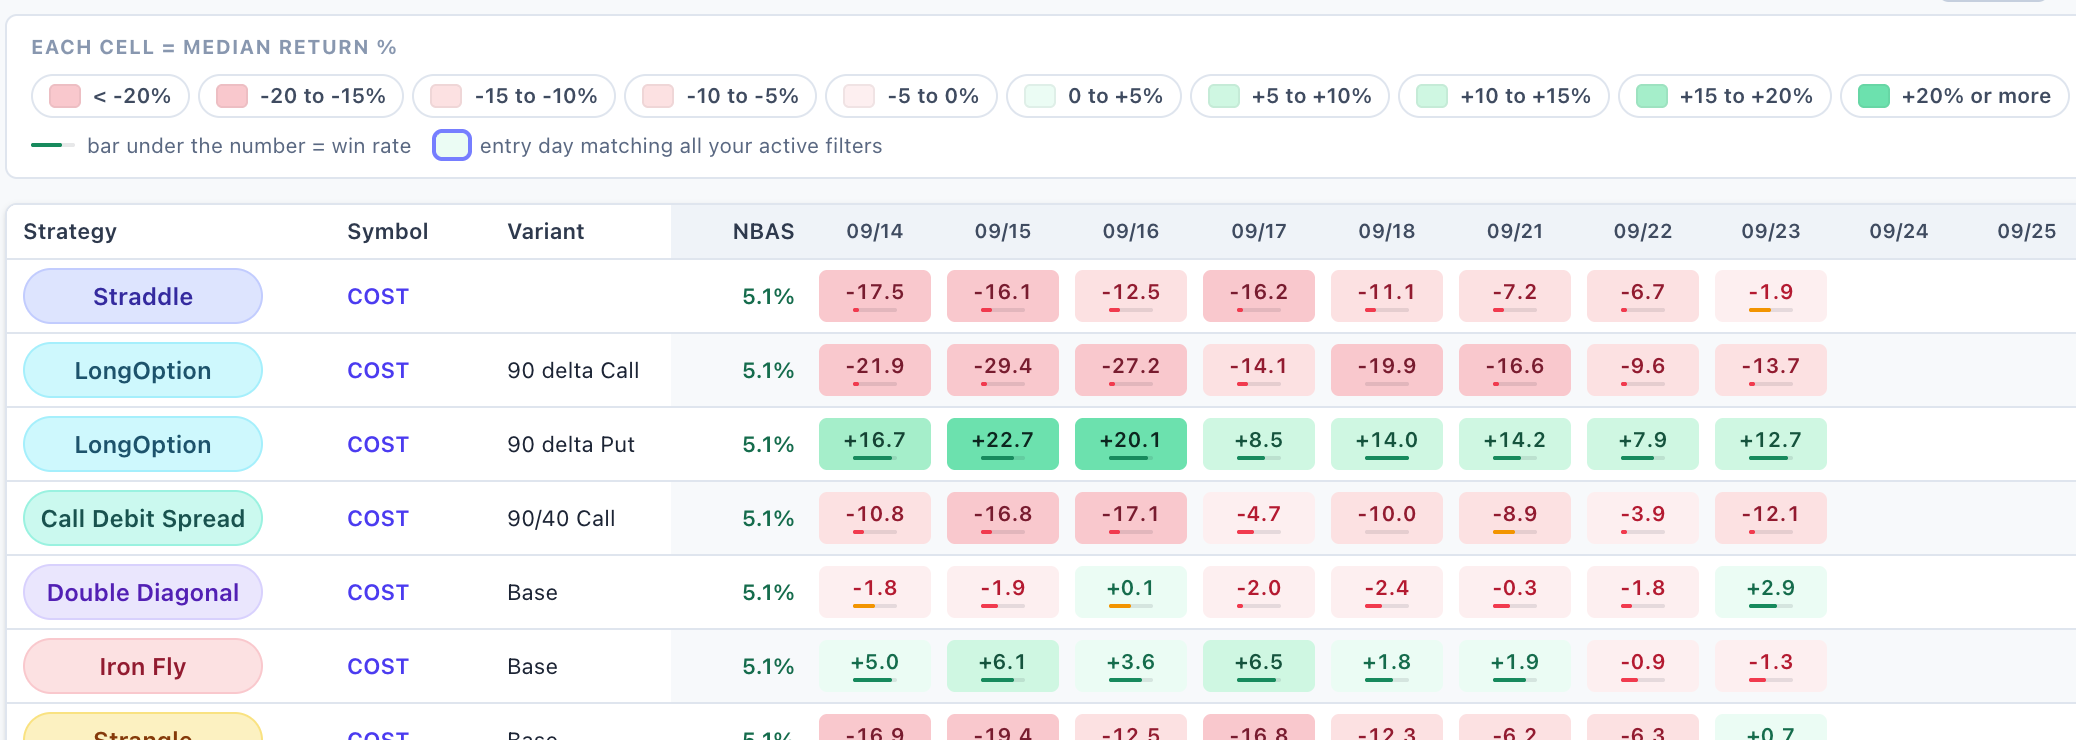
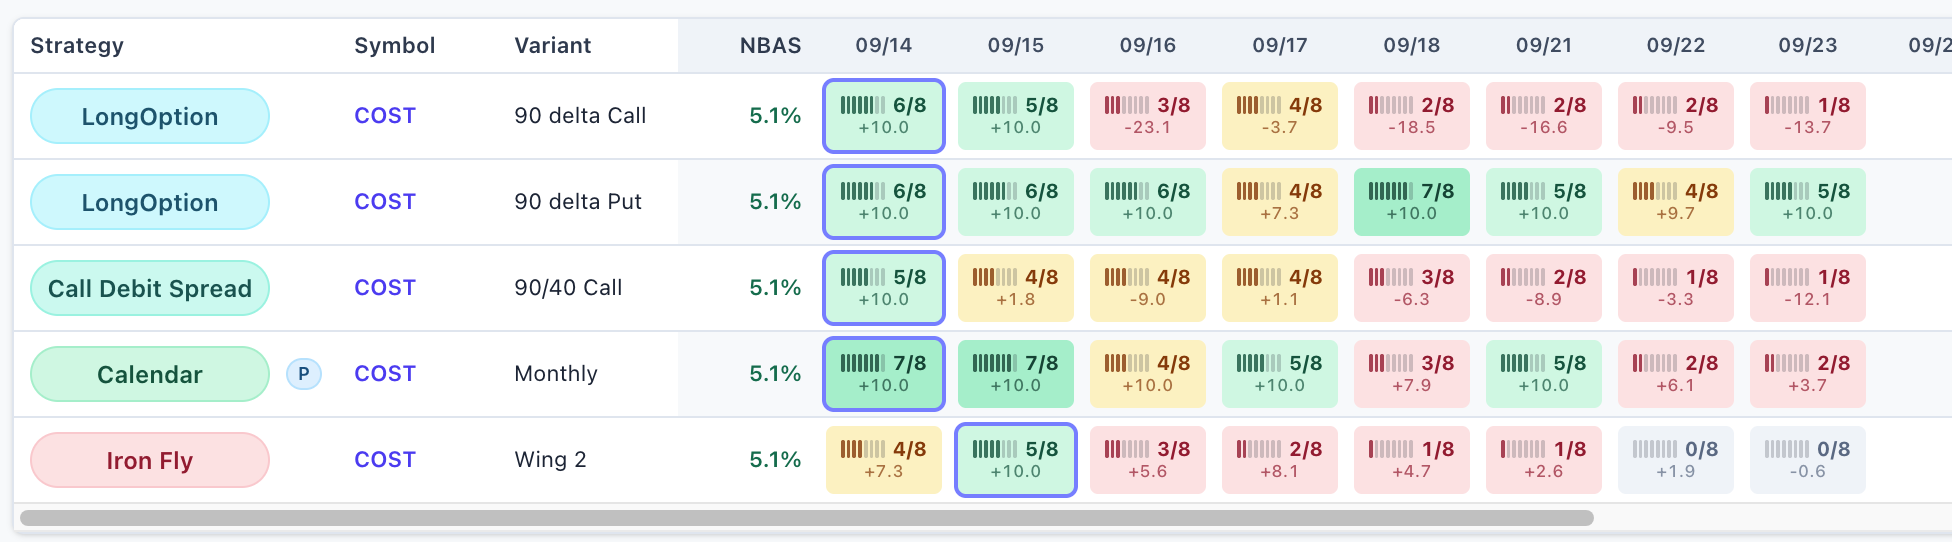
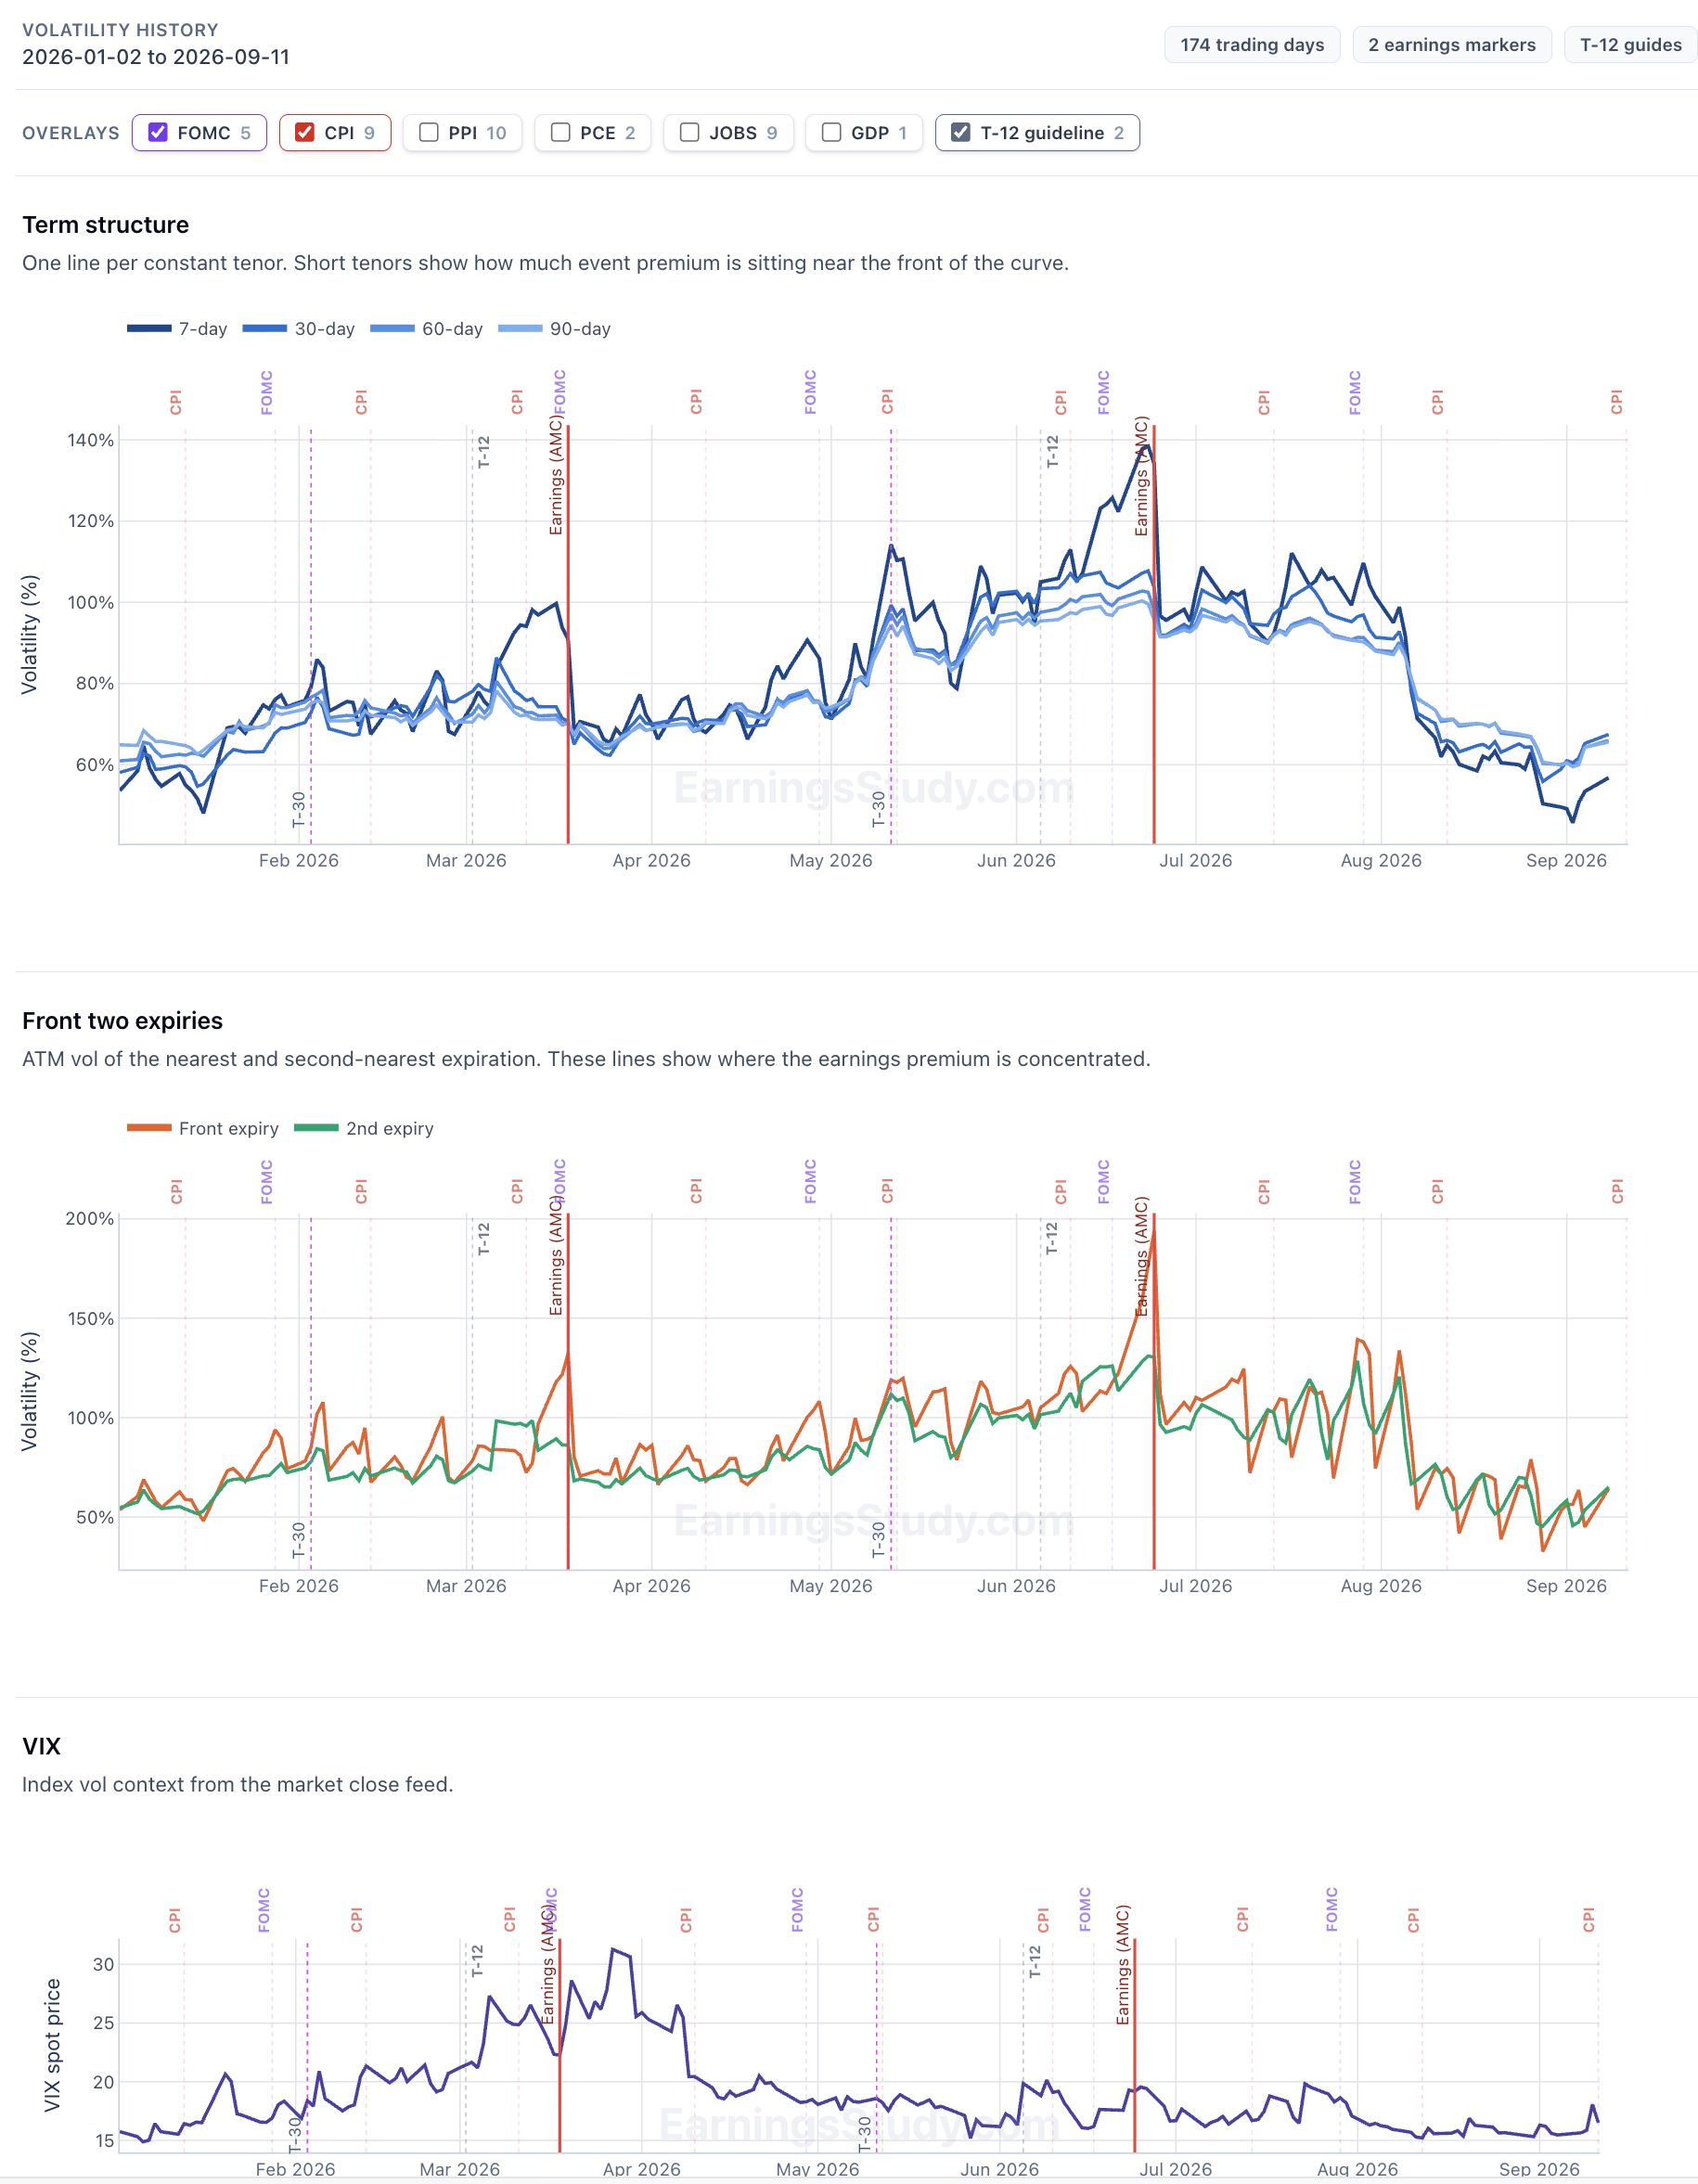
What's new: exit rules on the Daily Screener, and a look at the volatility term structure Two features shipped this week. They came out of the same complaint, which was mostly my own: the screener was very good at telling me when to get in and said almost nothing about when to get out, or about what volatility was doing while I waited. 1. The Daily Screener now understands exit rules Until now the screener answered exactly one question: if I enter on this date and hold to T-0, what did that return across the last N earnings cycles? That's a real question. It's also a strangely rigid one. It assumes you sit through the entire pre-earnings window no matter what the position does — that a trade up 30% at T-7 and a trade up half a percent at T-7 are the same trade, because you're holding both to the same day. Anyone who actually runs these knows that isn't how it goes. You take the money when it's there. So there's now an Exit rule control, and it's the first thing in the filter row. Hold to T-0 is the screener you already know. Take profit at +10% re-scores the whole board against a different plan: leave the moment the position is up 10%, and only hold to T-0 in the cycles where it never gets there. Every number on the page then answers the new question instead of the old one. That's the whole feature. What a cell tells you now With a target selected, each cell leads with how many past cycles reached it — one small block per cycle, filled where it hit — and the median return of that rule underneath. The block strip matters more than it looks, because it carries the sample size as well as the hit count, and the number of qualifying cycles isn't the same for every symbol. A newer listing might only have two or three on file. 2 of 2 and 8 of 8 are both perfect scores; only one of them is evidence, and now you can tell which without opening anything. Grey cells are their own answer: no cycle ever reached the target, so every cycle fell back to holding and the figure shown is just the hold-to-T-0 return. Not a target result at all. The example that convinced me This is COST, real board, last N cycles. Held to T-0, the 90-delta long call is a bloodbath across the first three entry days: −21.9%, −29.4%, −27.2%. On the old screener you'd skip it without a second thought, and you'd be right to. Switch the exit rule to +10% and the same three entry days read 6 of 8, 5 of 8, 3 of 8. The trade gets there. It just doesn't stay there. Held to the end it hands everything back and then some; taken at +10% it worked in six of the last eight cycles from that entry day. Click any cell for the receipts (Full details shows up on the right pane) [Subscribe to see more details] 2. Volatility term structure, through the pre-earnings window The second feature answers a different complaint: IV is up — is that my earnings, or is that the macro calendar? The volatility chart now plots the term structure across the run-up: the 7, 30, 60 and 90-day tenors together, plus the front and second expiry IV, from T-30 through to earnings. Seeing the tenors on one axis is the point. A front expiry pulling away from the back of the curve is the earnings premium building, and you can watch it happen day by day instead of inferring it from a single number. Flat separation means the premium isn't there yet. Macro events are marked on the same timeline — FOMC, CPI, PPI, PCE, jobs, GDP — which is what stops you misreading the chart. IV rising into your entry doesn't automatically mean the earnings premium is inflating; sometimes there's a CPI print sitting inside your holding window doing it instead. Those are two different trades and they deserve two different decisions. Where to find all this The profit-target view is now the default Daily Screener. Nothing is hidden — set the exit rule to Hold to T-0 and you have exactly the board you had last week, and the Classical View button next to the filters takes you back to the old layout entirely. There's also a Help button on the screener now that opens a full walkthrough in the side panel: how to read a cell, what the colors mean, and the win-rate-versus-hit-rate distinction above. Worth five minutes before you rely on the numbers. How I use it now Spread filter to the tightest bucket first — liquidity before edge, as always. Exit rule to +10%, Hit rate % to 60% or more. Scan for strong cells in the early columns. An entry day well before earnings gives the target room to get there. Open the cell and read the cycle list before committing to anything. If the hit rate rests on two cycles, I haven't found anything yet. As always: if there's a number you wish the screener showed, send me a message. That's how both of these got built. SO members on the ALL bundle: full core access to EarningsStudy is free through the partnership — just sign in at earningsstudy.com with your SO email. Everything above is historical and educational analysis, not a trade recommendation or financial advice. Options trading involves substantial risk. Historical figures are derived from end-of-day data and will differ from intraday markets and from your actual fills.