All Activity
- Today
-
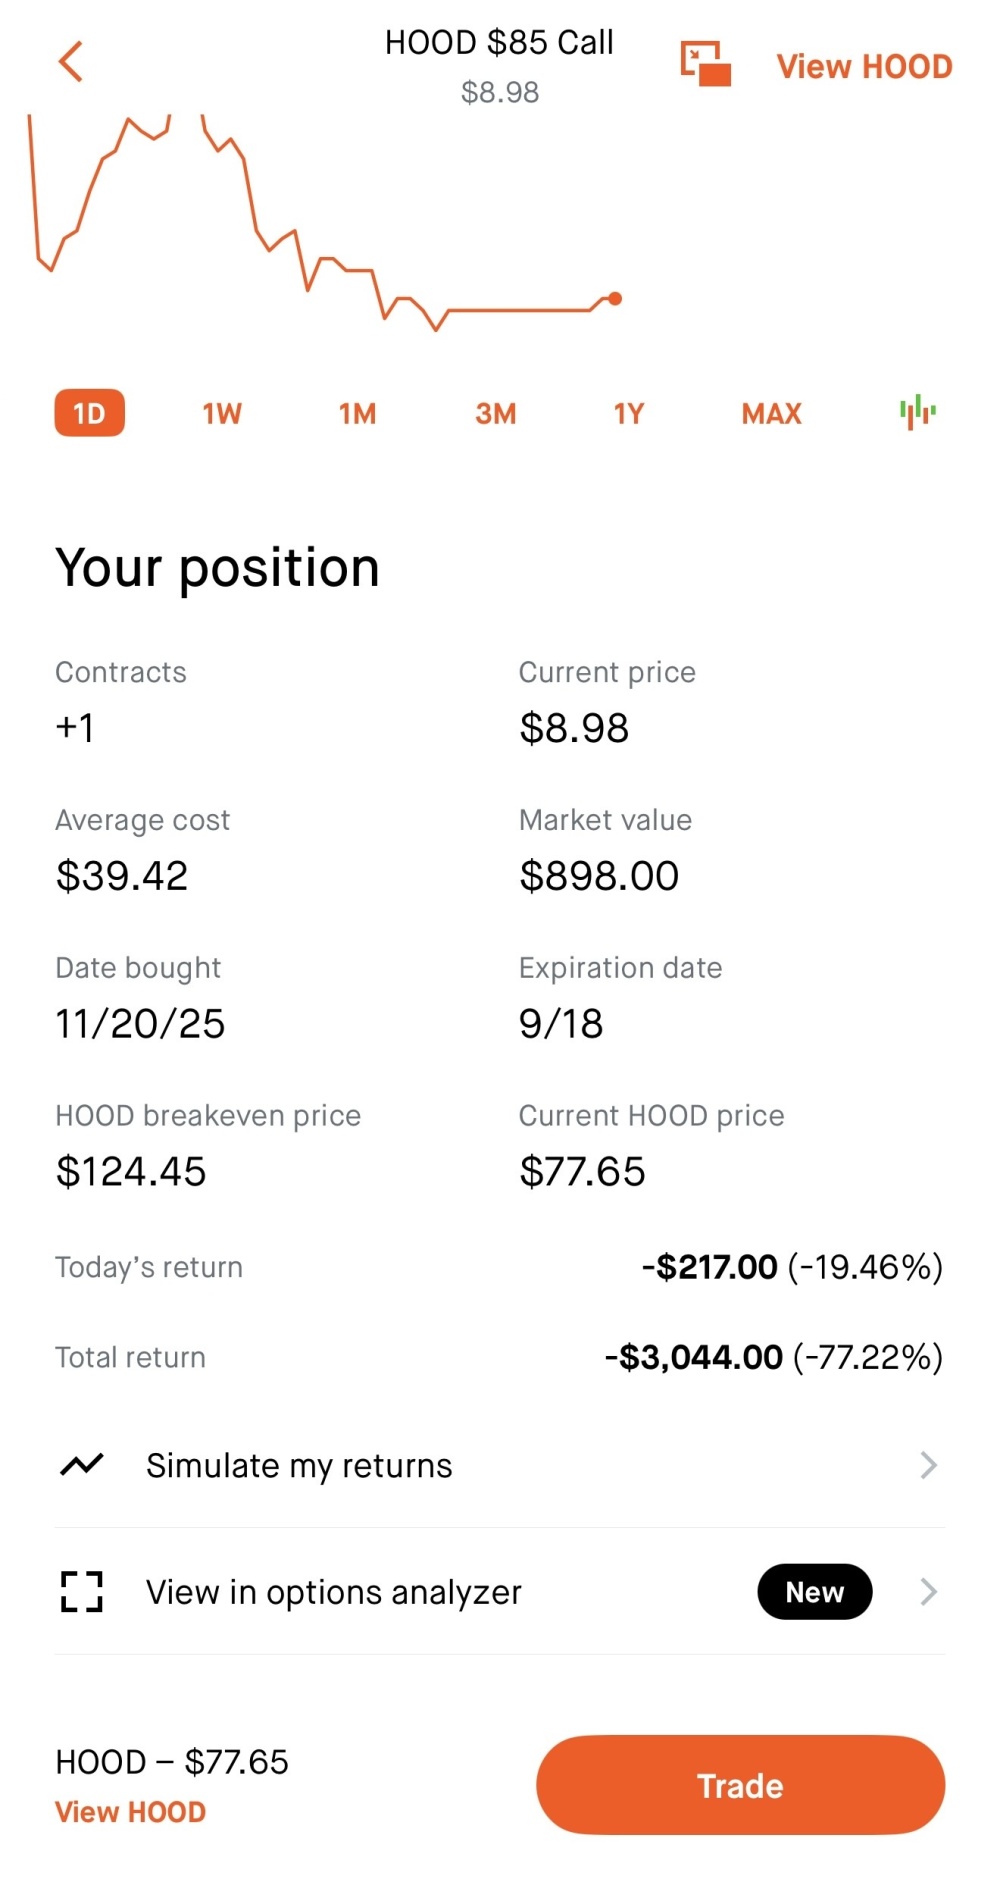
@rajavel44 Since you have 1 long option you can use a form of the stock recovery strategy. This would be buying a 1x2 call ratio spread where you'd buy another September 85 call and sell 2 September 105 calls - this could be done for close to zero or a small debit and leave you with 2 long 85 calls and 2 short 105 calls. This would cap your gains at the stock price of 105 or beyond at expiration - but it allows your gains to grow at 2x the rate (compared to just having the long call) between the stock prices of 85 and 105. Therefore, with this 1x2 spread added your overall break-even would be lowered to the stock price being at 105 or above by expiration (but since your gains are capped at a stock price of 105 this means your best case outcome is around break-even on your overall trade). Summarizing, if you hold until September expiration your results be as follows: Stock price below 85 - you lose 100% of what you paid (same as with just the long call), but since the 1x2 was put on for close to zero cost this will have minimal impact on your overall loss amount. Stock price between 86-105 - your loss gets smaller the more the stock price rises and the value of this spread will twice what just the long call would have been. Stock price above 105 - gains are capped at a stock price of 105 where the total value would be 40.00. If the stock price is above 105 it would be the same thing as stock price at 105.
- Last week
-
 Boatdrinks joined the community
 -
 Luay joined the community
 -
 13january13 joined the community
 -
 16january16 joined the community
 -
 rajavel44 joined the community
 -
-

Which tools are best for backtesting trading?
Yowster replied to Tradingwise23's topic in General Board
I like OptionNetExlorer (ONE) for that. It allows you to enter any type of trade at a specific date in the past and then step through it day-by-day where you see dots that represent intra-day prices each day (so you can see the range of prices throughout the day). Other tools show end-of-day pricing for trades using SO strategies for stocks in prior earnings cycles, and this is a great scanning tool. But if you want to see the day-to-day daily detail of how a trade strategy progresses through time then ONE is great for that. -
 kesalvijayeri joined the community
 -
(1).thumb.png.0ab0145ca2102f360a8d3a7e17838eee.png) Tradingwise23 changed their profile photo
Tradingwise23 changed their profile photo -
Tradingwise23 joined the community
-
Which tools are best for backtesting trading?
- Earlier
-
 Martin Sikora joined the community
 -
 Guy the Great joined the community
 -
 VinRay joined the community
 -
Yes it includes the heatmap.
- 1130 replies
-
- 1
-

-
- rv chart
- volatilityhq.com
- (and 1 more)
-
I am about to subscribe. Can you confirm that the subscription also includes those heat maps? It is indeed a key piece of the puzzle I was missing, and it seems I am about to resolve it. (I have been nagging Kim for months about this issue.) The reason I ask is that the page https://www.volatilityhq.com/payments/subscribe/ says nothing about those heatmaps. It only mentions RV charts and a scanner. @Kim @Yowster
-
Seems to be back up. It may have had to do with an expired certificate somewhere on the provider's end.
-
YES for me Thank You
-
Is it back for anyone ? It seems it's back for me but i don't understand why i was down in the first place.
-
It's down for me too, i'm not sure what's going on. I think it's the first time the service goes down like that. Looking into it.
-
Same for me
- 1130 replies
-
- 1
-

-
- rv chart
- volatilityhq.com
- (and 1 more)
-
I see 503 error.
-
Hi is volhq currently down for anyone else right now?
-
 Looks like a great tool but I dont have time to assess before June.
 -
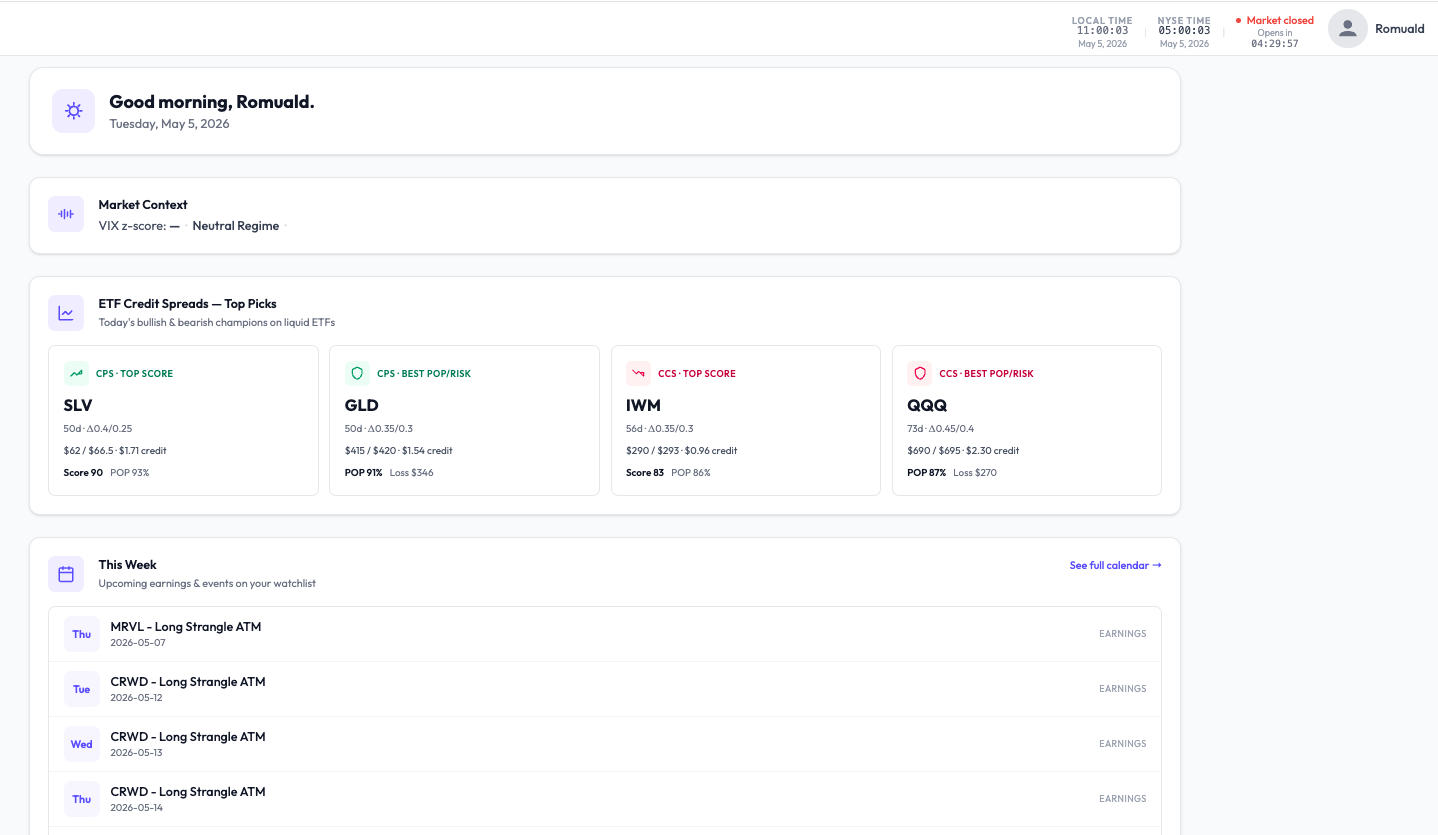
 Here is an interesting discussion with Srini M: Romuald 889 Replied: 16 hours ago · IP Hi Srini, thanks for the honest feedback — those are exactly the right questions. How is OptionBench different from MarketChameleon? MC is a great general-purpose options data platform — they cover earnings strategies, IV scans, unusual options activity, and a lot more. We're going in a more focused direction: - We only scan a curated universe (26 liquid ETFs for credit spreads, ~80 stocks for pre-earnings) instead of the whole market — the goal is depth over breadth on the setups that actually work for retail credit-spread traders - Every metric shows its uncertainty: POP comes with a confidence band (e.g., "93.32% ± 0.91"), not just a single number. Backtests show sample size warnings (Low / Medium / High confidence based on number of historical analogues) - We Monte-Carlo every credit spread across 12 DTEs × 7 delta pairs × 5 take-profit levels (5,000 sims each) — the scanner doesn't pick one "right" setup, it shows you the entire opportunity surface and scores them - Pricing target ~50% of MC, single tier, no upsell pressure - We publish negative results too — when we backtest a strategy and it doesn't have edge, it gets archived as "tested but not deployed", not buried. Keeps us honest with ourselves and users. Different positioning, not better — we're a focused tool for traders who already know credit spreads and want depth, not a one-stop shop. On videos / quick learning Fair point and I agree. For the beta, I'll have a Quick Start guide (5-min read) and 2-3 short walkthrough videos focused on the most-asked workflows: 1) "I have 30 minutes, find me 3 credit spread candidates" 2) "Pre-earnings setup walkthrough on a real ticker" 3) "What do all these metrics mean and which ones matter most" Tooltips on every metric in-app too. On "minimal time to find profitable trades" That's literally the design philosophy. The "Today" briefing on the homepage shows the 4 best CPS picks, 4 best CCS picks, this week's earnings tickers, and upcoming macro events — all curated, not raw data dumps. The full scanners are there if you want to dig deeper, but the homepage is built to answer "what's worth my time today". Beta starts in a few weeks. If you want to test it and call out where we miss the mark, I'd genuinely value the feedback. Romuald Disclaimer: not financial advice, options trading involves substantial risk.
 -
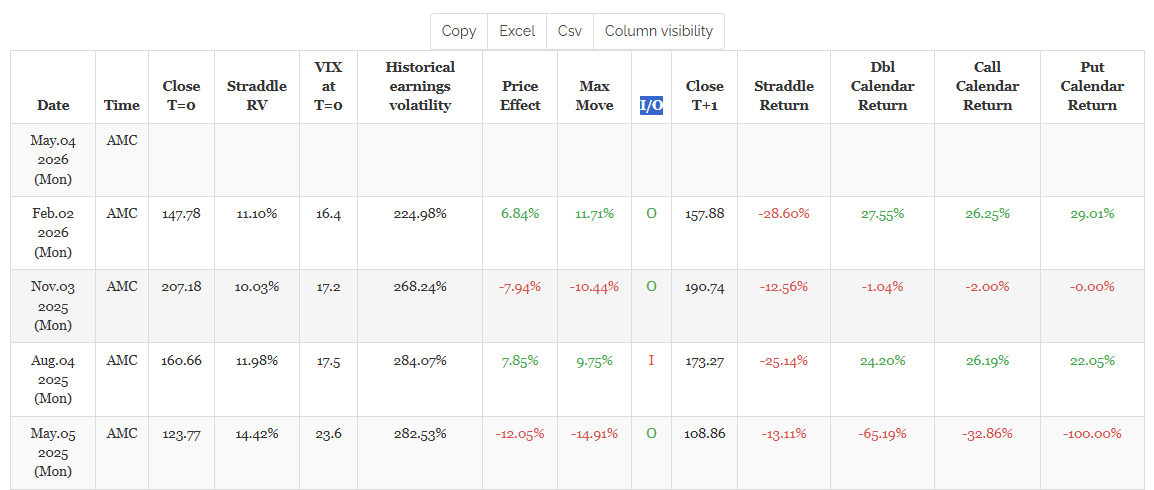
I/O is : I (inside) if absolute value(max_move) < straddle RV, else it's O (outside).
-
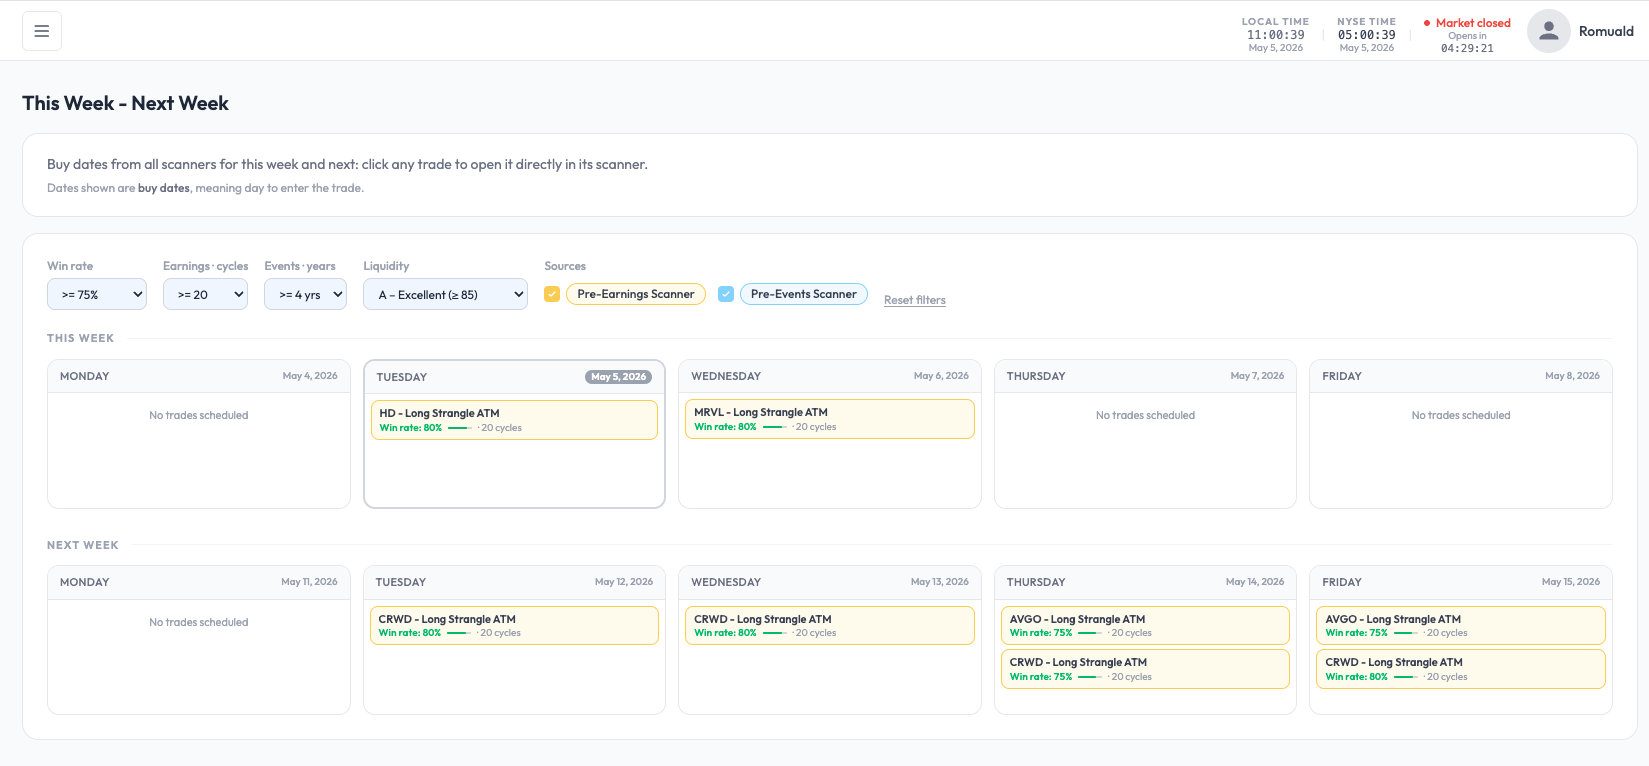
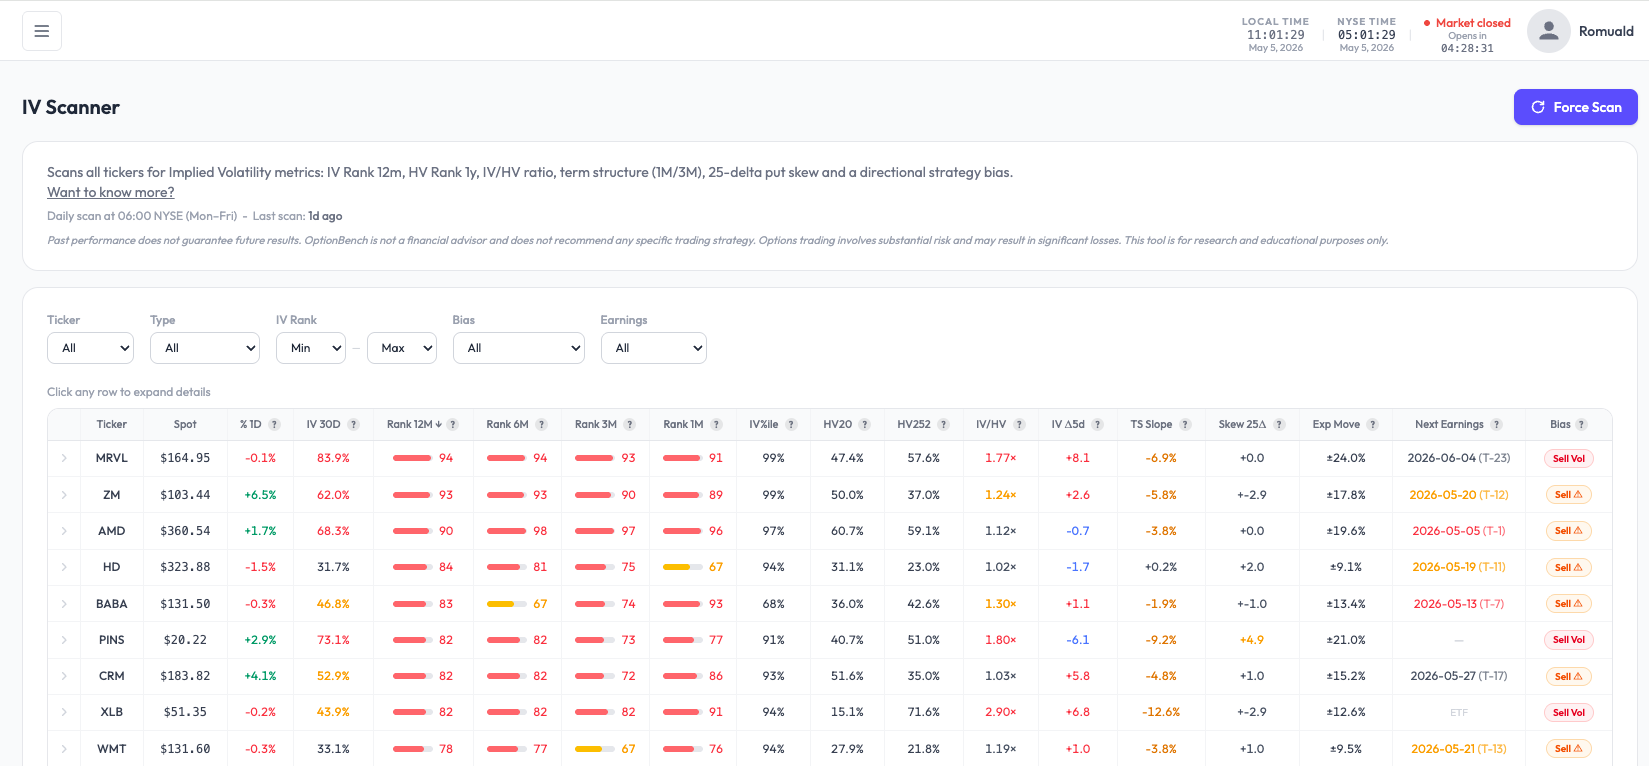
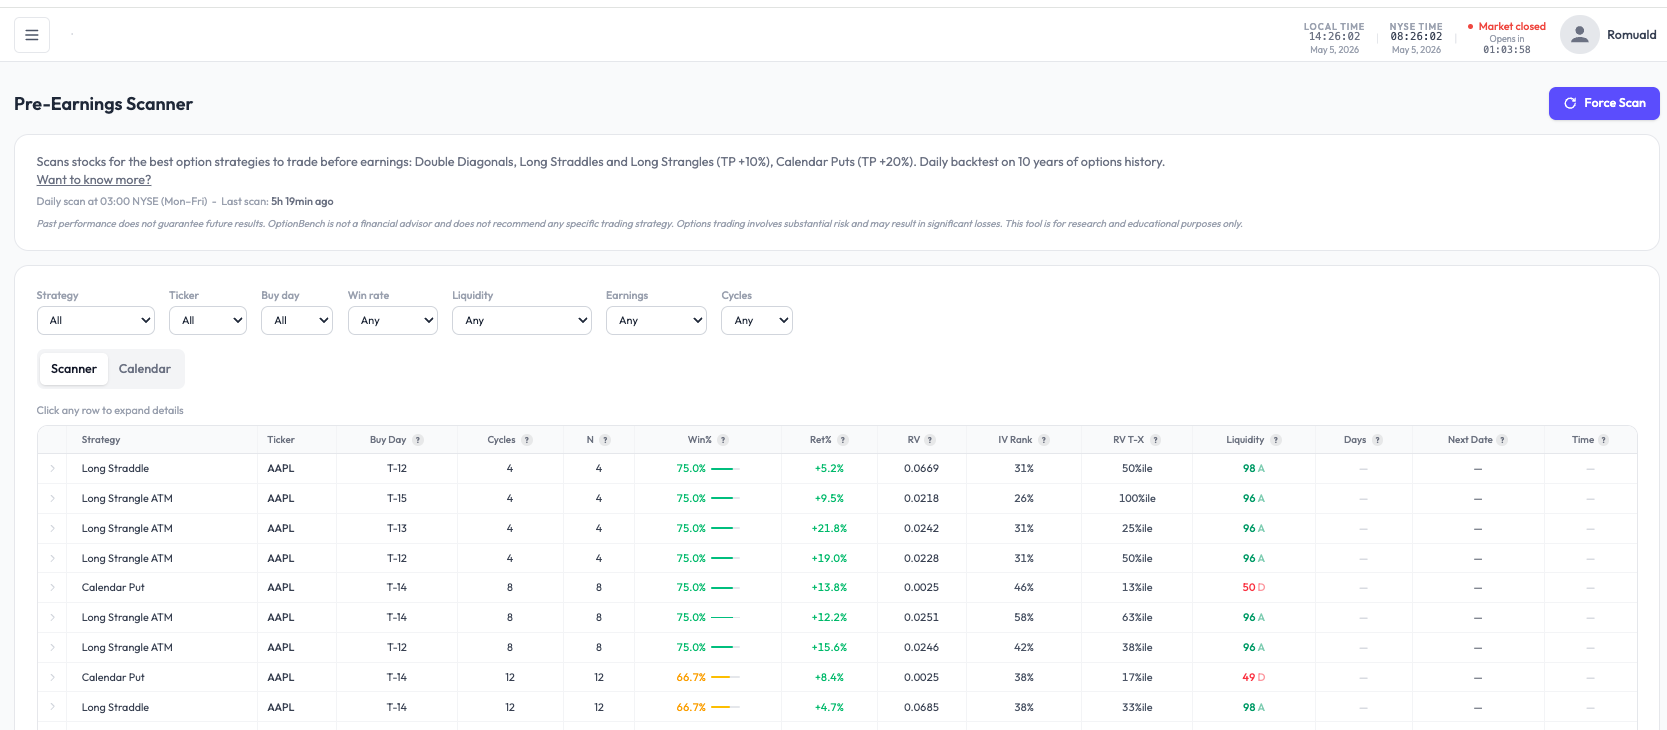
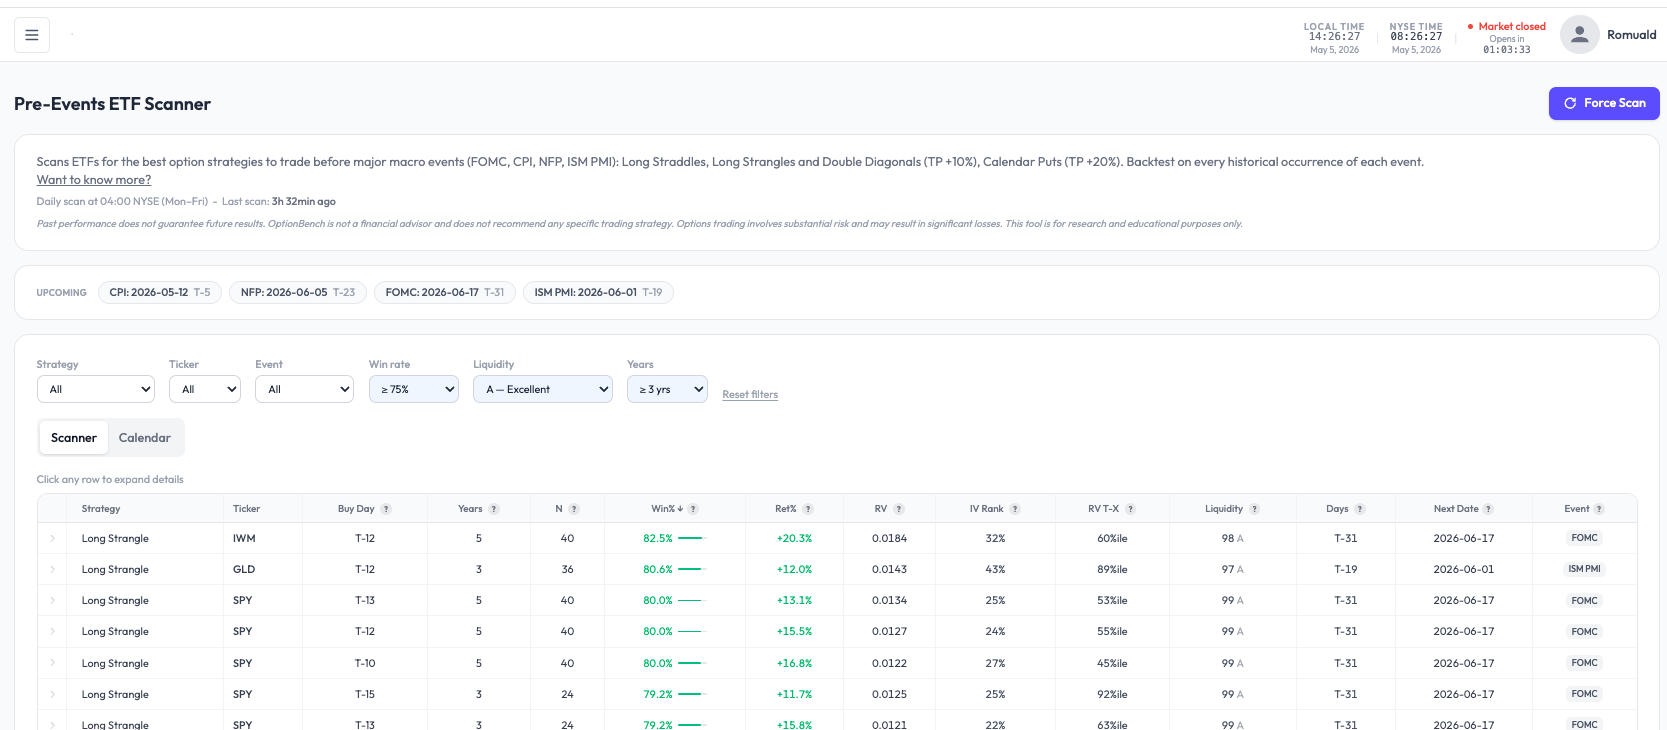
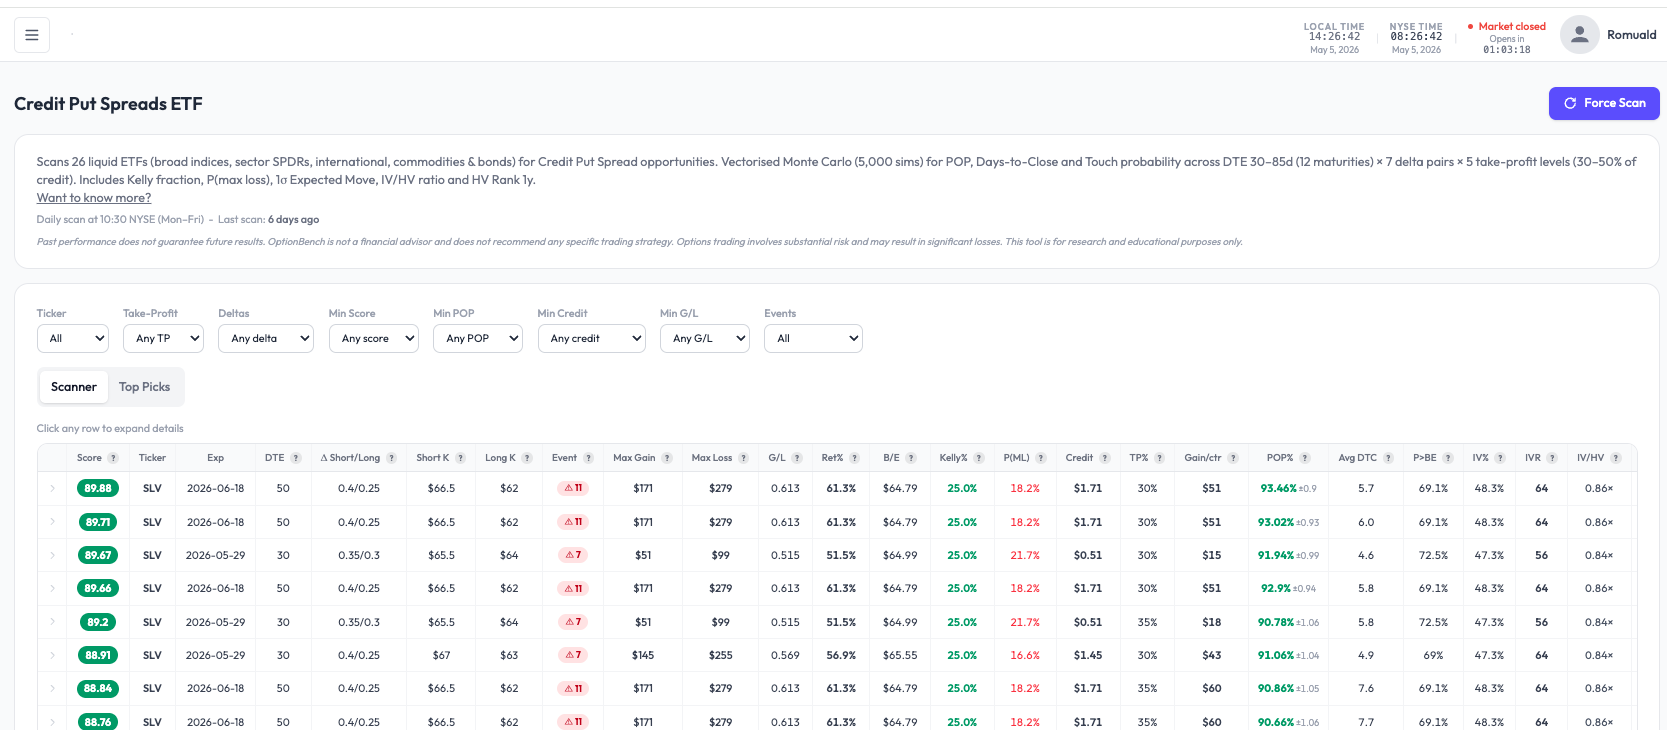
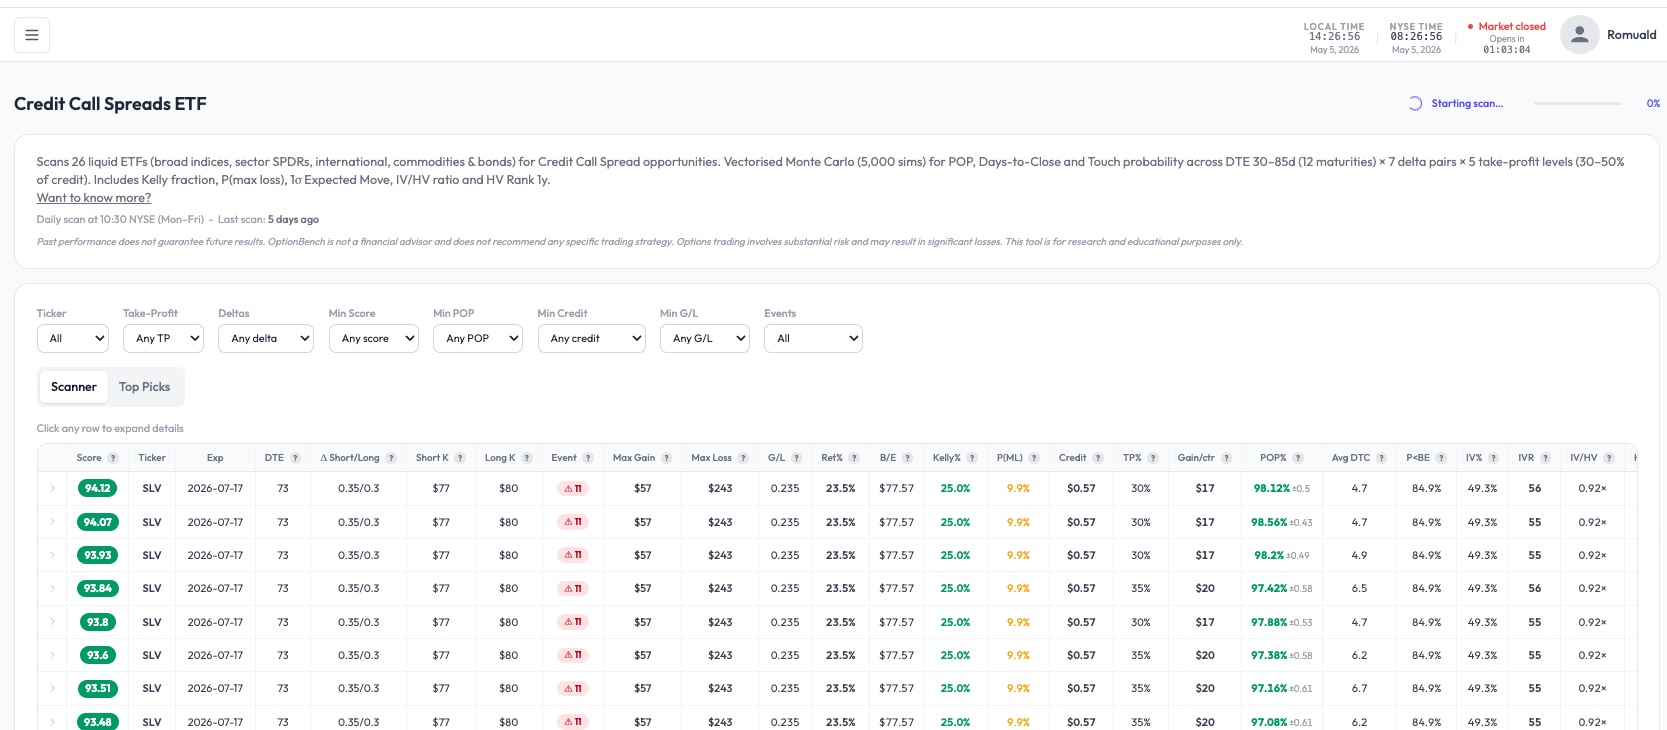
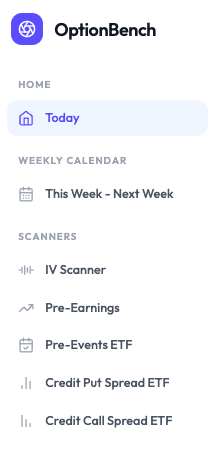
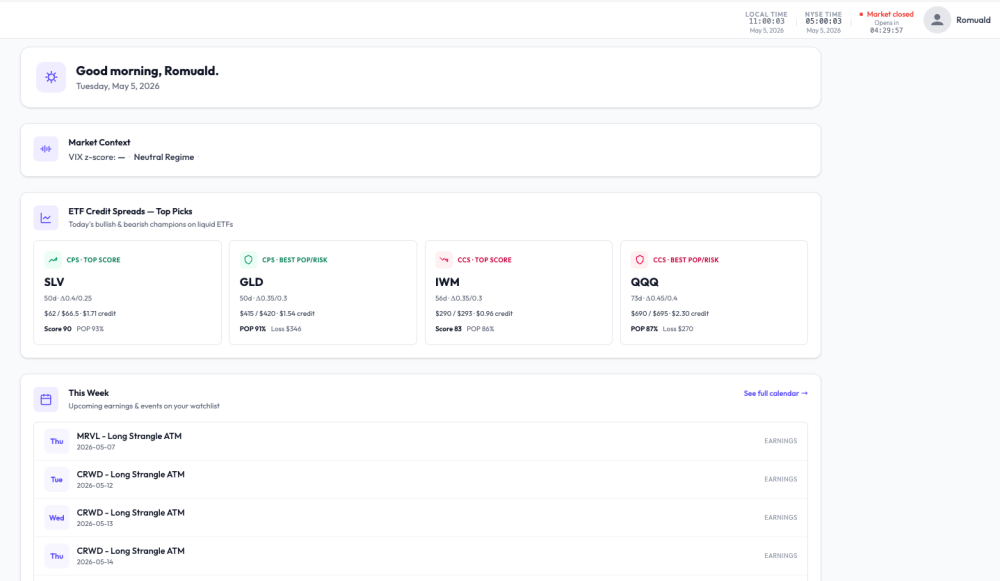
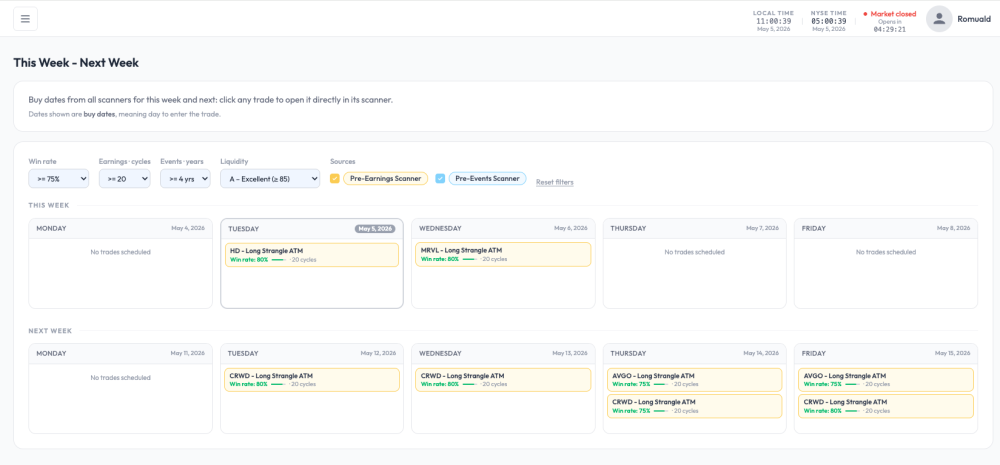
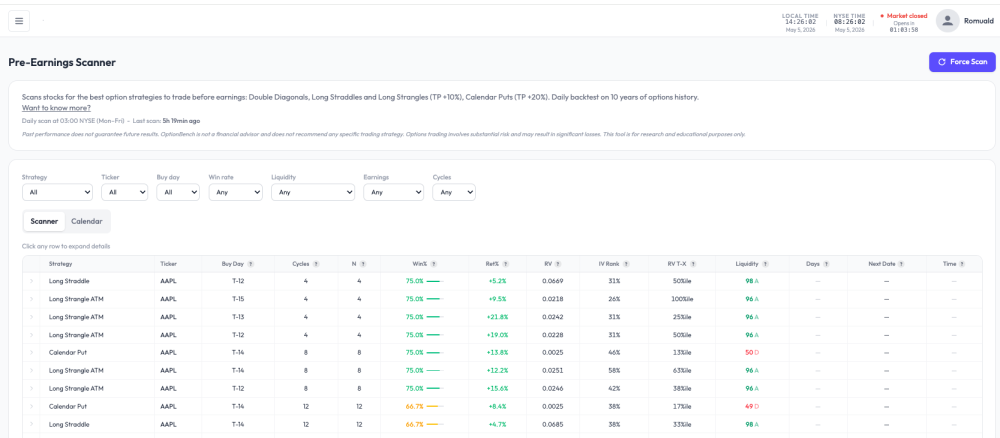
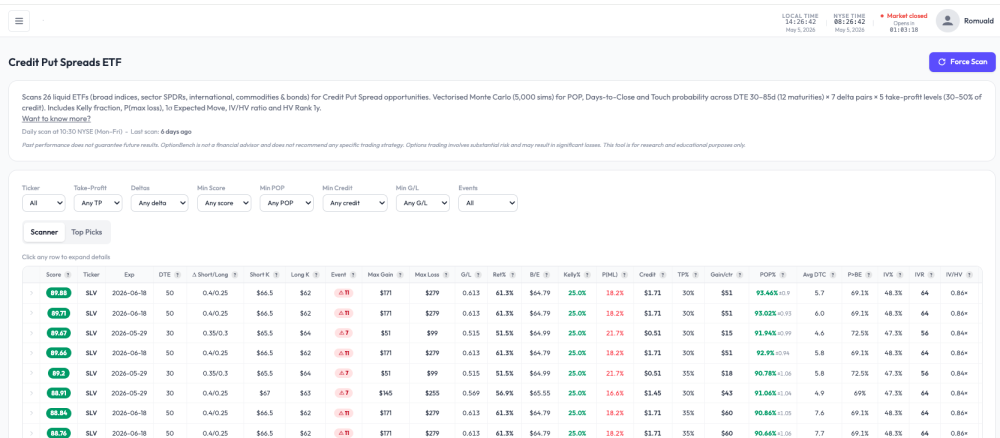
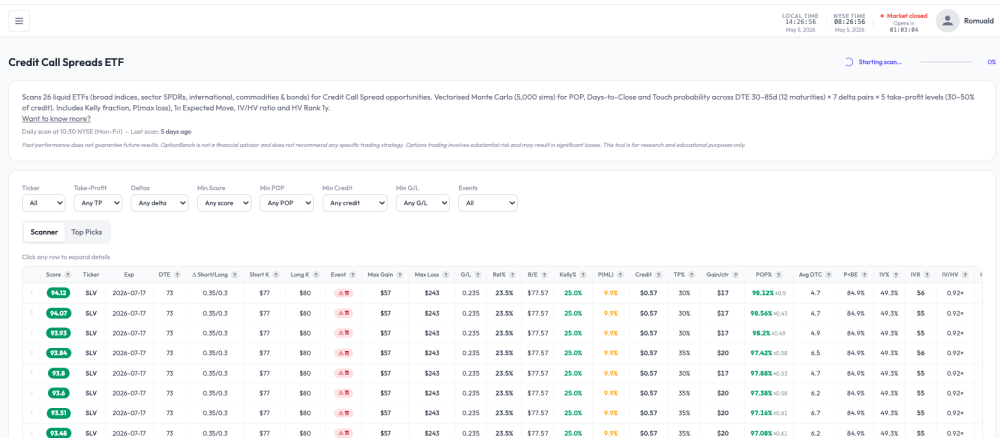
Hi all, I'm Romuald, an options trader and member of SO. Over the past several months I've been building a scanner suite called OptionBench, primarily to scratch my own itch — I wanted a tool that surfaces credit-spread and pre-earnings setups with transparent methodology, without hype and signal-service noise. Then, in the future V2 version of the tool, there will be a powerful and fast options-strategies-backtester. Public launch is targeted for June 2026. Before that, I'd like to (1) show the community what it does, (2) get critical feedback from people who actually trade options seriously, and (3) recruit a small group of beta-testers who'll get free access during the beta phase. What OptionBench does — V1 In the V1 there will be five scanners, a "Today" landing dashboard, and a two-week trade calendar. The UI is intentionally sober — no flashy graphics, no countdown timers, no upsell pop-ups. "Today" dashboard Single landing view with the day's top CPS / CCS picks (Top Score + Best POP/Risk for each side) and the upcoming earnings/events on your watchlist. Weekly calendar (This Week / Next Week) Buy-dates aggregated from all scanners across the current week and the next, filterable by win rate, cycles, years of history, and liquidity grade. Click any cell to jump straight to the underlying scanner row. The five scanners 1. IV Scanner Scans ~100 tickers daily for IV Rank 12m, HV Rank 1y, IV/HV ratio, term structure (1M/3M), 25-delta put skew, and a directional bias signal. Useful for premium-selling candidate selection. 2. Pre-Earnings Scanner For tickers with upcoming earnings, runs historical analogues across Long Straddle, Long Strangle ATM, Double Diagonals and Calendar Put strategies (TP +10% / +20%). Roughly 10 years of options history, win rate by buy-day (T-15 to T-1), Ret%, RV, IV Rank, liquidity grade. 3. Pre-Events ETF Scanner Same idea but for ETFs around macro events: FOMC, CPI, NFP, ISM PMI. Backtest on every historical occurrence of each event. Shows upcoming dates with T-X countdowns and ranks setups by win rate, Ret%, and liquidity. 4. Credit Put Spreads ETF (CPS) 26 liquid ETFs (broad indices, sector SPDRs, international, commodities, bonds). Vectorised Monte Carlo (5,000 sims) for POP, Days-to-Close, and Touch probability. 5. Credit Call Spreads ETF (CCS) Mirror of CPS for bearish setups. Same universe, same engine, same metrics. Beta-tester recruitment I'm looking for a small group (target ~10–20 people) of active options traders to use OptionBench during the beta phase, free of charge, in exchange for substantive feedback — what's broken, what's missing, what's misleading, what would make you stop using your current scanner, what would make you switch. If you'd like in: send me a PM with your email address and a one-line note on what you currently trade (credit spreads, pre-earnings, premium selling, IV plays, etc.) so I can balance the cohort across use cases. Not interested in the beta but want to be notified at launch? You can leave your email directly on the site: https://www.optionbench.com (waitlist form on the homepage — no spam, just a launch ping). And — if you have feedback, objections, or features you'd want to see in V1, I'd genuinely rather hear it now than after launch. Reply here or PM, both work. Critical feedback especially welcome. Thanks for reading. — Romuald Past performance does not guarantee future results. OptionBench is not a financial advisor and does not recommend any specific trading strategy. Options trading involves substantial risk and may result in significant losses. This tool is for research and educational purposes only.


-
I don't recall any execution issues.
-
@Djtux Is I/O column (that implies if the move was inside or outside Straddle RV), does it consider Max Move Column to make that determination? Or the move at Market Open after earnings because sure looks like it is not based on Price Effect (which is at close?)

-
Thank you for responding. Did you notice any differences while you were designated a professional? Were fills the same or did orders just sit there?
-
Yes, it happened to me some years ago with IB. I forget the details but I think they put me on professional rates the following month or two, until I went through a period of trading below the threshold and was able to revert to non-professional status again.
-
Can someone share their experience after violating this rule? I exceeded the daily average of 390 trades in a month back in 2020, and I did not experience any difference in my trading. Fills were no different and fees were the same. I was using thinkorswim. Does anyone else have experience exceeding this threshold?
-
Thanks!
-
Maybe the return matrix heatmap? Just try to subscribe for a month and if you don’t like it you can cancel on the website.
-
Hello, I am looking at "What do you get with your subscription?" on https://www.volatilityhq.com/payments/subscribe/ and see that the subscription comes with the RV charts for straddle and calendar, and a scanner. I was informed by Kim that the service can be used to identify suitable stocks for pre-earnings calendars/straddles. I understand that the RV charts can tell me whether a calendar/straddle of a particular stock is relatively cheap compared to previous cycles, but they do NOT tell whether that stock is suitable for a pre-earnings calendar/straddle trade. What information would the service provide to help me with the latter? Thanks.