All Activity
- Today
-
Got it. Thanks!
-
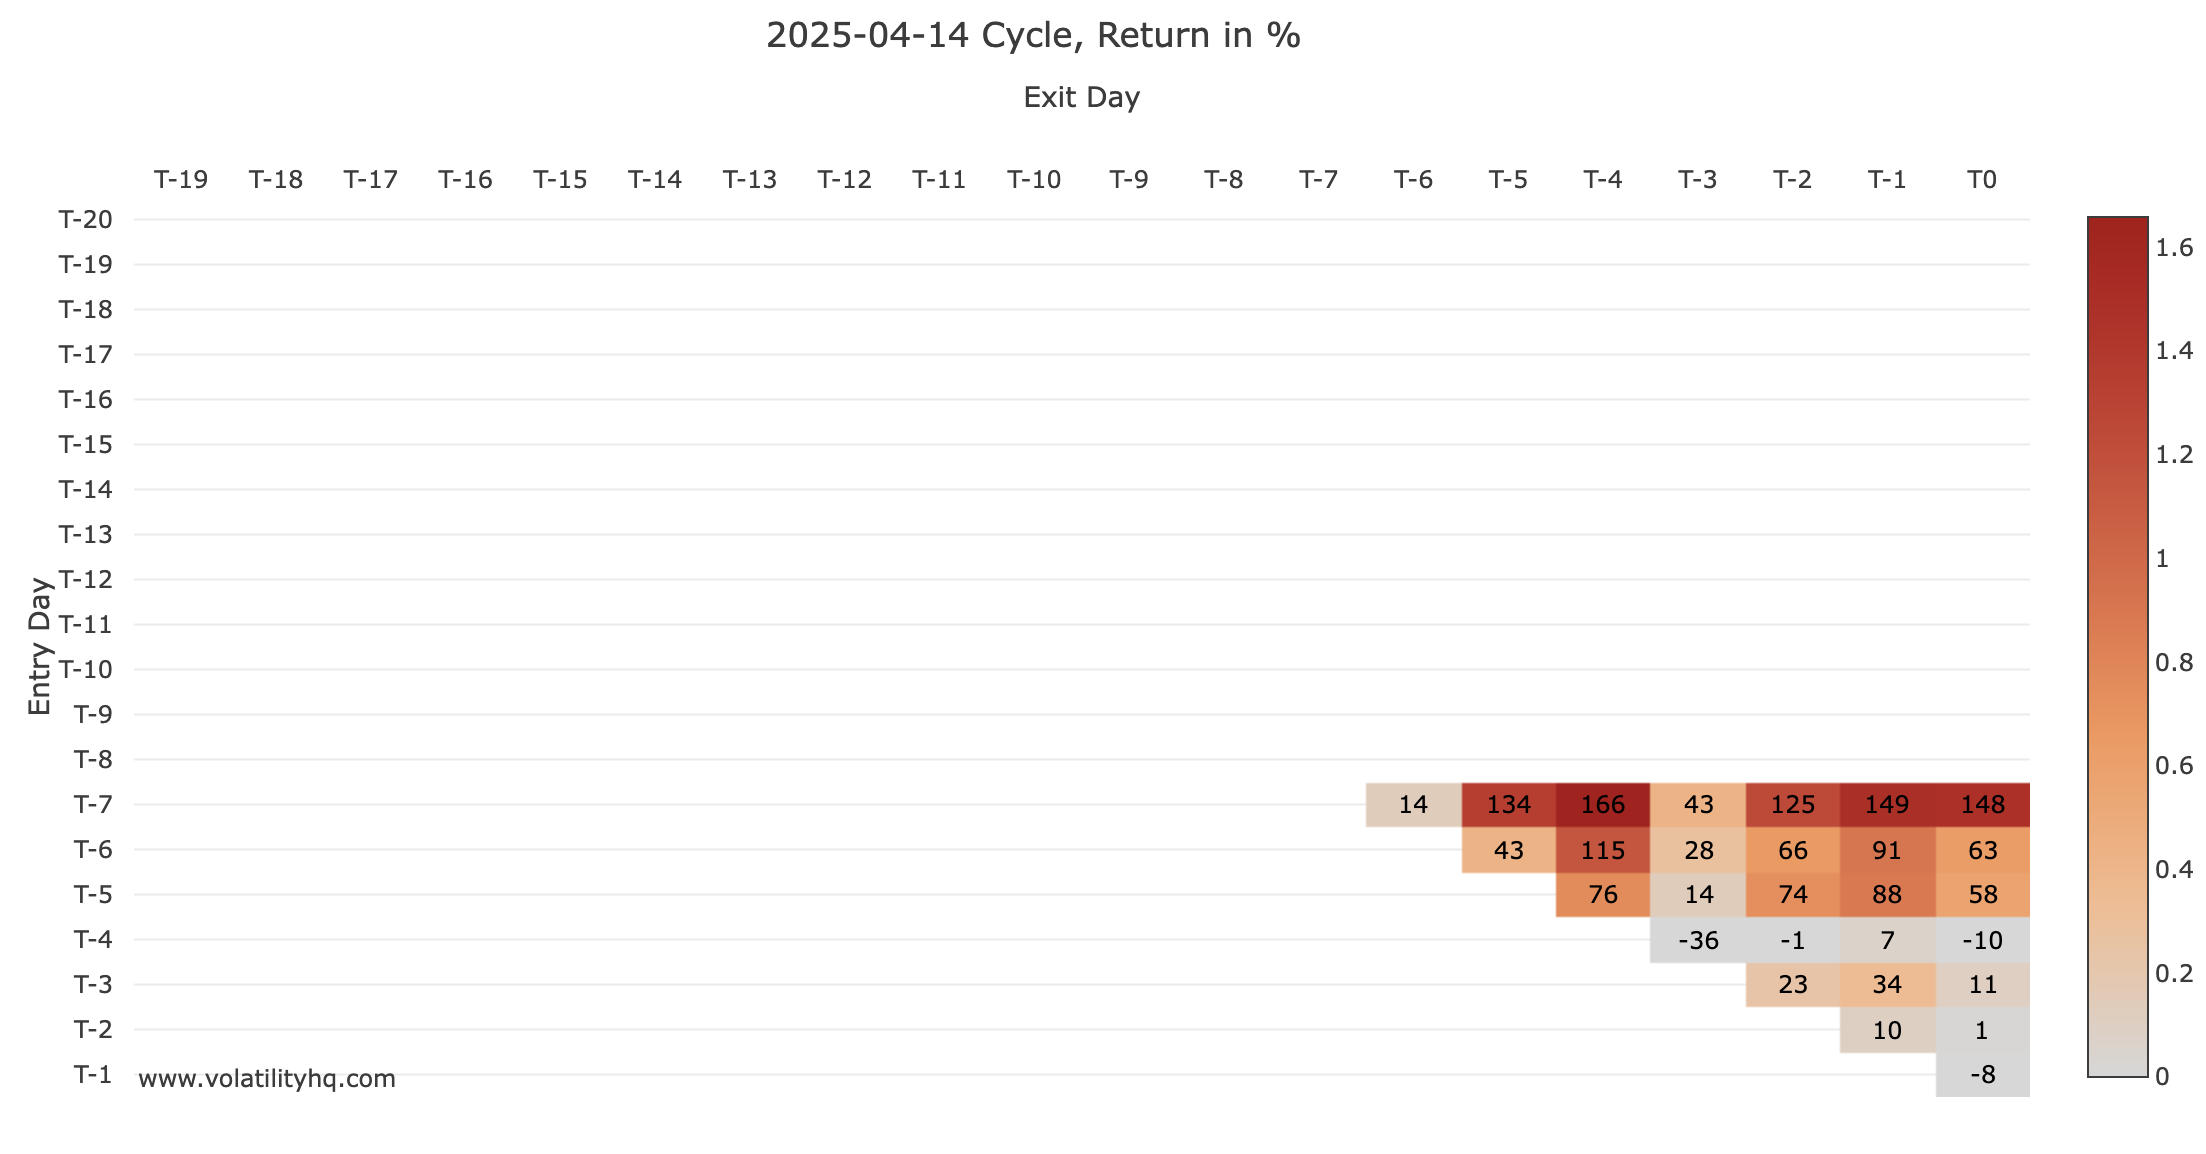
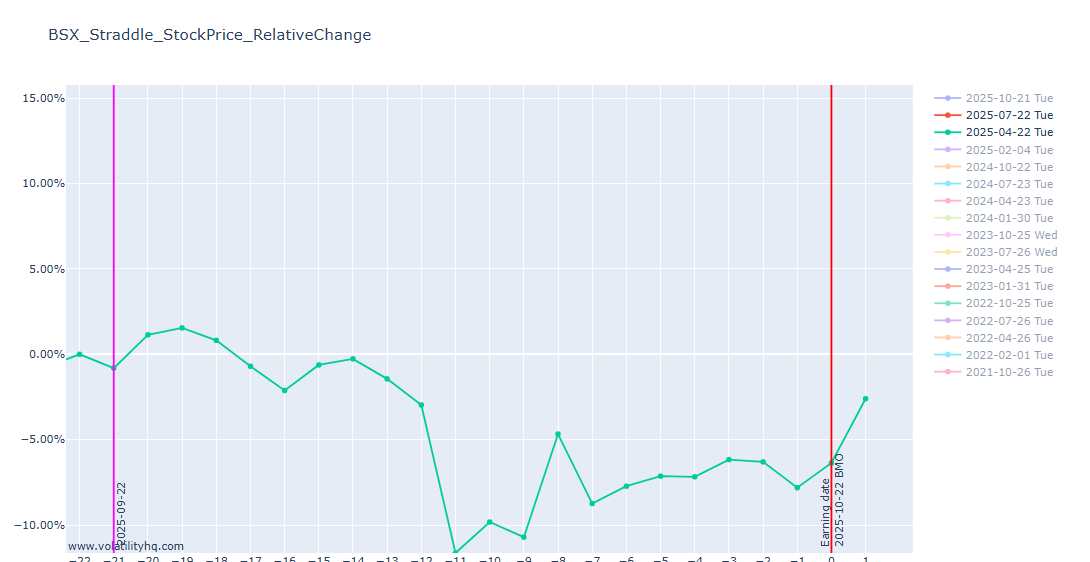
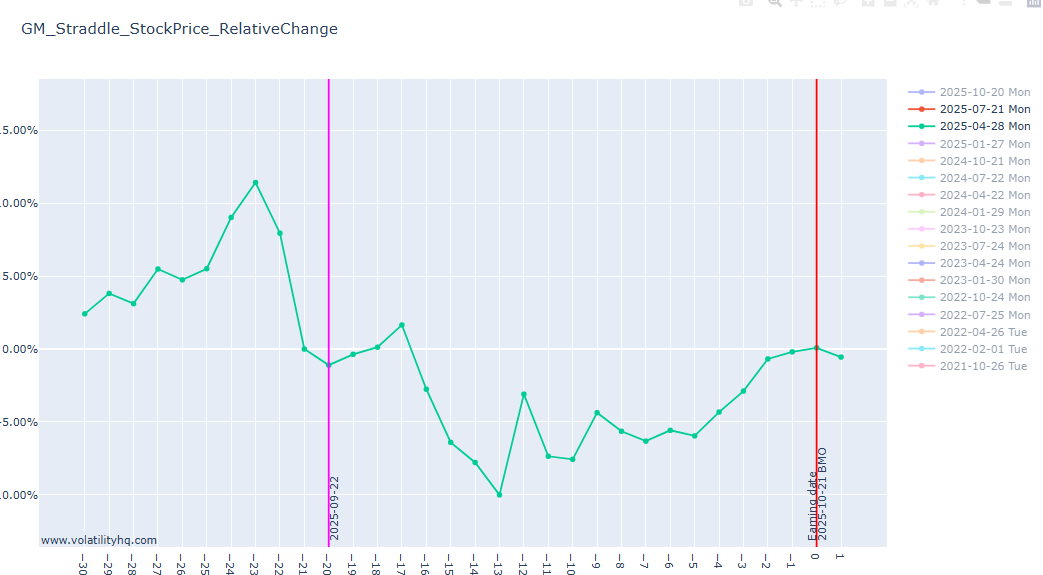
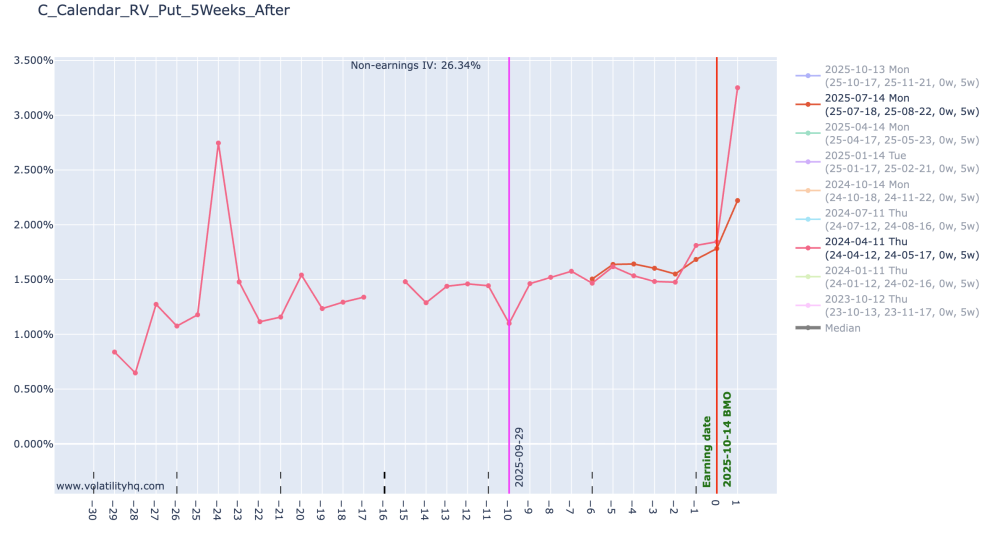
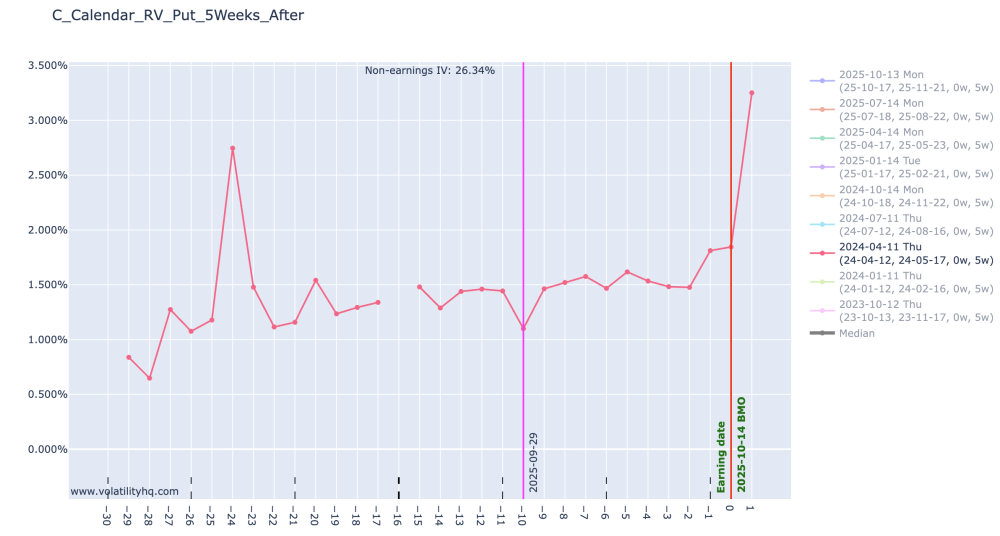
The return matrix cycle is 2025-04-14. Year 2025 and month april. In the RV chart, you display 2024-04-11 (year 2014 and month april) and 2025-07-14 (year 2025 and month july). They are not displaying the same cycle, unless i'm missing something.
-
 vappa joined the community
 -
No, I enabled only 2024 earlier. 2024-04-11 line to be specific. Below chart is both 2024 and 2025 (RED COLOR lines)
-
They are not the same cycle. One is 2024 and the other one is 2025.
-
For the ticker "C", choose monthly, by default it is 5 weeks, the data for the line for the chose expiration is not available before T-7th day as it shows in the return matrix. How the RV line shows data when it is not available?

- Yesterday
-
 jacky00358 joined the community
 -
Hello, I'm interested in the Steady Options service. Please, add me to the wait list. Thank you!
-
 dariskytrader joined the community
 -
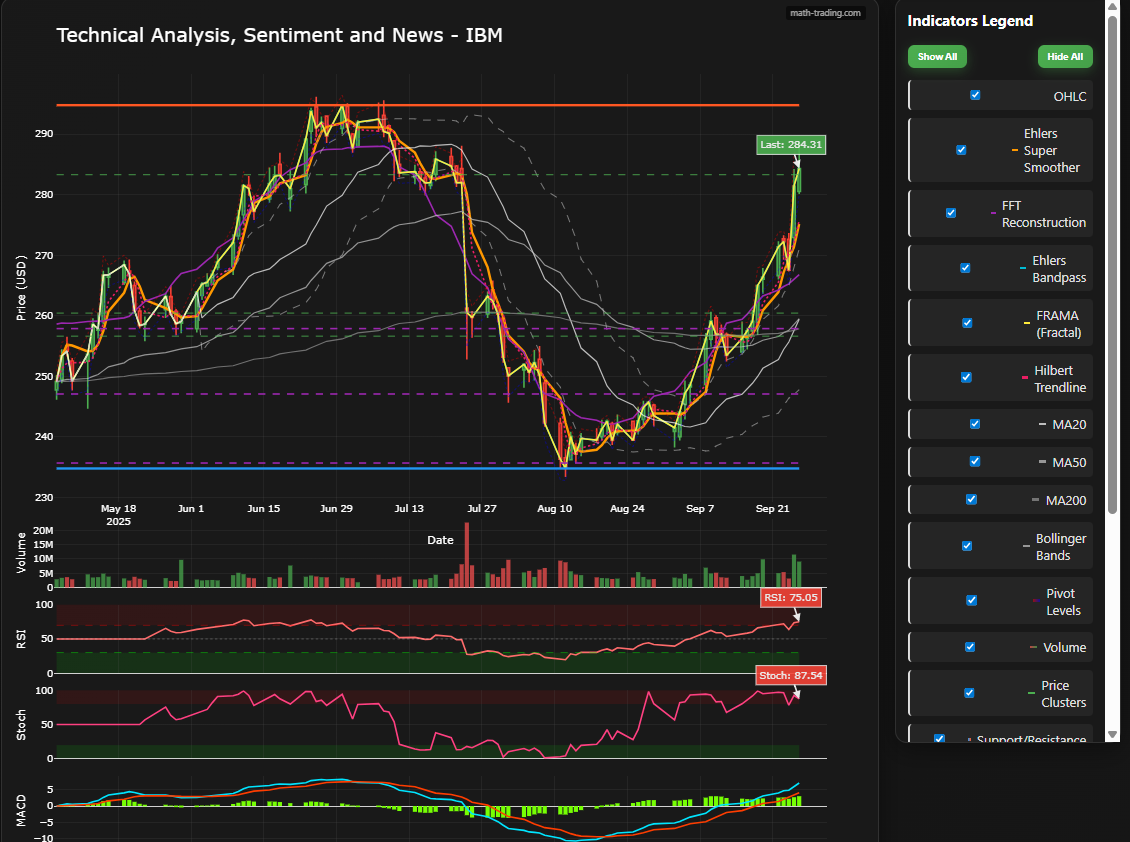
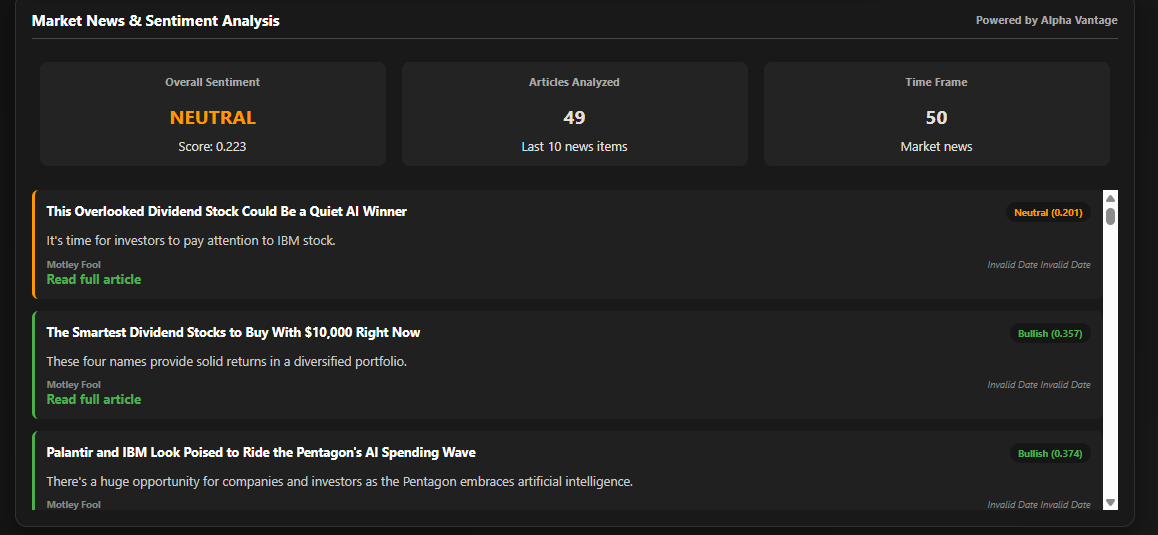
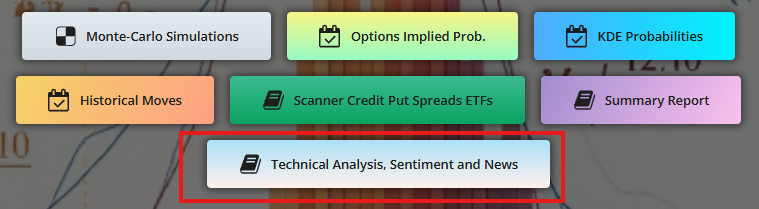
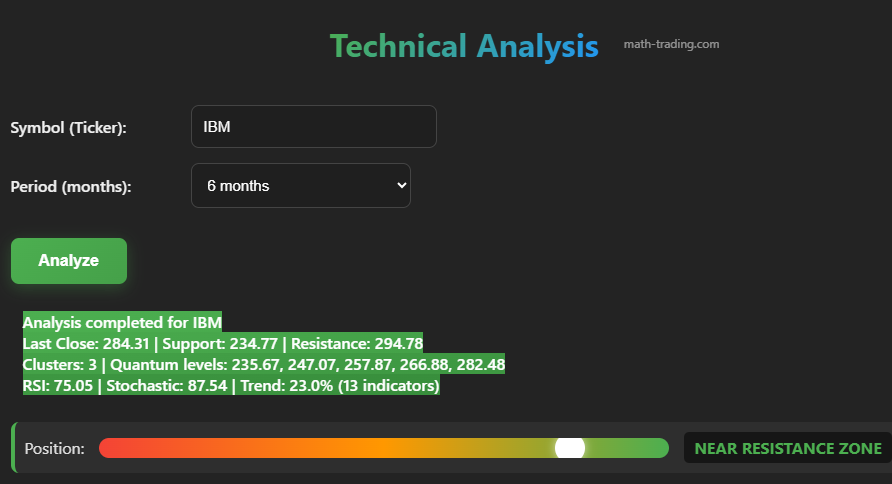
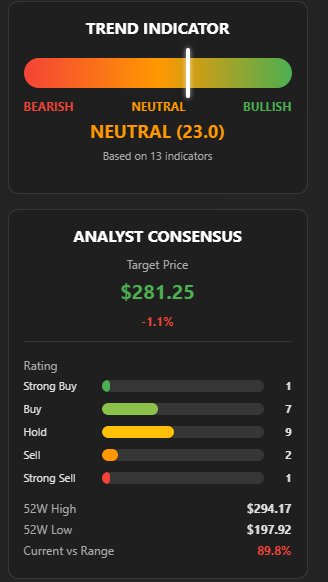
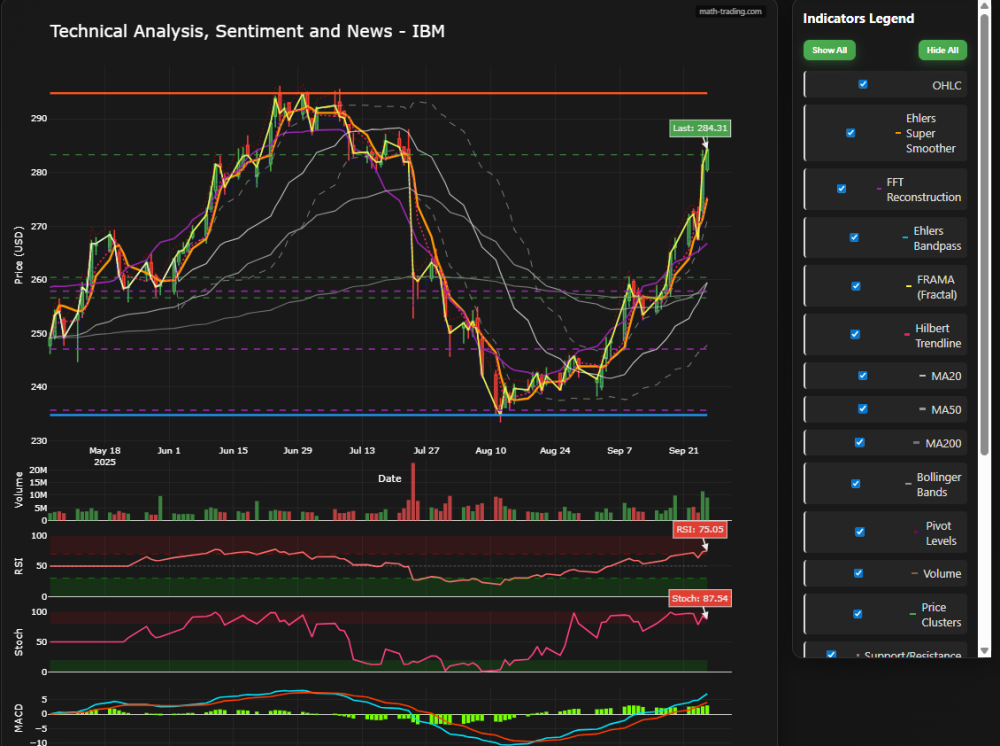
Following numerous requests from subscribers to my site math-trading.com, I have added a technical analysis tool. I am not a big fan of technical indicators because I have never found effective backtests for any of the 100 most common indicators. However, I understand that, outside of any predictive model, they can give an indication of trend, or at least of positioning relative to the history of the ticker in question. So I have synthesized in a tool the indicators for which I have had the least bad backtests. Subscribers can access it via the "Technical Analysis Sentiment and News" button: Here is what it looks like. You enter the ticker and the historical period to be analyzed (up to 6 months of history), then click on the "Analyze" button. The calculations are done very quickly. You immediately have an analysis of the ticker's position in relation to two support and resistance zones which have themselves been calculated based on the indicators. On the right of the chart you have a trend indicator based on 13 indicators and, below, an analyst consensus indicating summaries of what financial analysts think about the evolution of this ticker: strong buy, buy, hold, sell or strong sell, as well as the Highest and Lowest over the last 52 weeks and the ranking of the last close in relation to these points (here 89.8% indicates that IBM is in its "very high" zone compared to the past, therefore overbought) : Then you will find an OHLC chart over the requested period with some interesting indicators. By clicking in the legend you can choose to hide certain indicators, or even all of them. Finally, at the very end, you'll find a summary of all the news and sentiment currently published about the ticker. The algorithm reads all of its articles and establishes an overall sentiment. I hope this new tool meets your various needs. Of course, as promised, the price does not change with the addition of new tools. All subscribers automatically have access to newly released tools. I am currently working on a new tool that will be a database of the history of Long Straddle ATM Pre-earnings for around 100 tickers, a database that I hope to publish by the end of the month. Happy trading!

-
The end of an era... https://www.youtube.com/watch?v=aAN69ARdBo0
-
- 1
-

- Last week
-
 raineorshine changed their profile photo
 -
I just got the following message from one of my contacts: https://www.pacermonitor.com/public/case/60218423/Sheridan_Options_Mentoring,_LLC https://businessbankruptcies.com/cases/sheridan-options-mentoring-llc https://www.pacermonitor.com/public/case/60218431/Daniel_Gerard_Sheridan
-
- 1
-
-
I sent you a PM with the coupon code.
-
I'm considering subscribing but I don't see where you have listed the Coupon code for the 15% discount. Have I just missed seeing it somewhere?? Wondering, Glenn
- Earlier
-
 Nickel joined the community
 -
Not sure why the confusion..
-
@TradeBobby @Bhavan1986 I think I have found the issue, but it's going to take many hours to reimport and recalculate everything.
- 1071 replies
-
- 2
-

-
-
- rv chart
- volatilityhq.com
- (and 1 more)
-
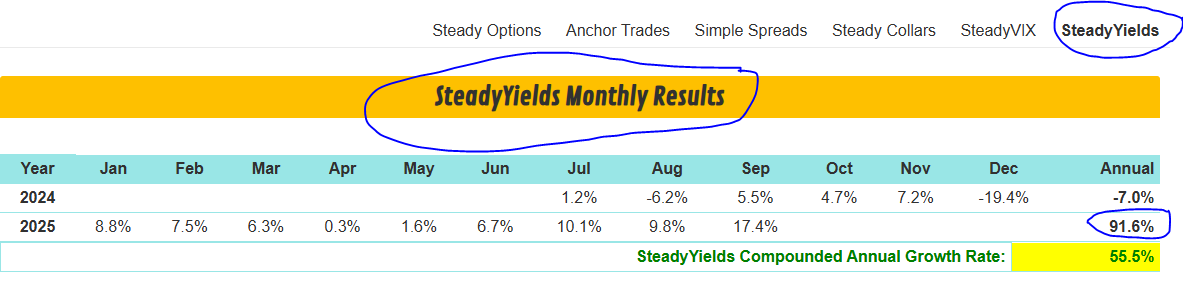
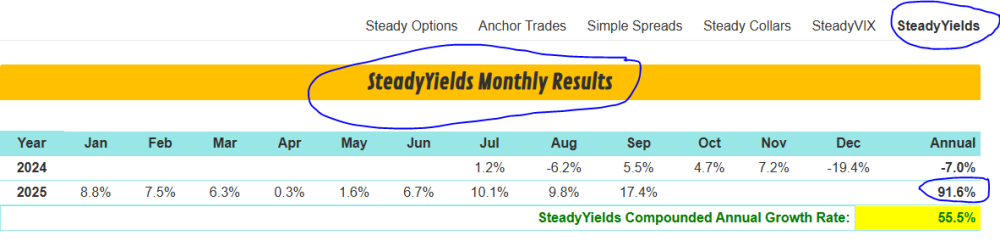
Steady Yields and Steady Options are different portfolios.
-
Why am i getting emails touting this program with a 91% truth? How can it have a 91% return YTD, as per the email I just got, when the model portfolio of $10K shows it is just over $10K with a YTD return of 5%. What am I missing?
-
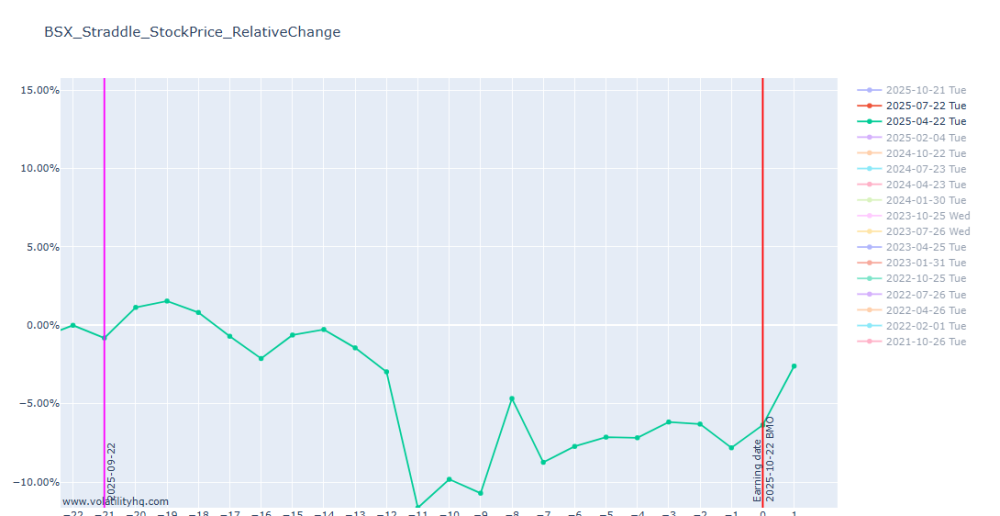
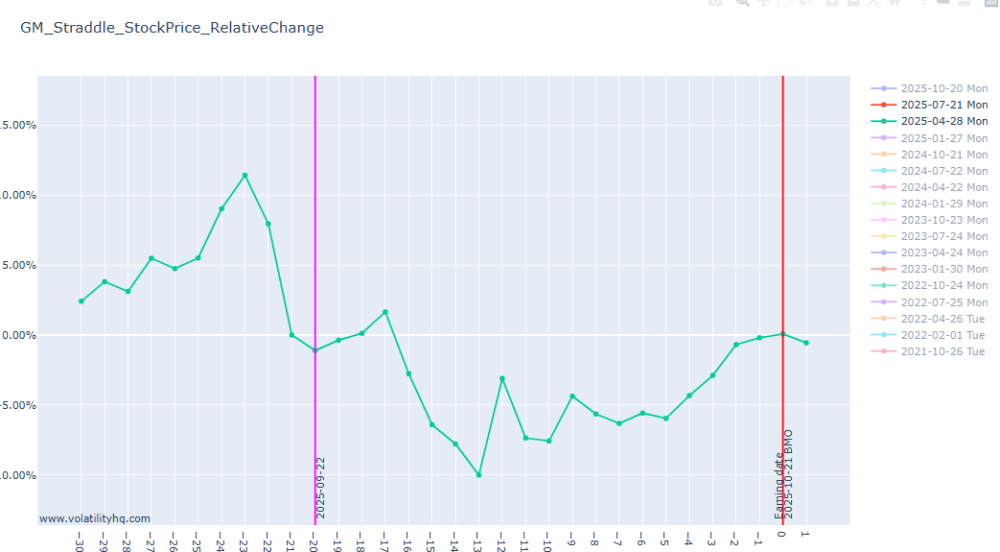
@DjtuxThe tool is missing data for quite a few days for the last Q. Please take a look.
-
Hi @Djtux I noticed when I'm checking for relative stock movement for Q3 2025 (where earnings has already occurred) the data line is missing. Just wondering if I may be doing something wrong. Thanks!
-
 alison joined the community
 -
 CCB001 joined the community
 -
 kevin669 joined the community
 -
Yes, most of the time it is possible to enter hours after the trade has been posted, sometimes even the next day. Of course the entry will depend of the underlying price - if the price moved significantly, sometimes the trade price can change as well. But for the most part, those are very slowly moving trades. The implementation is very different from the previous one. Yes, June 2024 performance would be very different from the previous implementation. In fact, it is possible it would actually make money in June 2024.
-
The strategy is described as low maintenance. How sensitive is the strategy to timing of entries, exits and rolls? With Double Diagonals, it was possible to enter (or roll) hours after a trade alert without impairment to performance. Is there a similar tolerance with this strategy? Also, how would the relaunched strategy have performed in April, May and June 2024? Would the June loss have been less? Thx
-
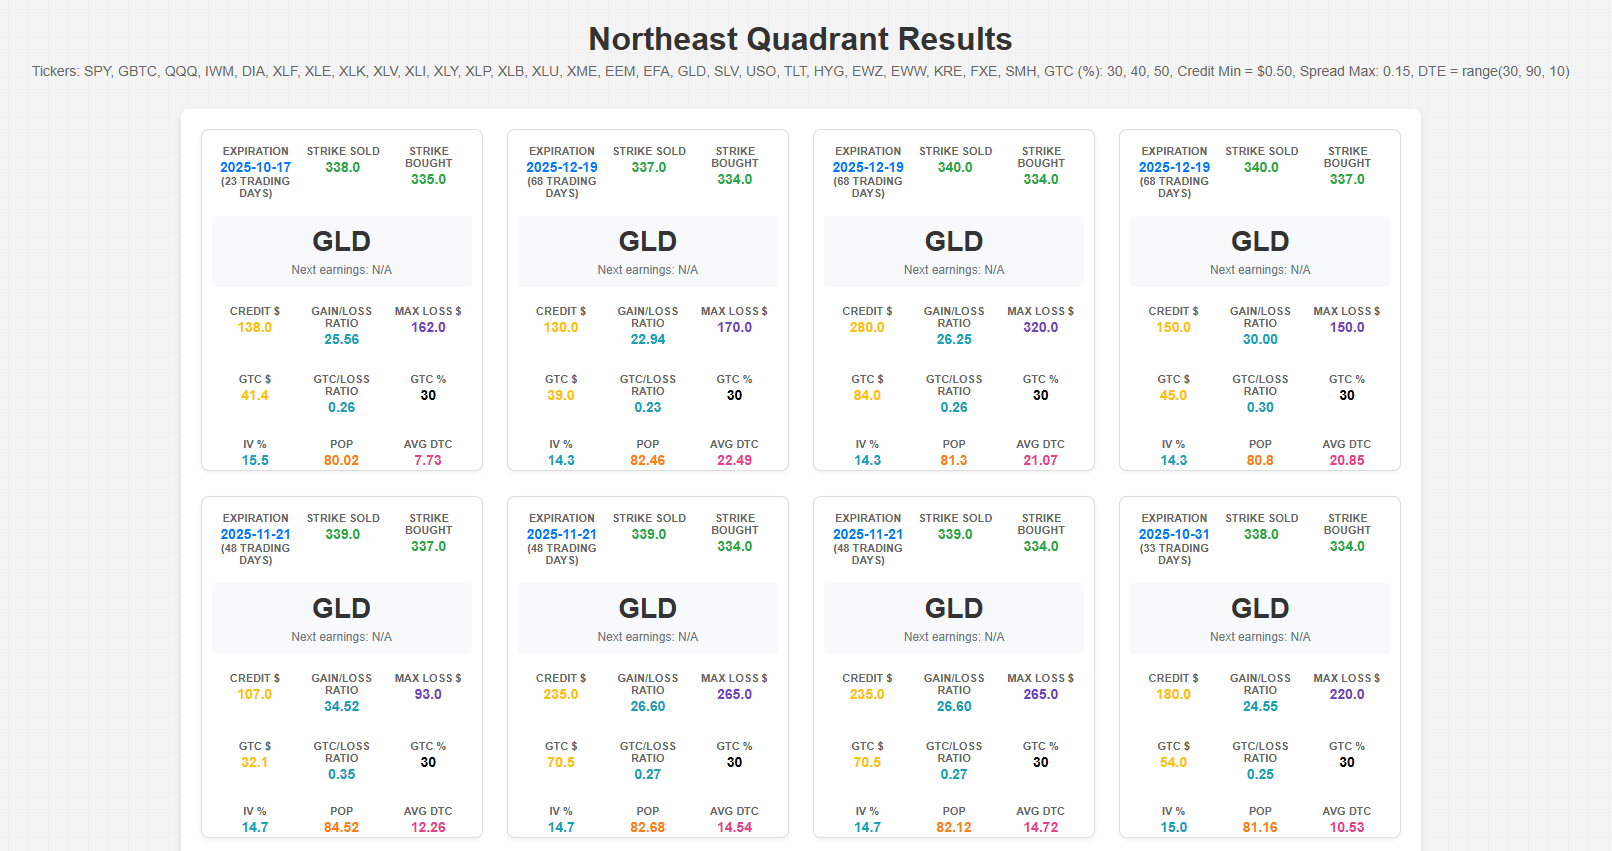
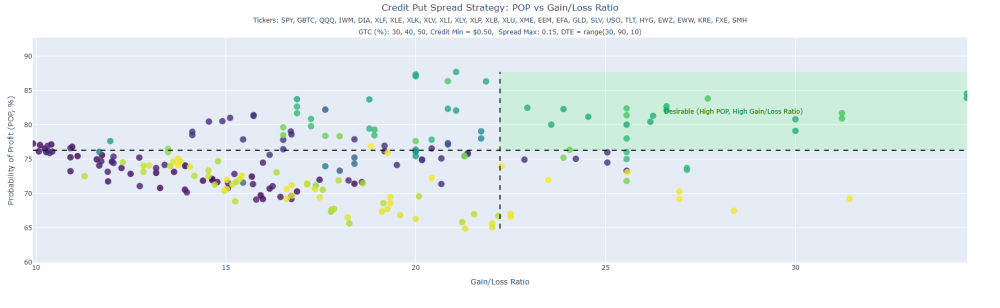
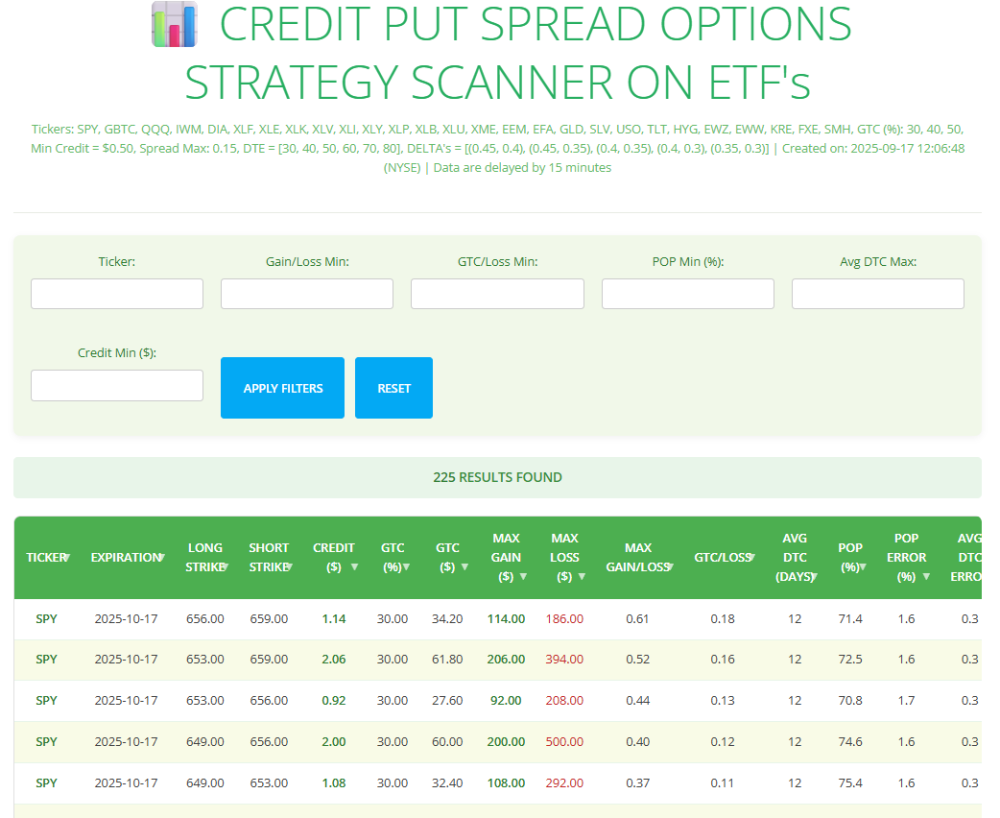
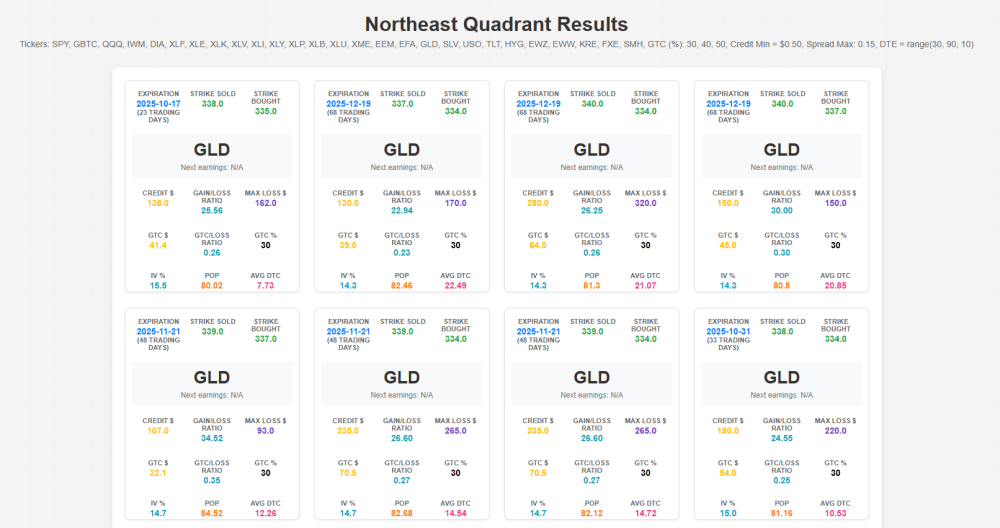
Every day, an algorithm of my design runs and performs millions of simulations to find the best Monte Carlo Probabilities of Profit (POP) for Credit Put Spreads on ETFs with different GTCs (30%, 40% and 50% of the max profit), which have a minimum credit of $0.50, a maximum spread of 0.15 and whose Days to Expiration (DTE) are in the range [30;40;50;60;70;90]. This produces a kind of "Stellar Map" with, on the ordinate, the POP and on the abscissa the Gain/Loss Ratio. 225 "stars" appear today, each "star" being a particular Credit Put Spread for a given ticker. To make this "stellar map" easier to read, you can see the results on my web site https://math-trading.com/scanner-credit-put-spread-etf/, in table form and choose the Credit Put Spread that best suits your needs, depending of course on market conditions, which must always be taken into account. Just for the fun, and because I am a scientist, my code is also showing up like a "Mendeleiev Table" of the best Credit Put Spread, the ones that are in the northeast quadrant of the table. But I'm afraid this is a bit more complicated to read than a table, and to avoid any overload or confusion, I'm only publishing the table on my website. So the "Mendeleev table" is just a scientist's whim 😉 Happy trading!
-
 CLGraham joined the community
 -
 rahulagarwal joined the community
 -
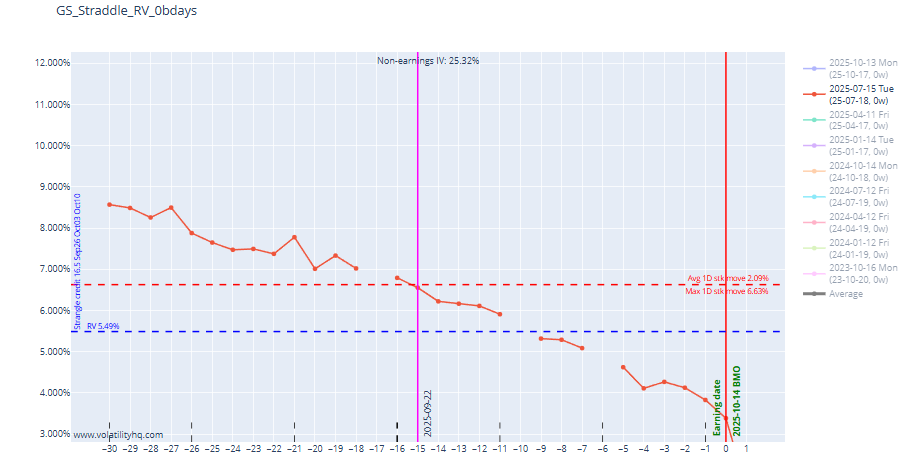
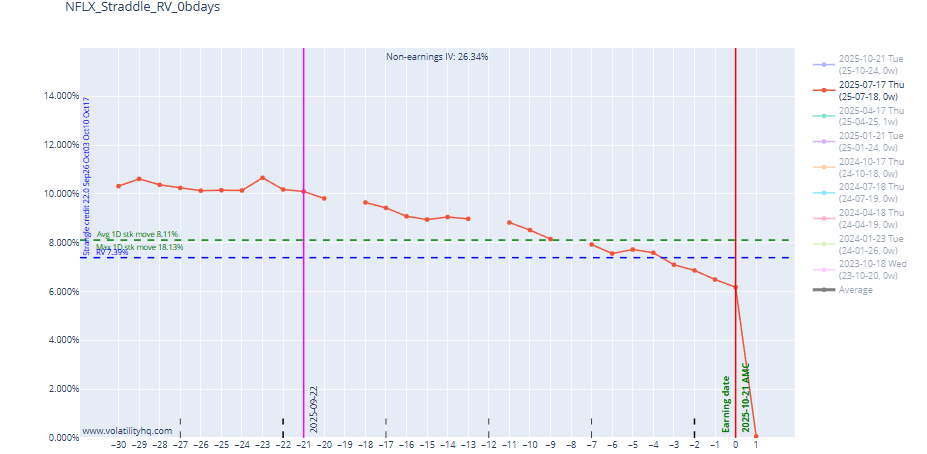
how long before earnings do you measure the data for E.IV (implied volatility of the 1st expiry after the earning date)? we know it starts low and buildup toward the earnings date so a month before will be much lower than a day before ER
-
 Raburn Kaufman changed their profile photo
 -
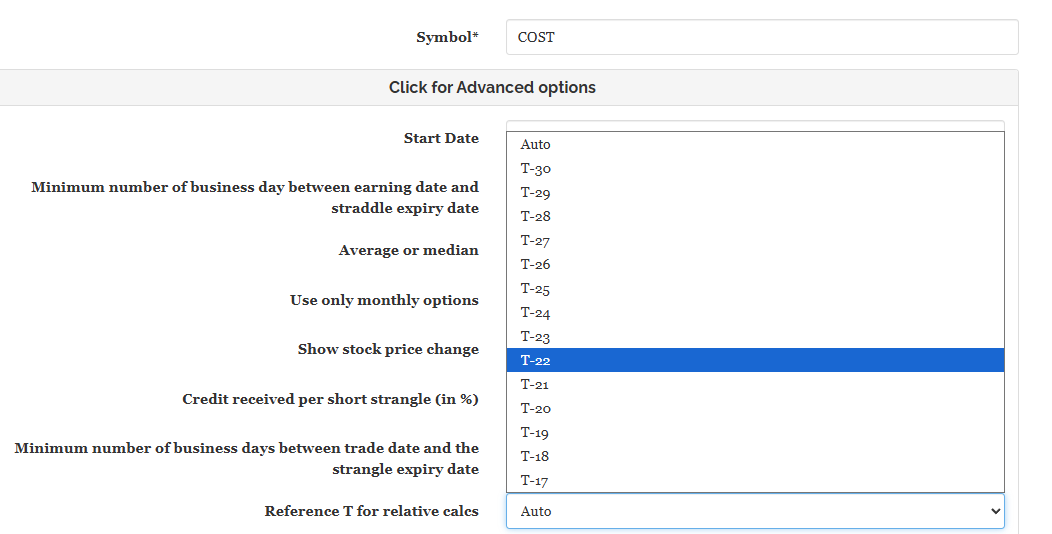
@DjtuxIs it possible to add functionality in the tool to chart multiple tickers RV with each other in same quarters? Also, if "Reference T for relative calcs" be available for all Days, rather than being limited to Current Cycle's past days?

-
I was thinking, can this become our one of the leading indicators of wary times? Also, Options Volume vs Avg. Volume? What do you guys think? I was also pondering the volatilityhq (RV Tool), if we can figure out somehow to reflect, if excessive/larger RV declines in individual tickers were in same quarters? Basically, ability to chart multiple tickers in RV Tool.
-
Hi everyone, I’ve been exploring different ways to refine my trading strategies, and I wanted to open up a discussion here. Most of us on SteadyOptions focus heavily on options, volatility, and disciplined strategies. But I’ve recently been reading about how AI-driven platforms are starting to play a bigger role in markets. One example is QUANTUM AI INDIA, an automated crypto and BTC trading platform. While it’s not directly related to options, I find the concept intriguing—using machine learning and quantum-inspired algorithms to make faster, data-driven decisions. It makes me wonder: could combining traditional options strategies with quantum ai trading signals (even from other markets like crypto) give us an edge? For instance, AI might help identify short-term momentum shifts or volatility spikes that we could translate into better entry/exit points in options trades. At the same time, sticking to a structured framework (like we do here) ensures we don’t fall into the trap of overtrading. I’d love to hear your thoughts: Do you see value in integrating AI-driven insights with established option strategies? Has anyone here experimented with automated platforms alongside traditional approaches? Or do you feel crypto-based AI tools are too far removed from options to be useful? Looking forward to your perspectives. Cheers,
-
Monte-Carlo Simulations, KDE probabilities and options implied probabilitiy are probalistic tools giving the probability to be above or below a given threshold or between two thresholds. So their are not bullish or bearish. The Credit Put Spreads for ETF's scanner, as its name suggests, is a bullish tool.