All Activity
- Past hour
-

Stop Loss and no exit date for TLT in steadyyields
Yowster replied to mangaloreab's topic in General Board
To add to Kim's comment. Steady Yield will use trade allocation sizing to control risk levels. Also, using trade structures where risk is defined and such that the risk is not much higher than the reward (so no trades where $9 is risked to make $1) -

Stop Loss and no exit date for TLT in steadyyields
Kim replied to mangaloreab's topic in General Board
Usually we close those trades 2-3 weeks before expiration to reduce the gamma risk. As for stop loss, I don't believe we have a hard stop loss, but biggest loss was around $2,400. As a side note, strategy specific questions are best to be posted in the strategy topics and not in the general forum. - Today
-
Hi all, Could someone reply to the following please? Whats the exit date for TLT under SteadyYields ? Also what is the stop loss recommended for all trades ? Thanks Mangaloreab
-
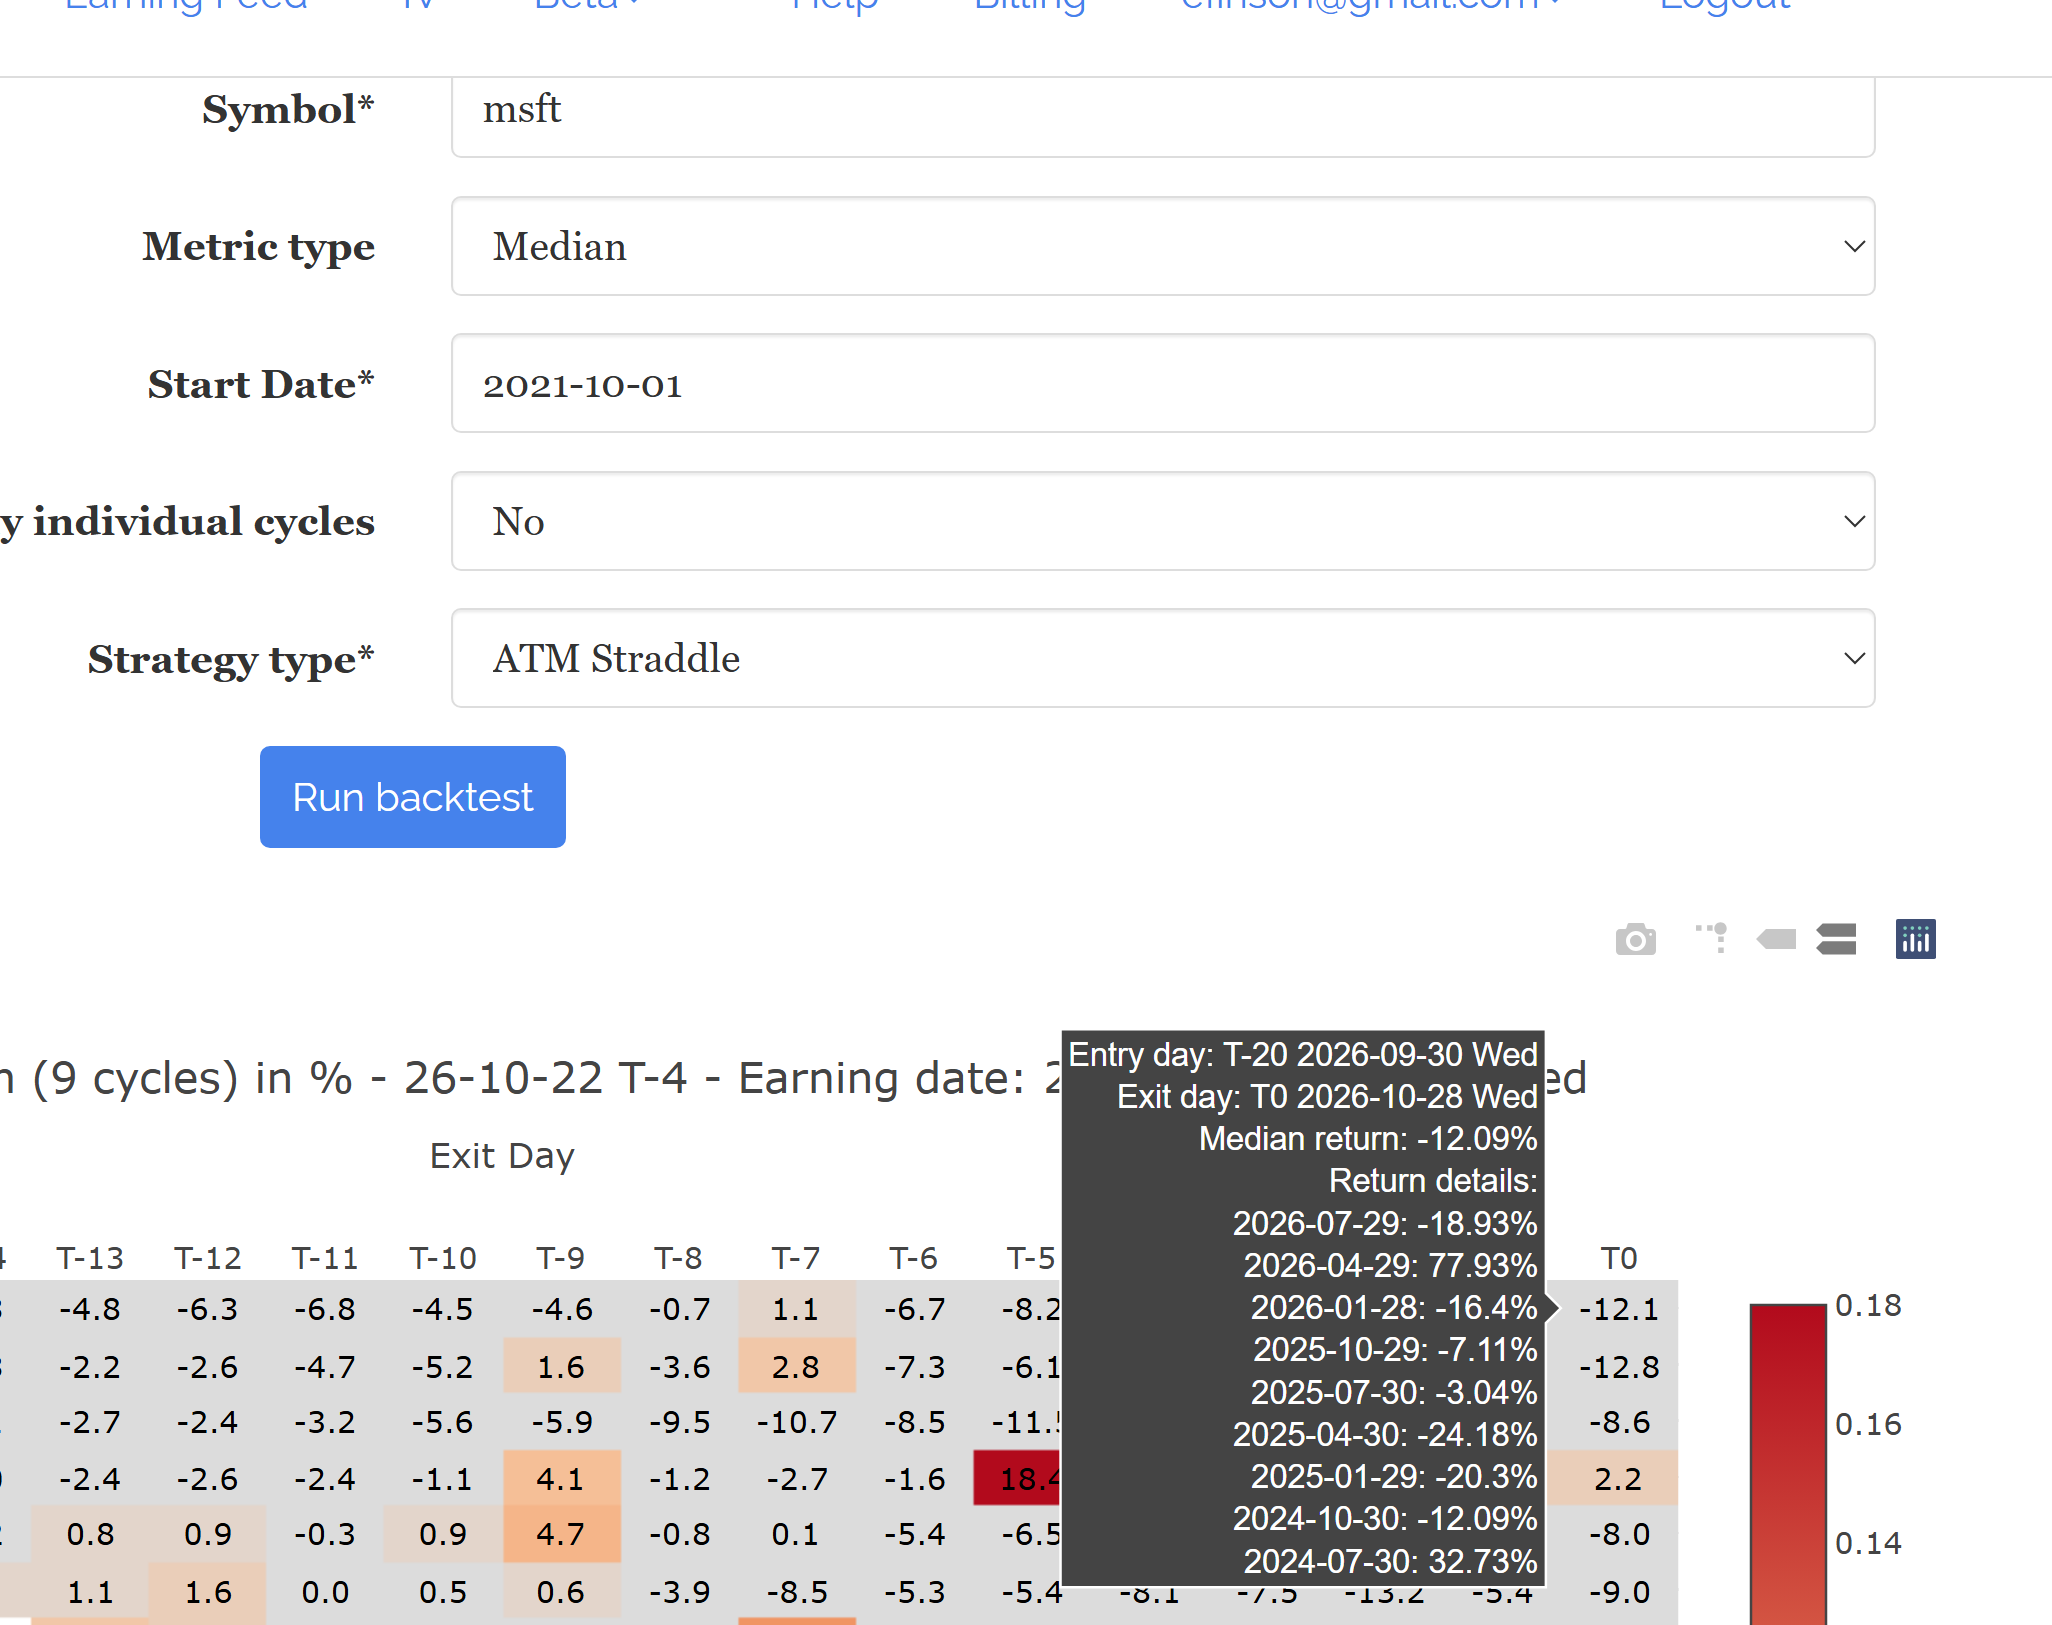
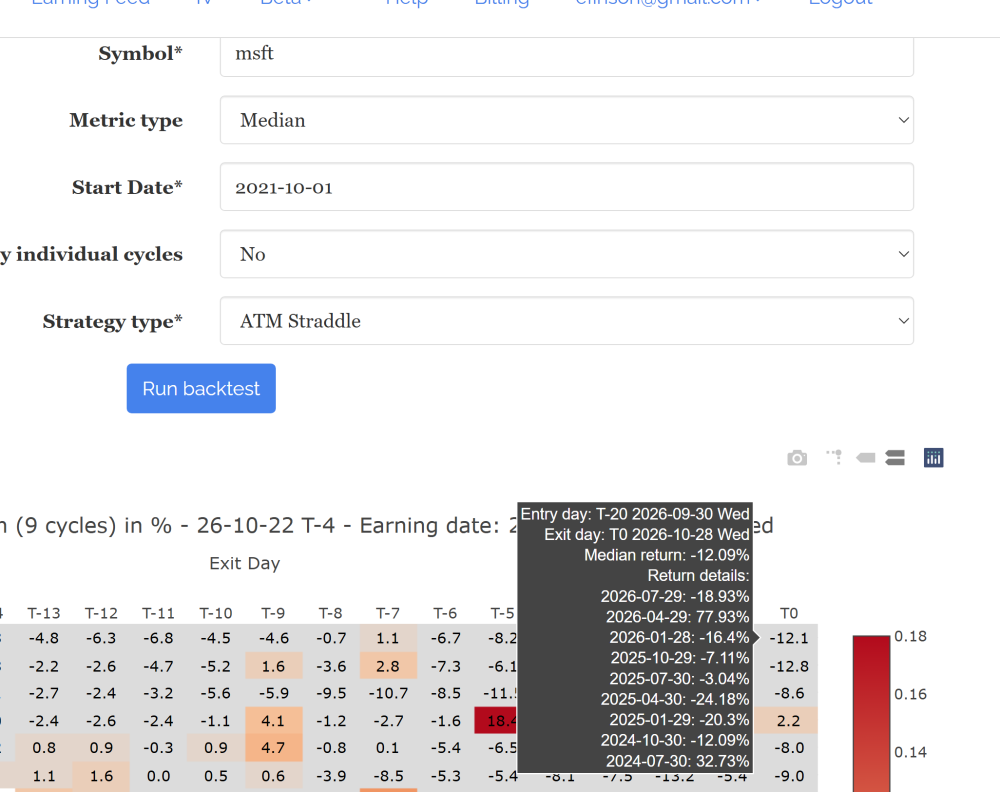
Here is an example for MSFT
-
Do you have an example like which symbol and which strategy type? Also do you change the default start date (normally today minus 2 years so it’s 8 cycles)?
-
Hi, Under the return matrix it sometimes only returns 9 cycles for most tickers even if a longer history is selected. The next day many times it goes back to the selected history. This has happen a few times Thanks
-
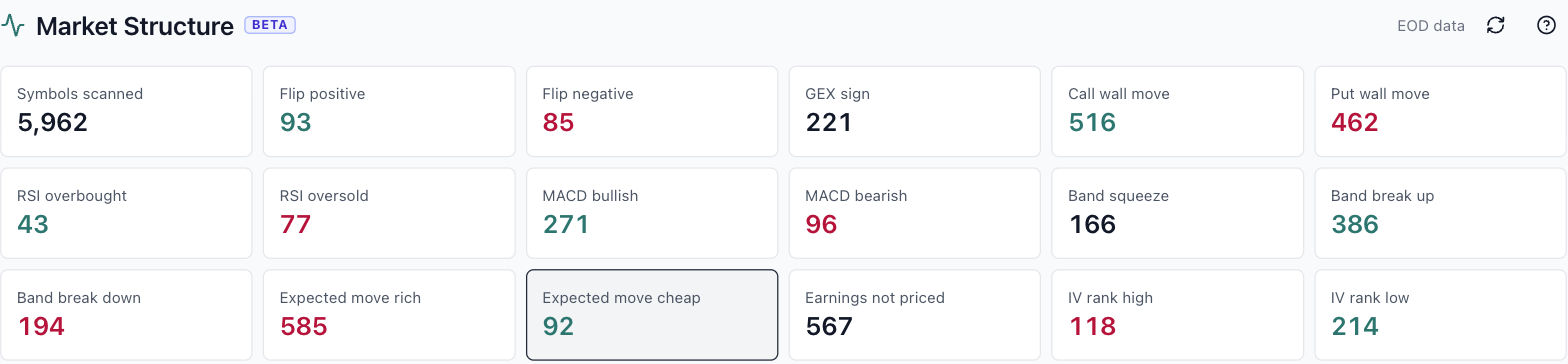
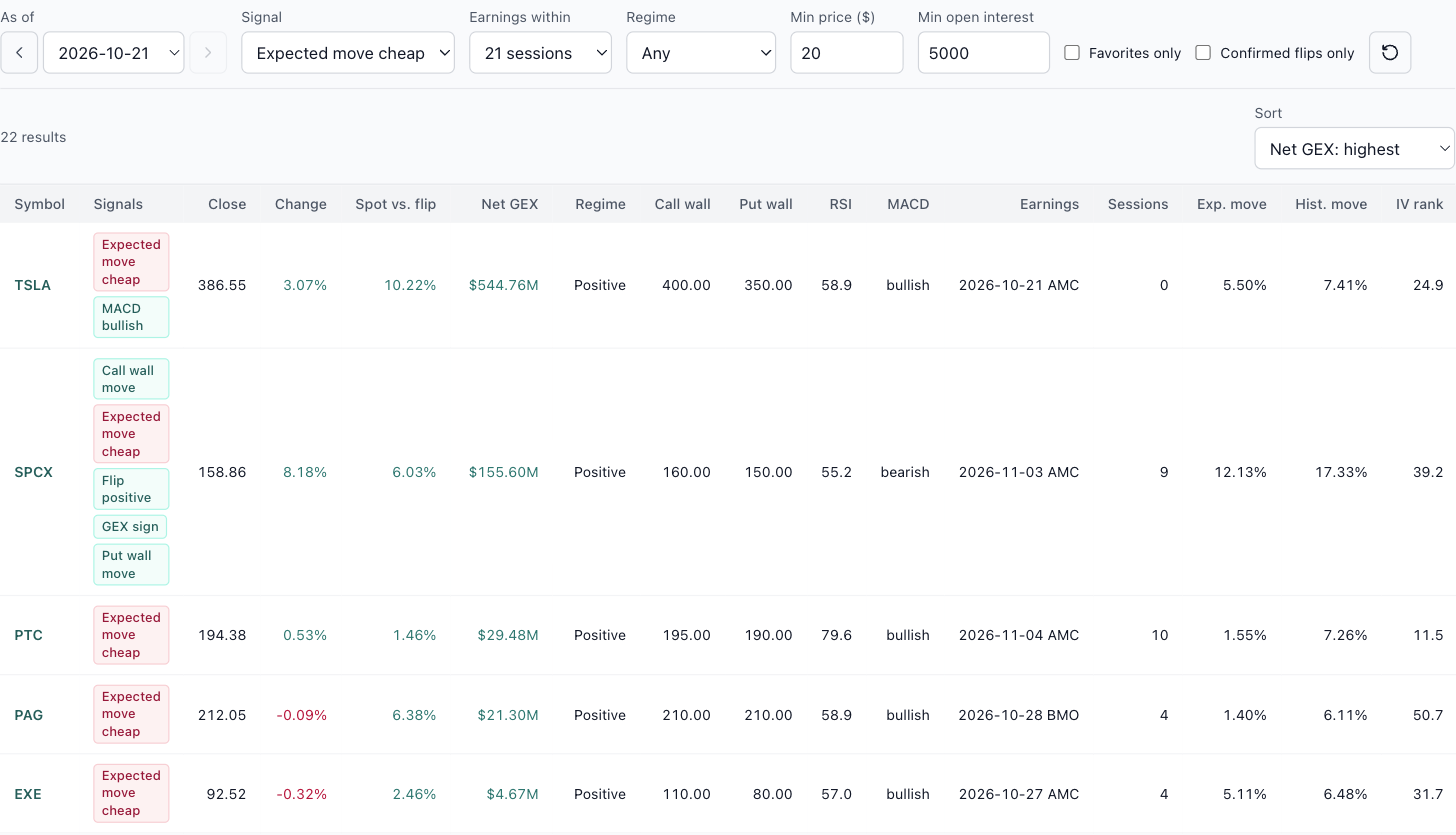
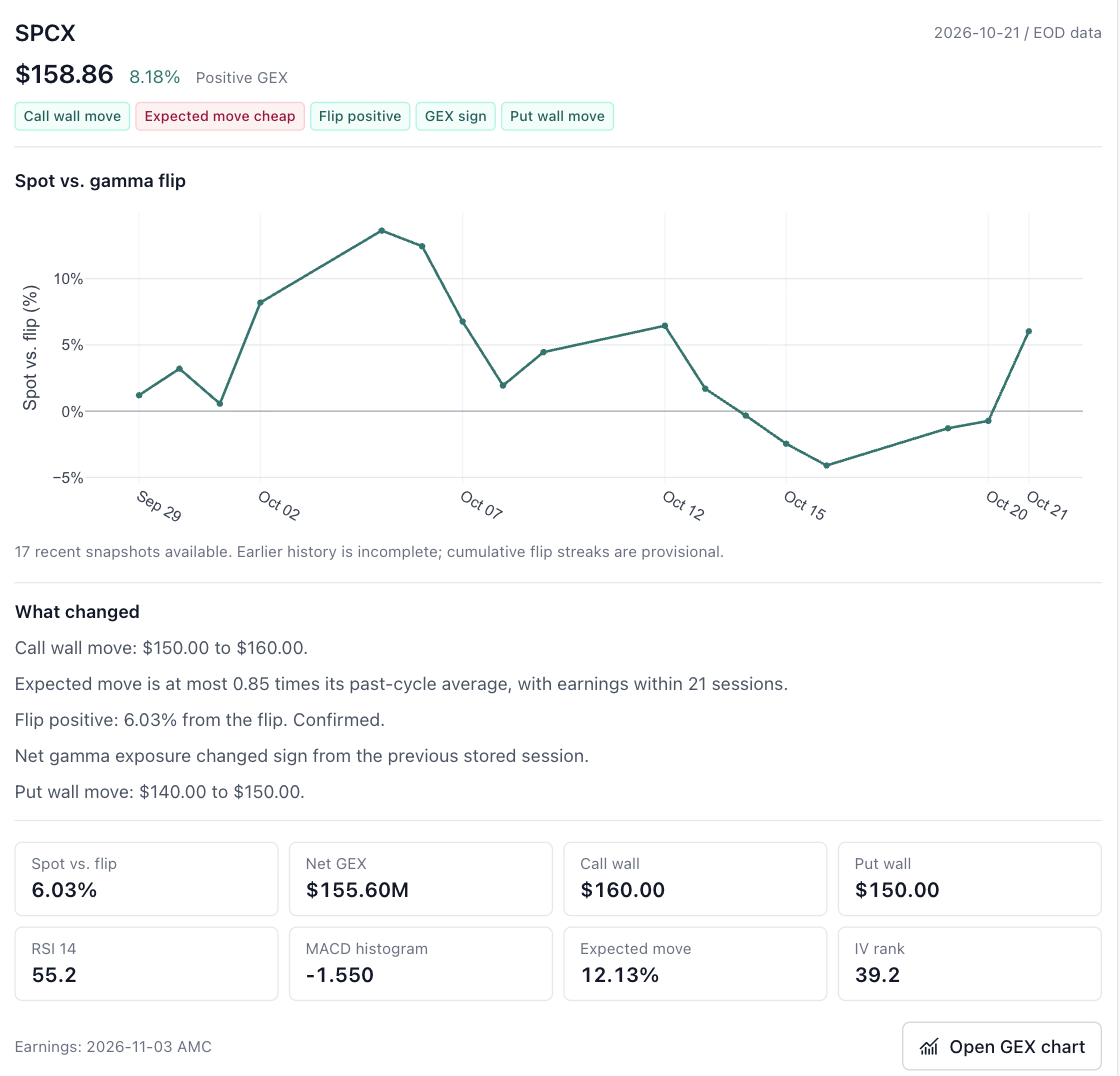
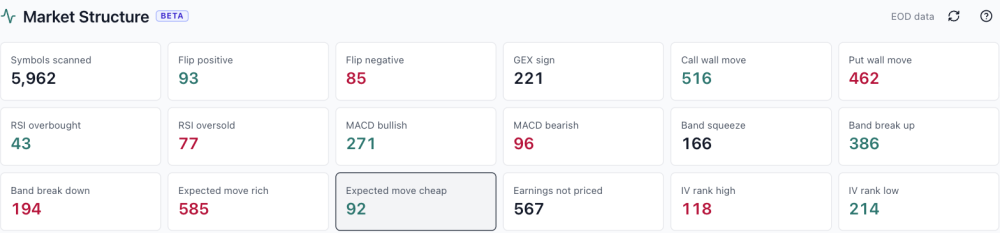
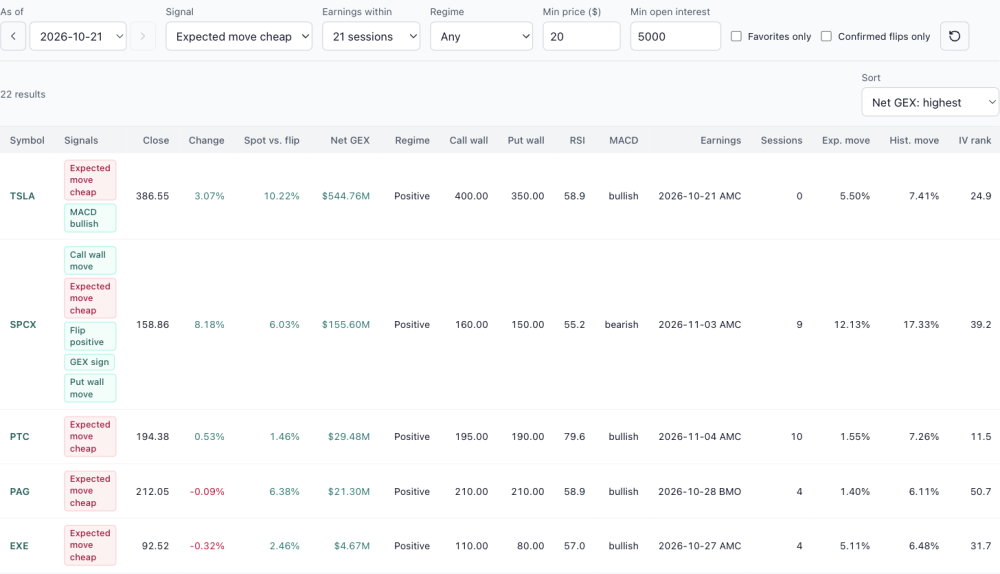
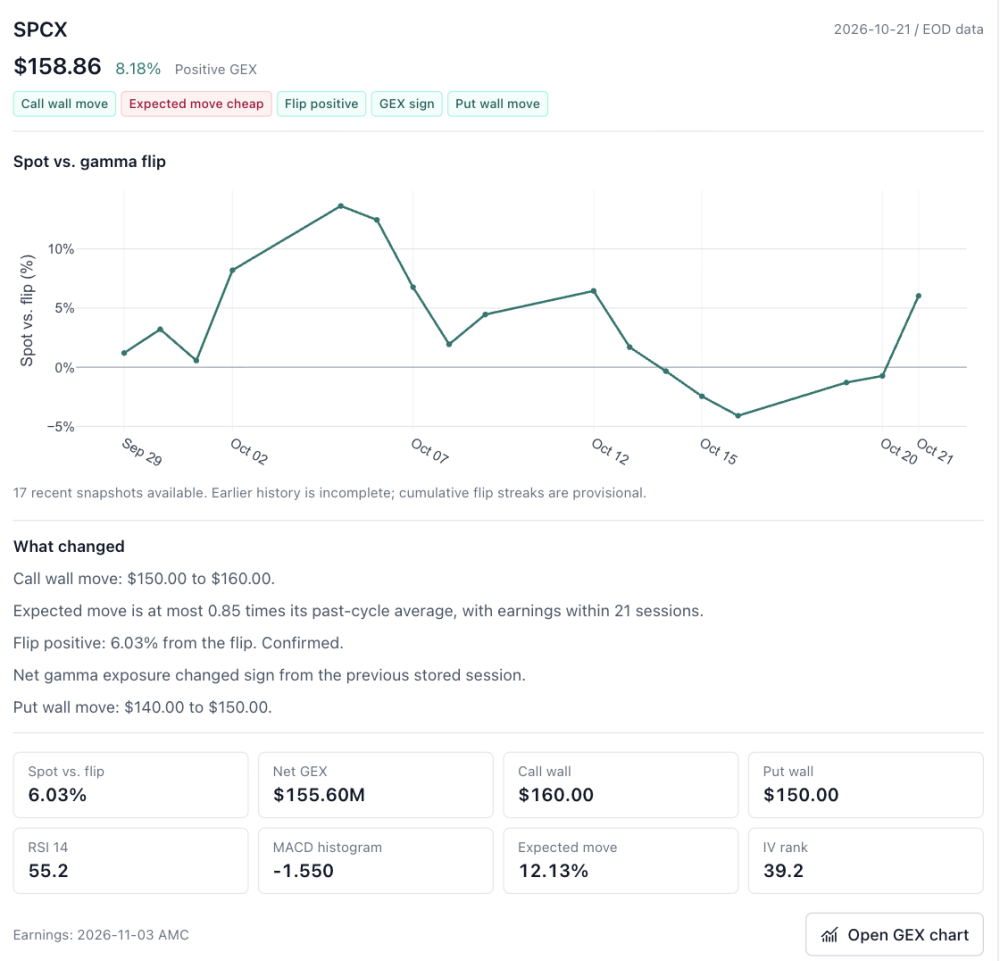
Market Structure is open (Beta) Earlier this week I said Market Structure was coming. It's open now: look for Market Structure in the sidebar, under the Market Structure section. It carries a Beta label because it's the first version. I'll keep improving the page over the coming weeks, and your feedback will shape what changes. What it does. Every evening it scans every optionable stock from EOD data (5,962 symbols on Oct 21) and counts what stood out across 17 signals in three groups: Positioning: net gamma flipping positive or negative, net GEX changing sign, and call wall or put wall moves. Momentum: RSI overbought and oversold, MACD crosses, and Bollinger Band squeezes and breaks. Earnings pricing: expected moves priced richer or cheaper than the stock's own history, reports the options haven't priced in yet, and IV rank high or low. Market Structure (Beta), EOD Oct 21. How to use it. Click any count, or pick a signal from the list. Then narrow it down: earnings within 5 to 120 sessions, positive or negative GEX regime, minimum price, minimum open interest, your favorites only, or confirmed gamma flips only. Sort by net GEX, distance from the flip, nearest earnings, IV rank or RSI. The As of control steps back through recent sessions, so you can see what the scan said on an earlier day. An example. "Expected move cheap" flags stocks whose priced earnings move is at most 0.85 times their past-cycle average, with a report inside 21 sessions. On Oct 21 that was 92 names. Adding a $20 minimum price and 5,000 minimum open interest cut it to 22. Expected move cheap, earnings within 21 sessions, min price $20, min OI 5,000. Read the Exp. move column (what the options price in for the report) against Hist. move (what the stock actually did in past cycles). SPCX, reporting Nov 3, priced 12.13% against a 17.33% history, and on the same night it flipped to positive gamma with both walls moving higher. PAG priced 1.40% against 6.11%. A gap that wide deserves a second look at liquidity before you trust it. Details on any name. Click Details on a row for the stock's distance from the gamma flip over recent sessions, a plain-English list of what changed that night, the key levels, and a link straight to its GEX chart. SPCX details panel, EOD Oct 21. Why Beta. The history behind each stock is still short (about 17 sessions so far), so flip streaks are marked provisional, and signal thresholds may be tuned as the history grows. GEX levels rest on a standard assumption about dealer positioning, since the data carries no trade direction. Treat every flag as a place to start looking, not a signal to trade. Before acting on a name, open its strategy pages and check the RV chart and History Matrix against its own past cycles. If a signal is missing, a filter would help, or something looks off, send it with the Ask button in the top bar. It attaches the page you're on. Educational research only, not trade advice. Model estimates from EOD data; past cycles don't guarantee future results.
-
 Joel bitton joined the community
- Yesterday
-
Thanks for the demonstration, @krisbee. The Earnings Study tool is becoming quite feature-rich. The narration above will be quite helpful, especially to newcomers to SO who haven't had the benefit of being part of the years of forum dialog that have led to the creation of the various SO strategies and the tool itself. The Median return matrix is helpful, but the the "Reached Target" option adds a dimension that I find very useful, since it allows me to examine potential quicker in-out trades with a possibly lower target. I'm also looking forward to using the spread builder/modeler you mentioned. Keep it up.
-
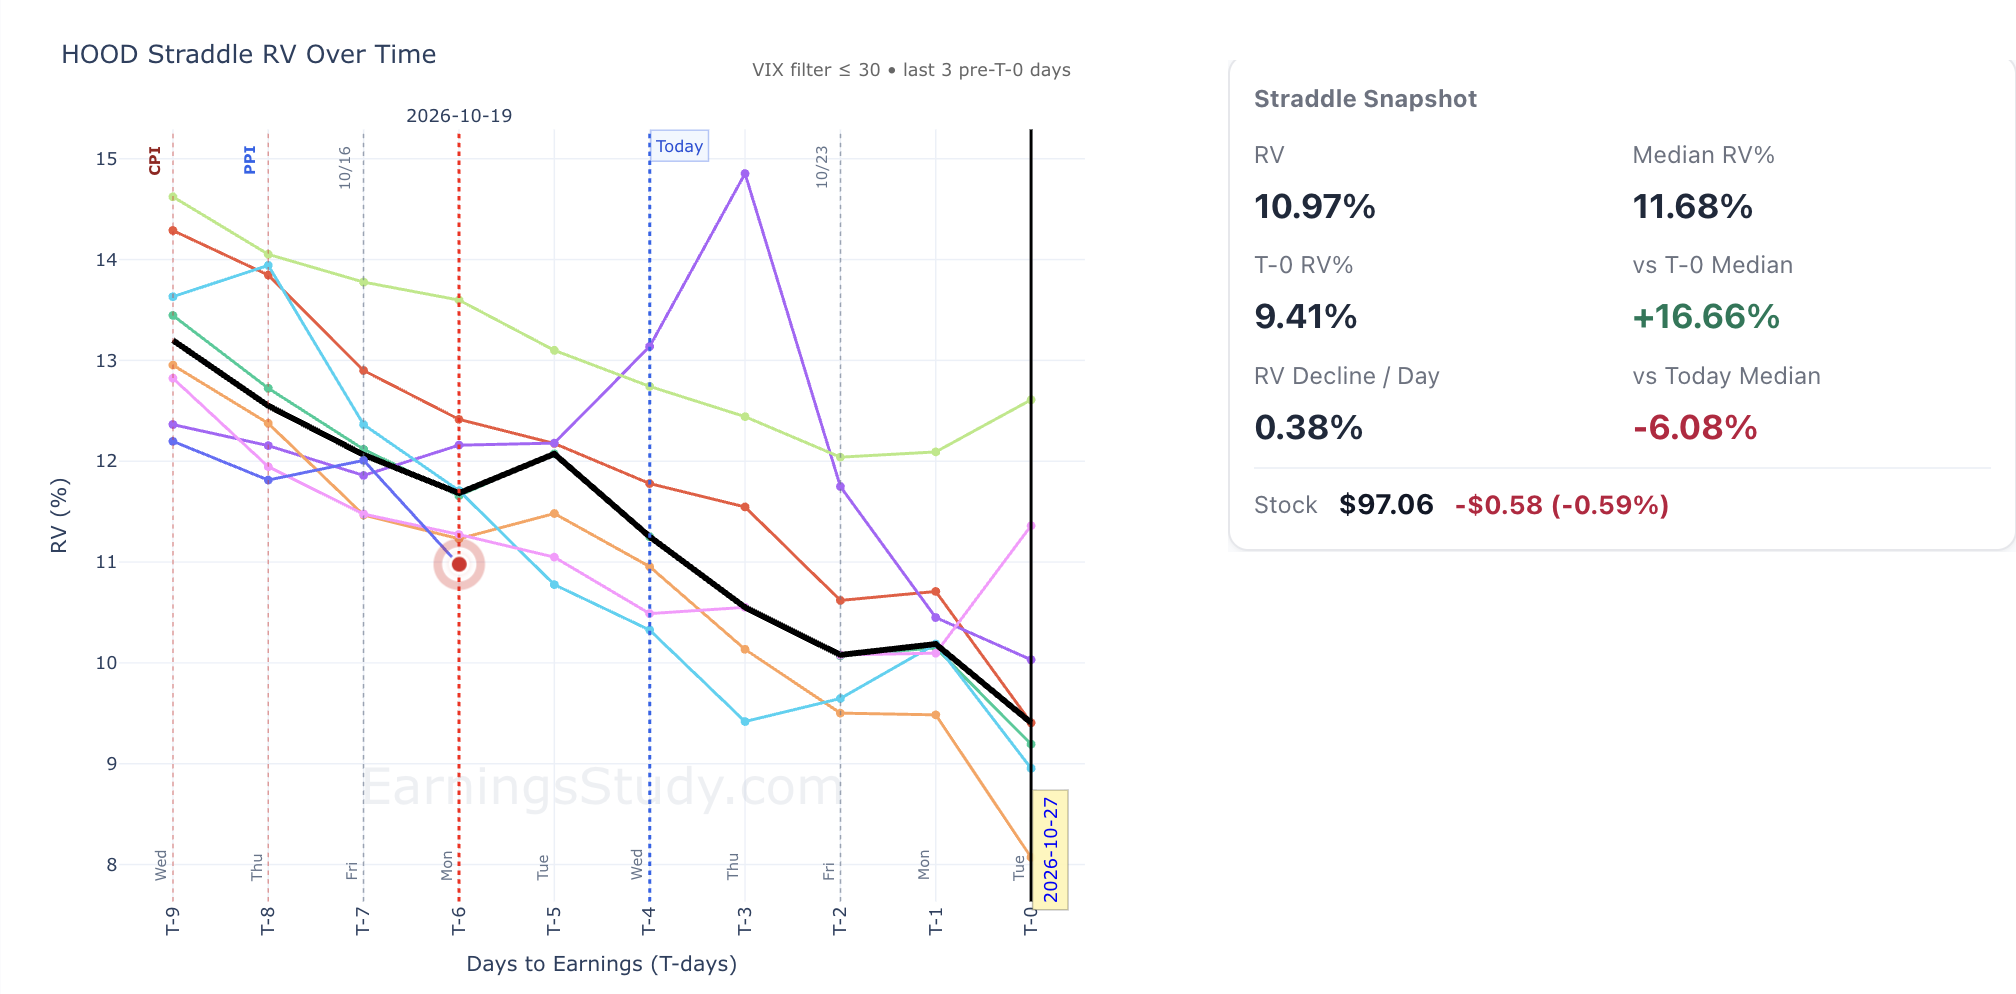
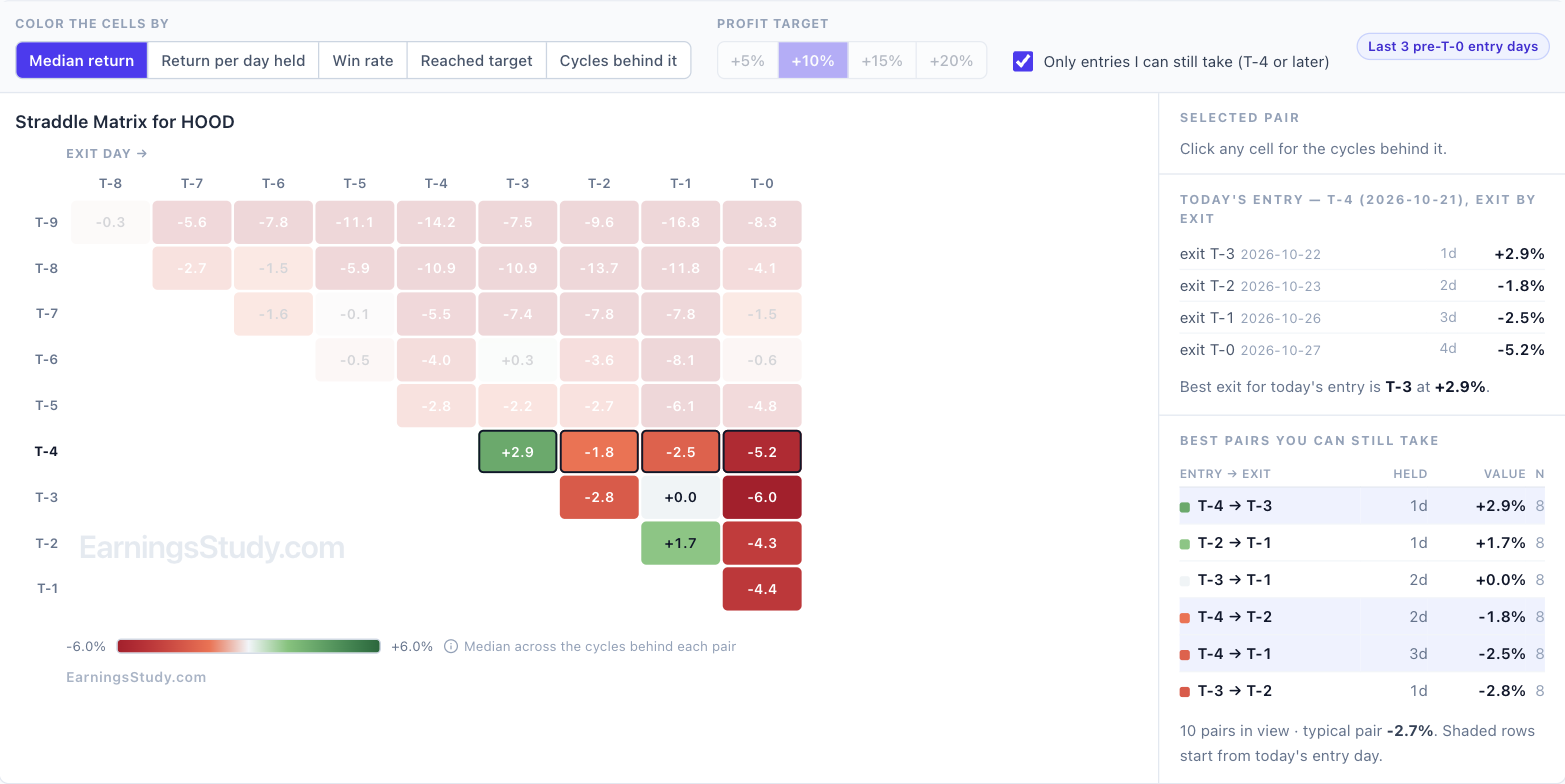
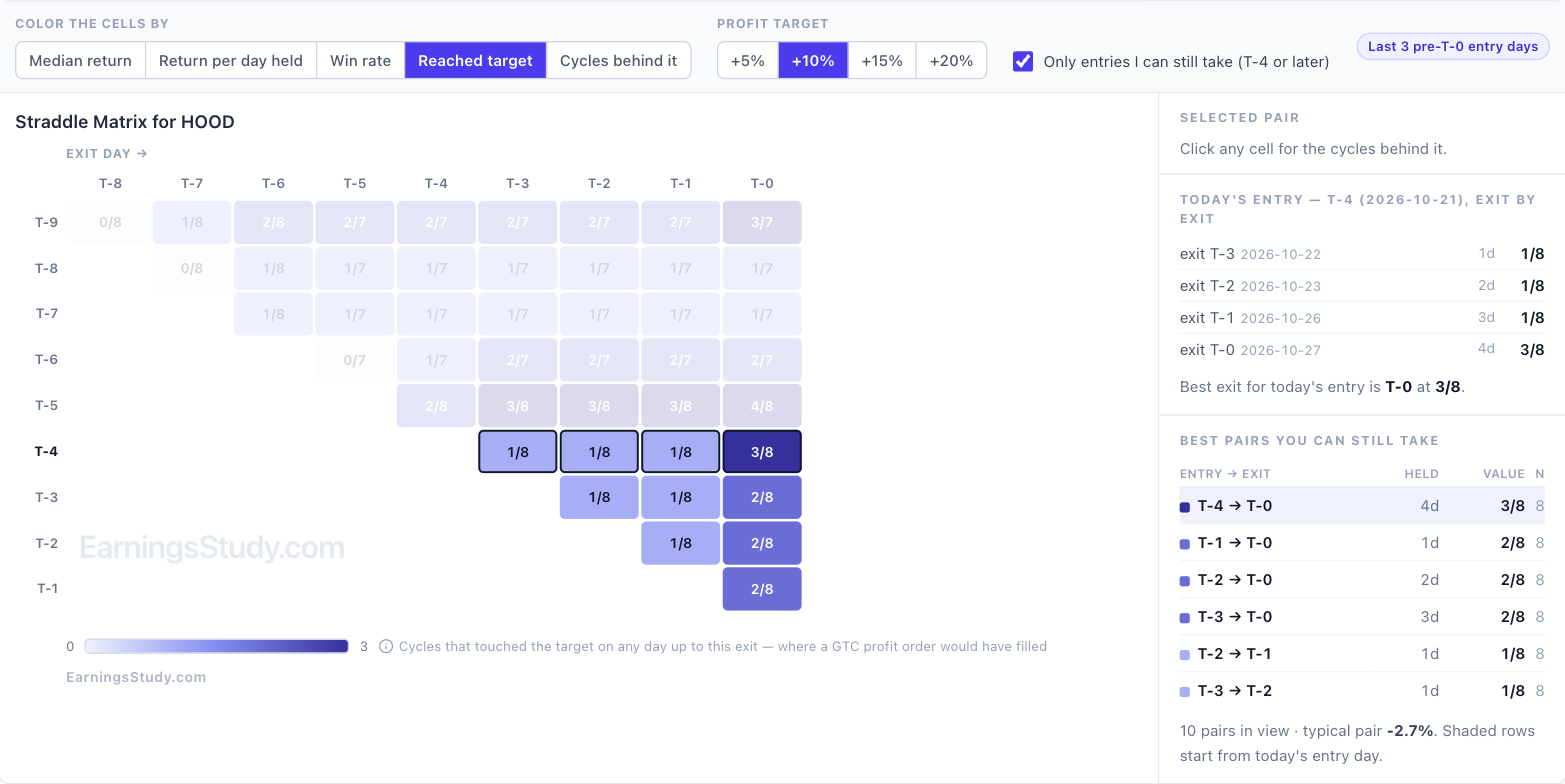
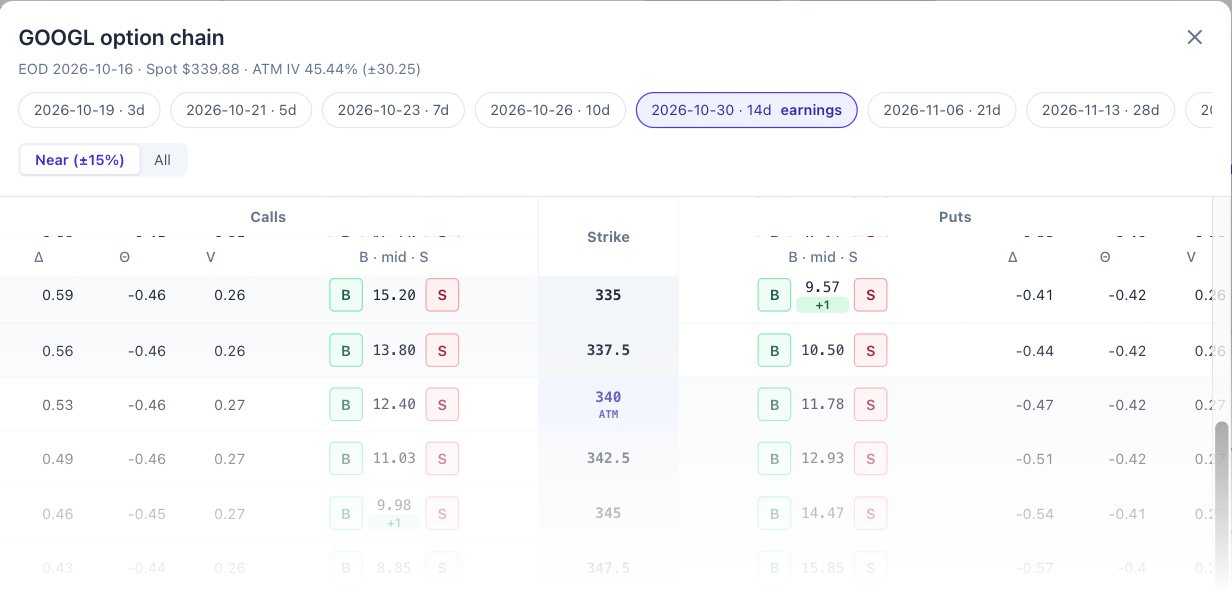
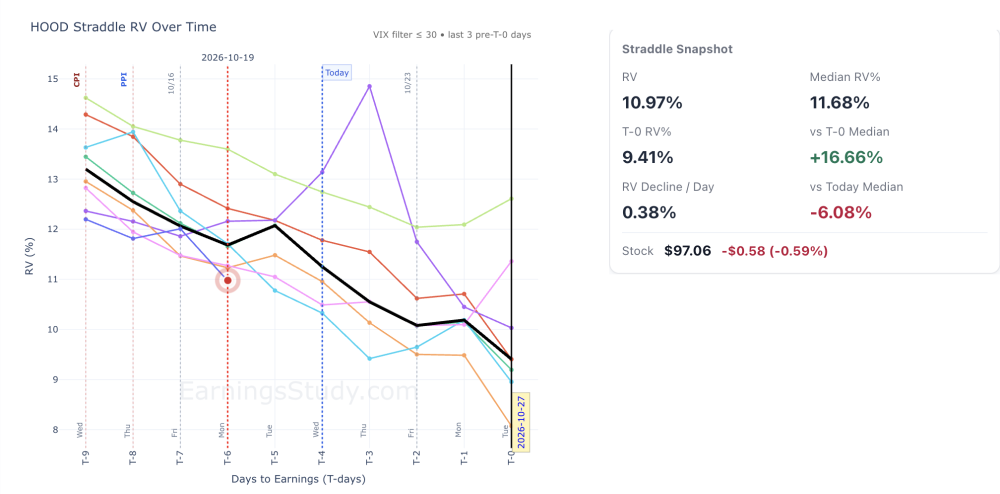
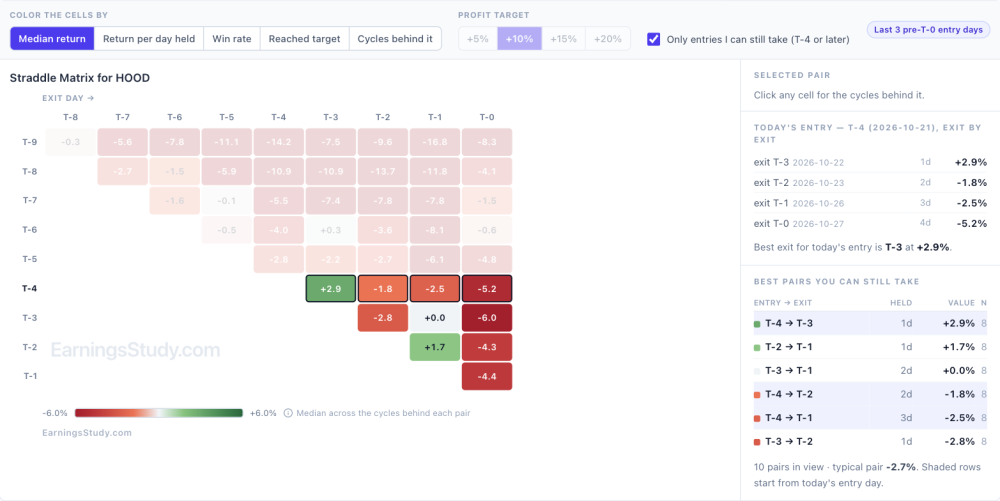
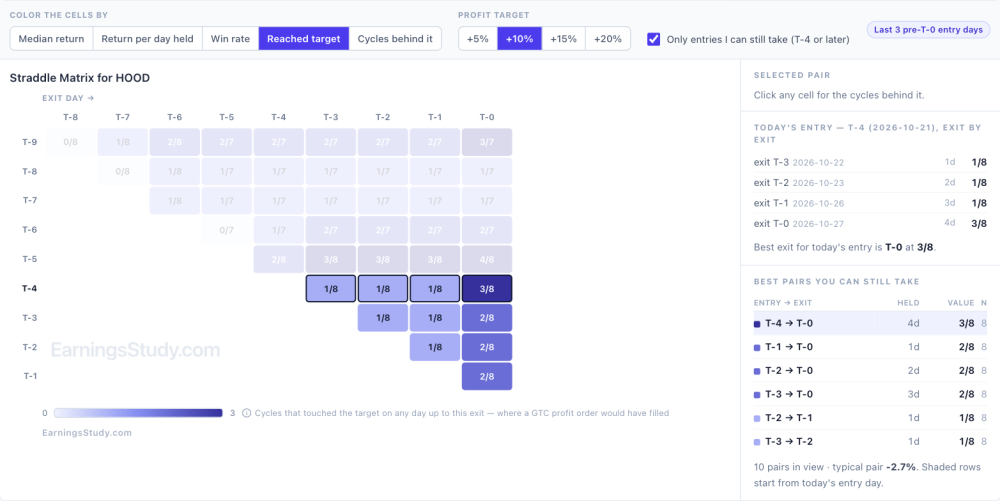
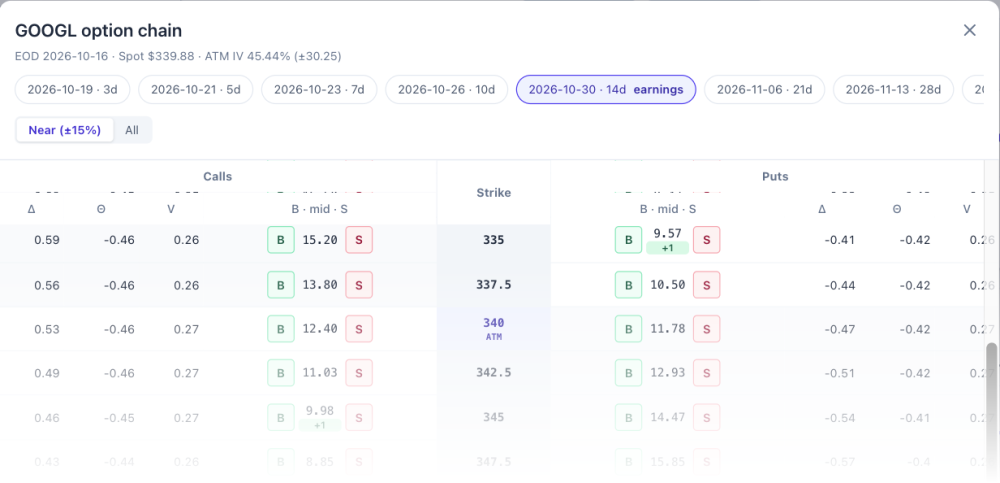
HOOD's straddle looks cheap. Is cheap enough? HOOD reports Tuesday, Oct 27 after the close, and its straddle is priced below its own history. That's where a lot of people stop and buy. It's worth three more minutes, because "cheap" only tells you what you're paying, not what that price has led to. 1. The price. The Straddle RV chart compares the straddle's price, as a percent of the stock price, with the same T-day in past cycles. At the Oct 19 close (T-6) the at-the-money straddle cost $10.65 with the stock at $97.06: an RV of 10.97%, against an 8-cycle median of 11.68% for that day. About 6% cheaper than its own history. HOOD Straddle page, data as of Oct 19 close. Black line is the 8-cycle median. 2. The path. Follow the black median line to the right. It falls to 9.41% by T-0, about 0.38 points a day. If the stock doesn't move and the straddle follows the median, it gives up about a seventh of its value relative to the stock by the report. A 6% discount doesn't cover that. 3. What entering here actually returned. Scroll down the same page to the History Matrix. Each cell is the median return of entering on one day (rows) and exiting on another (columns), across the same 8 cycles. For HOOD, almost every cell is red. Of the 10 entry and exit pairs still available from T-4 on, the typical one returned −2.7%. Only two were positive: in at T-4 and out the next day (+2.9%), and in at T-2, out at T-1 (+1.7%). Holding to T-0 lost a median 5.2% from a T-4 entry and 6.0% from T-3. HOOD Straddle History Matrix, median return per entry and exit day, 8 cycles. 4. How often it paid along the way. Switch the matrix to Reached target. From a T-4 entry, 5 of 8 cycles touched +5% at some point before T-0, but only 1 of 8 touched +10% in the first three days and 3 of 8 by T-0. From a T-3 entry, 2 of 8 reached +10%. In plain terms: small gains showed up in some cycles, rarely grew, and mostly didn't last to the report. Same matrix colored by Reached target, +10%. Put together: the price is a little below history, the median path still bleeds into the report, and the trade history from here is mostly negative with few cycles reaching a meaningful target. A cheap straddle on a stock whose straddle usually decays is still a straddle that needs a move. If you take it anyway, the matrix says it has been a quick-profit trade, not a hold-to-the-report trade. To run the same check on any name: open the Straddle page, read the snapshot beside the RV chart, then scroll to the History Matrix, choose Beta, and color the cells by Median return and then by Reached target. The Market Structure scan I mentioned as coming soon will flag cheap and rich names across every symbol; these three views are how you decide whether one of them is worth taking. One more thing. Tomorrow I'm opening a new page I've been testing with the contributors: build a multi-leg position from the option chain and see its P/L before you place it, with the stock's own earnings history built into the volatility. Here's a corner of it. Teaser. Full reveal Friday. Educational research only, not trade advice. Past cycles don't guarantee future results.
-
 mangaloreab joined the community
- Last week
-

The Last 14 Minutes: Why We Stopped Looking at Options Closing Prices
mccoyb53 commented on krisbee's article in SteadyOptions Trading Blog
Yes. @krisbee. That makes sense and it is intuitive as well. Thanks for your reply. -
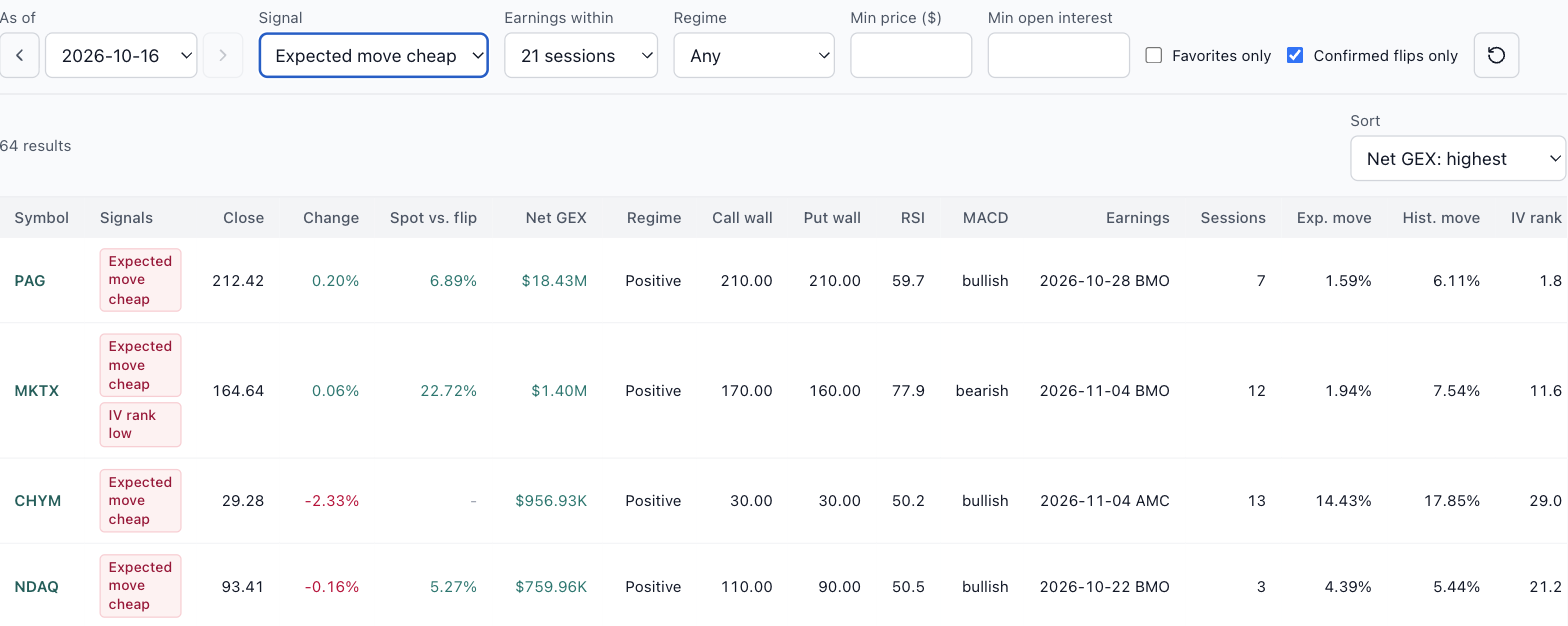
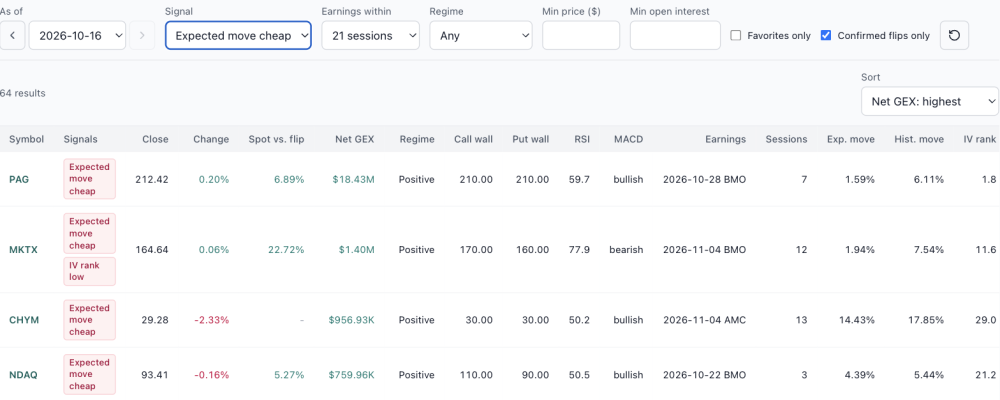
Coming soon: Market Structure, a nightly scan of every optionable stock The GEX page answers questions about one symbol at a time. The next release, Market Structure, asks the same questions of every optionable stock at once, every evening, from EOD data. It isn't open yet, but it's far enough along that I want to show you what it does and hear what you'd want from it. On Oct 16's data it scanned 5,991 symbols and counted what stood out, in three groups: Positioning: stocks whose net gamma flipped positive or negative, plus call wall and put wall moves. Momentum: RSI overbought and oversold, MACD crosses, and Bollinger Band squeezes and breaks. Earnings pricing: expected moves priced richer or cheaper than the stock's own history, reports the options haven't priced in yet, and IV rank high or low. Market Structure preview, EOD Oct 16. Each count opens the list behind it. Here's the one I expect earnings traders to use most: expected move cheap, for stocks reporting within the next 21 sessions. It found 64. Compare the Exp. move column (what the options price in for the report) with Hist. move (what the stock actually did in past cycles). NDAQ, reporting Oct 22, priced 4.39% against a 5.44% history. CHYM priced 14.43% against 17.85%. These are examples, not picks. Expected move cheap, earnings within 21 sessions, EOD Oct 16. A scan like this needs judgment as well as signals. PAG shows 1.59% priced against 6.11% historical. A gap that large usually means thin options rather than a bargain, which is why the list has minimum price and open interest filters, and why you'd still check the spread cost on the Summary page before believing it. I'm finishing it now and will post here when it opens. If there's a signal you'd want in the scan, send it through the Ask button in the top bar while it's still easy to add. Educational research only, not trade advice.

-

What the Gamma Map Said Before Nine Bullish Combos
krisbee posted a article in SteadyOptions Trading Blog
 @Yowster laid out the full method in the forum, and the results since then are on the SteadyOptions performance page: nine closed bullish combos, seven winners, and nearly every winner closed at its roughly 10% target. The two losses were AMD at −2.1% and JPM at −14.5%. Figure 1. The nine bullish combos on the SteadyOptions performance page (highlighted), September 18 through October 15. Source: steadyoptions.com/performance. @yowster's write-up uses three EarningsStudy screens to build each trade. The last of them, the GEX page, is the one I want to look at closely here. It has an As Of slider that replays the page on any past date, so we can ask a simple question of every trade: what did the gamma map show on the evening before entry? And did that picture help, mislead, or not matter? Three screens, three questions The method in @yowster's post answers three questions in order, and each one lives on a different screen. Has this setup worked on this stock before? The Daily Screener answers it with an exit rule and a hit count. Set the rule to take profit at +15%, and each cell shows how many prior cycles hit that target from that entry day. The GOOGL example showed 7 of 7, and the same screen on October 19 still shows 7 of 7 on the long-call rows. Figure 2. The Daily Screener for GOOGL with the exit rule set to take profit at +15%, filtered to Call Debit Spread and LongOption. Each cell shows how many prior cycles reached +15% from that entry day. Captured October 19, 2026 (T-7 before the October 28 report). Is the move the trade needs a normal one? The Long Stock Trend chart shows the stock's path into the report for every prior cycle, with the median drawn in black and the macro calendar (CPI, PPI, FOMC) marked on the axis. If the combo needs a 4% rise, you can see at a glance whether that is routine for this name or a stretch. Figure 3. The Long Stock Trend chart for GOOGL. Each colored line is one prior cycle measured from T-8; the black line is the median path; macro events are flagged along the top. How is the trade built? @yowster construction, in brief: a call debit spread with the long strike at or slightly above the money, plus a narrower put debit spread with the long strike a little below the money, roughly two-thirds the width of the call side. All legs use the earnings-week expiration and the trade closes before the report. He keeps the total cost below the width of the put spread, targets about 10%, and expects most losses to stay under 10%. For his GOOGL example, the P&L chart showed that a rise of a little under 4% would reach the 10% target, which is exactly what the trend chart above lets you check. Figure 4. Yowster's GOOGL bullish combo as published in his forum post: +1 335 put / −1 325 put / +1 345 call / −1 360 call, October 30 expiration, $8.70 debit. Reproduced with Yowster's permission. What does the options market's positioning look like right now? That is the GEX page, and it is the subject of the rest of this article. What the GEX page measures Market makers who sell options hedge them with stock, and how they hedge depends on their gamma. Net GEX adds up that gamma exposure across the whole option chain, in dollars per 1% move in the stock. When net GEX is positive, the usual reading is that dealer hedging leans against the move: they buy dips and sell rips. Price tends to be stickier and pullbacks shallower. When net GEX is negative, hedging tends to push in the same direction as the move, so moves extend whichever way they start. The page labels the two regimes "Positive gamma" and "Negative gamma." It also marks the gamma flip, the price where the regime changes, and the call and put walls, the strikes carrying the most call-side and put-side gamma. We read the Net GEX label as a quick sentiment check. Since the combo's main risk is a drop, a backdrop where dips tend to get cushioned is the one you want. Three caveats matter, and the page states them. The data is end-of-day. Open interest reflects positions as of the prior close. And the sign of each contract's gamma is a model assumption about who is short what, because the data carries no trade direction. The page describes the terrain. It does not forecast. Nine trades, replayed For each combo I set the As Of slider to the last close before the entry date, which is what a trader would have had in hand the night before. Here is what the page showed. Figure 5. Each SteadyOptions bullish combo with the GEX page reading from the session before entry. Trade results from the SteadyOptions performance page. Six of the nine trades were entered in positive gamma. Five of those won, and the one loss was AMD's −2.1%. Three were entered in negative gamma. Two of those won, and the third was the biggest loss of the run, JPM's −14.5%. Averaged per trade, the positive-gamma entries returned +8.2% and the negative-gamma entries +1.5%. Two things stand out. Negative gamma is not the same as bearish. BA and UNH both entered with the stock below the flip, and both made 9–10% within a few days. BA had an RSI of 27.7, it sat right on its 185 put wall, and it bounced hard. Negative gamma amplifies moves in both directions, which is exactly why the outcomes there were so spread out. Two clean wins and one deep loss is what a wider distribution looks like. A positive headline can hide a weak floor. AMD was entered in positive gamma and still lost. That case deserves a closer look. AMD: the cushion was lower than the headline (Screenshots from EarningsStudy) Figure 6. AMD as of October 12. The headline reads positive gamma, but spot had slipped below the 600 put wall and the per-strike bars directly under it are red. The What Changed panel shows the regime four sessions later. On October 12, AMD's headline read +$147.5M, positive gamma, with spot 5% above the flip. But the per-strike profile on the right tells a more detailed story. The positive gamma sat above the stock, around the 620 call wall. The strikes below spot were negative, and spot at 593 had already slipped under the 600 put wall. The positive total came from above the price; underneath it, there was no cushion. The What Changed panel shows how that played out. By October 16, spot had fallen almost $65 and net GEX had swung by −$197M into negative territory. The combo was already closed by then, at −2.1%, because the put spread hedge did its job. As a lesson in reading the page, AMD says to look past the headline sign: check where the stock sits relative to the put wall, and whether the bars directly underneath it are green or red. JPM: below the flip and below the wall (Screenshots from EarningsStudy) Figure 7. JPM as of September 23. Negative gamma, spot sitting on the flip and below the 340 put wall, every per-strike bar beneath the stock red, MACD below its signal line for 27 sessions, and price 4.4% under its 50-day average. All three negative-gamma entries had the stock below the flip. JPM was the only one where it had also broken below its put wall. Net GEX was −$13.6M with spot on the flip line itself, the per-strike bars underneath were all red, and the MACD had been below its signal line for 27 sessions. BA and UNH, by contrast, were each sitting just above their put walls when they bounced. JPM was also held 13 days, the longest of the nine; none of the others ran past four. Steady Options contributor’s own notes flag that risk: losses grow when a trade stays open a long time and RV bleeds out. None of this means the page "called" JPM. Three trades can't establish a pattern, and BA and UNH won from the same regime. What JPM shows is what a weak floor looks like on this page: no positive gamma underneath the stock and no wall holding it. When you see that, it's reasonable for position size or entry timing to reflect it. MSFT: what a clean backdrop looks like (Screenshots from EarningsStudy) Figure 8. MSFT as of October 8: +$1.91B net GEX, spot 22.6% above the flip, holding just above the 520 put wall with mostly green bars underneath, MACD above signal for seven sessions. For contrast, MSFT on October 8 showed the textbook picture: a large positive net GEX, the flip far below at 426, spot sitting just above its put wall with mostly green bars stacked underneath, and momentum confirming. The combo hit its target in four days. How to use this, and what it can't tell you Nine trades is an anecdote. This is not a backtest. It is a replay with hindsight, and two of the three negative-gamma trades won. What the replay supports is narrower and more useful than a filter: the GEX page tells you what kind of ground you are standing on. In positive gamma, losses in this run stayed small. In negative gamma, the outcomes spread out in both directions. If you want to add it to the bullish-combo checklist, here is the order I'd use, following method: History first. On the Daily Screener, check the hit rate for your exit rule at your entry day. Reachability. On the Long Stock Trend chart, check whether the move your P&L chart needs is a normal one for this stock. Backdrop last. On the GEX page, read the regime, then the distance from spot to the flip, then where spot sits relative to the put wall and whether the bars just under it are green or red. Use the As Of slider and the What Changed panel to compare with a few sessions earlier. As AMD showed, a regime can change within days, and a weakening trend reads differently from one that has held steady for weeks. The point of putting these on one platform is that each answers a different question, and none of them is enough alone. A strong hit rate with negative gamma under the stock is a different trade from the same hit rate with a green cushion beneath it. The combo structure Yowster built already limits the damage when the stock drops. These screens help you see when that protection is likely to be tested. Credit where it's due: the bullish combo, its strike rules and its use of these screens are Yowster's work; his GOOGL P&L chart is reproduced with his permission. His original post is in the SteadyOptions forum under "Earnings Bullish Combo Trade Strategy." All trade results are from the SteadyOptions performance page. SO members on the All-services bundle: full core access to EarningsStudy is free through the partnership. Sign in at earningsstudy.com with your SteadyOptions email. EarningsStudy provides educational research and market information only, not investment, financial or trading advice. GEX values are model estimates from end-of-day data, and dealer positioning is inferred, not observed. Options trading involves substantial risk. Past results do not guarantee future results.
-
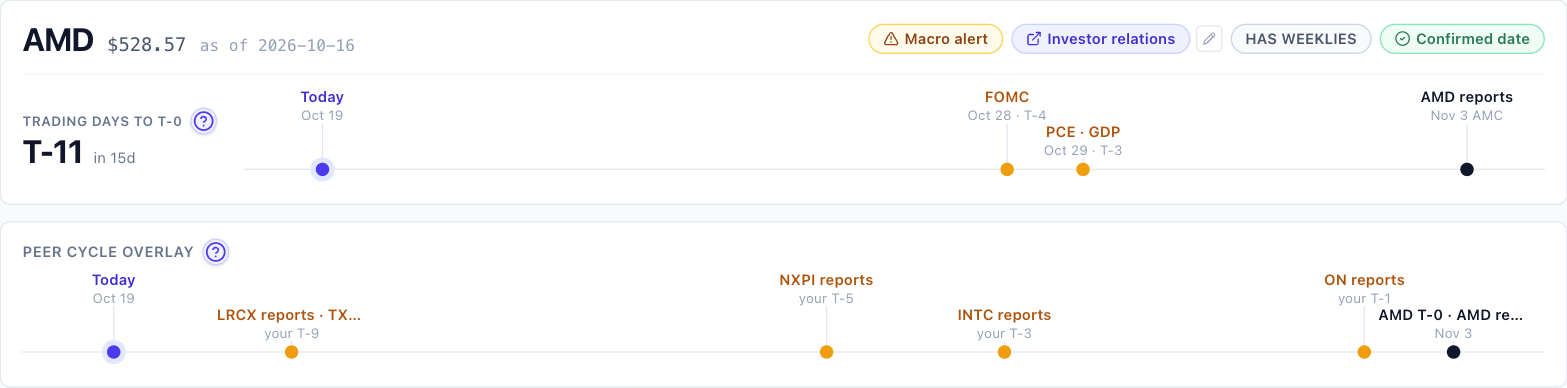
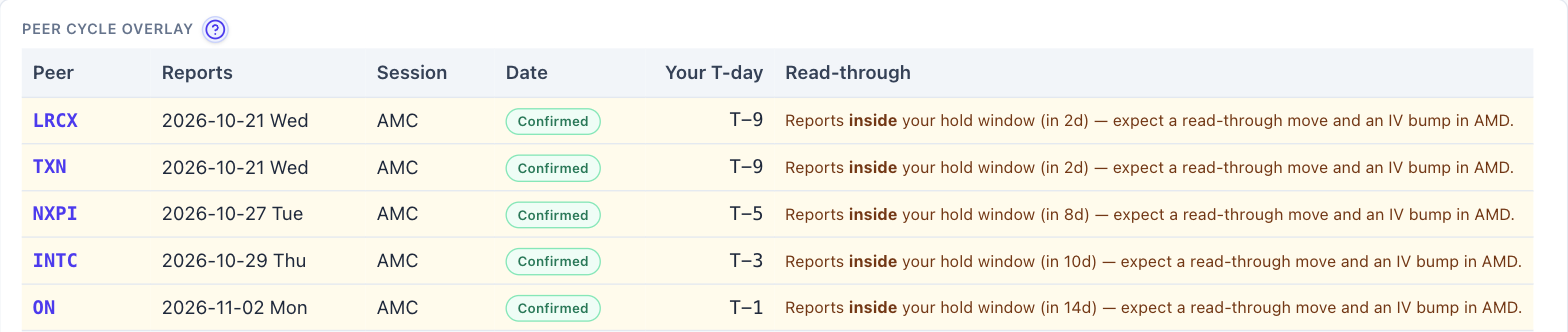
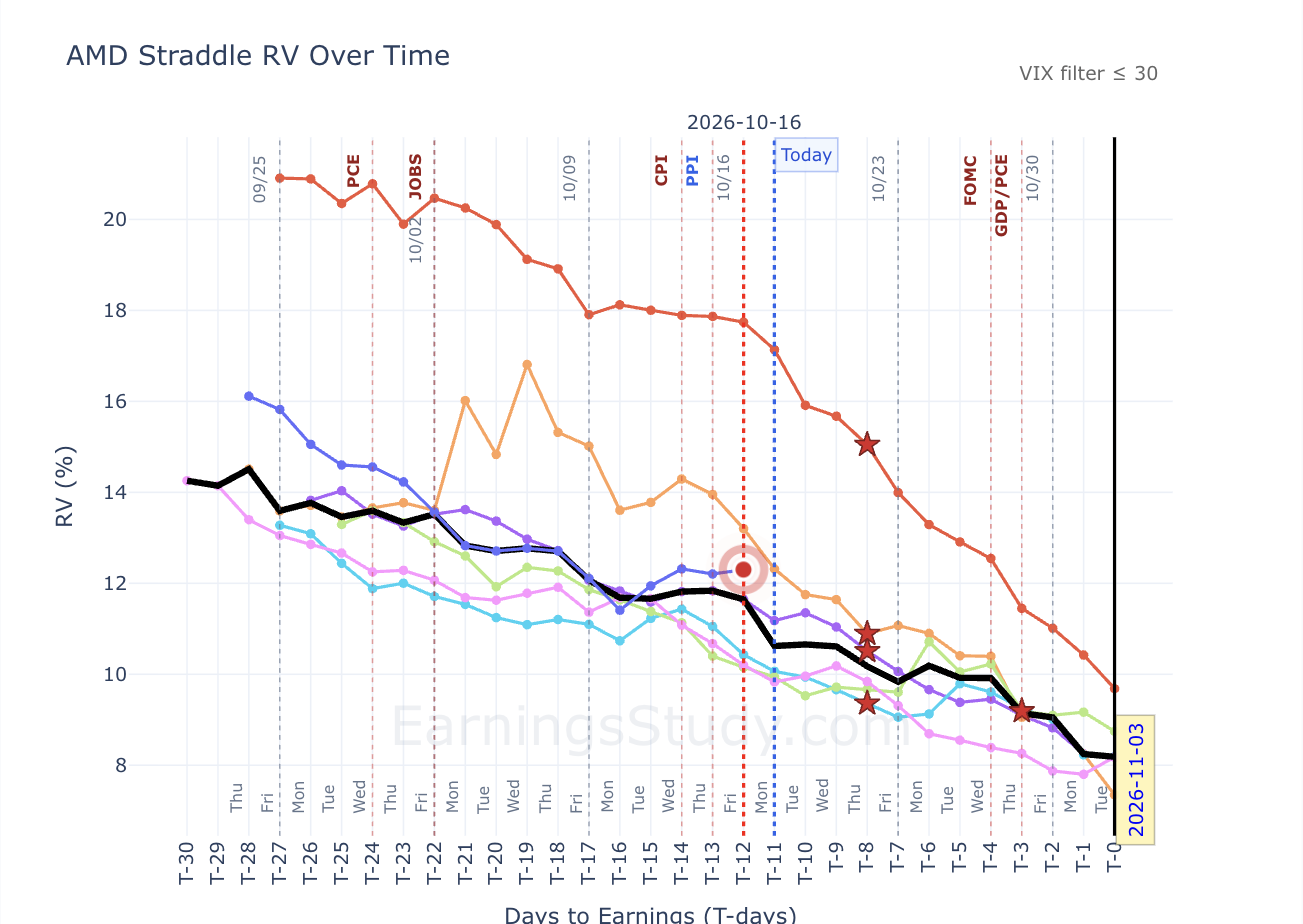
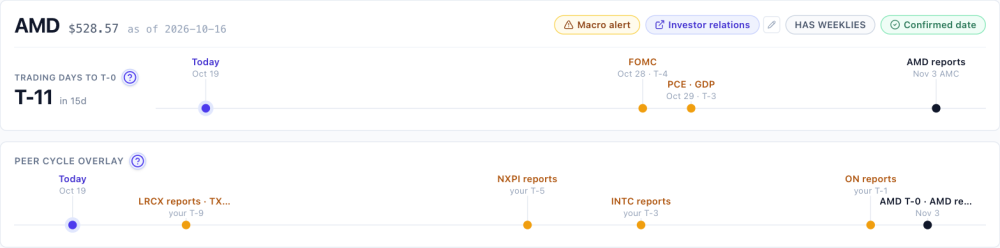
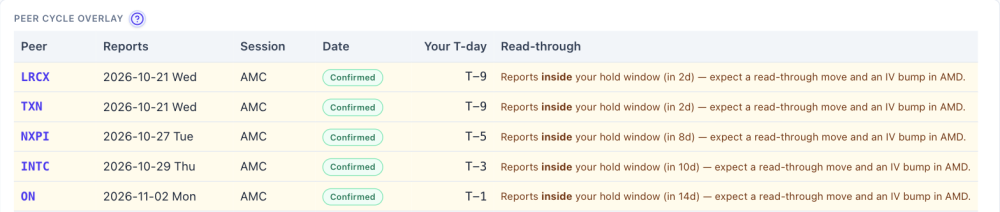
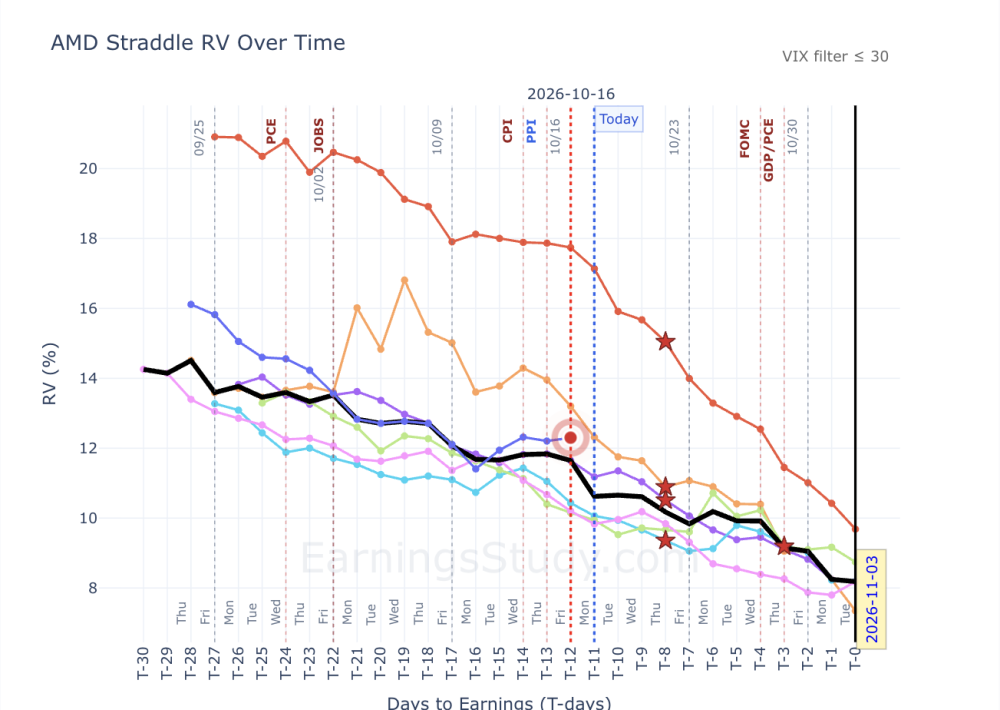
AMD reports Nov 3. Five chip peers report before it does AMD reports Monday, Nov 3 after the close, and the date is confirmed. It's T-11 today, so a pre-earnings trade opened this week will sit through a lot of news that isn't AMD's. The Summary page puts it on two timelines. On the macro side: FOMC on Oct 28 (T-4), then PCE and GDP on Oct 29 (T-3). On the peer side, five semiconductor companies report while an AMD position would still be open. AMD Summary page, Oct 19. Macro events and peer reports inside the hold window. The peer table further down the page lists them with dates: LRCX and TXN: Wed Oct 21, after the close (T-9) NXPI: Tue Oct 27 (T-5) INTC: Thu Oct 29 (T-3), the day after the Fed ON: Mon Nov 2 (T-1), the evening before AMD's last pre-earnings session AMD peer table, the five reports inside the window. The table lists 15 peers in all. The other ten, including ARM, QCOM and NVDA, report after AMD, so they only matter if you hold through AMD's own report. Does a peer's report actually move AMD's options? Check it rather than assume it. On the Straddle page, pick a name in the Peer earnings dropdown, and a star marks that peer's report on every past AMD cycle. With INTC selected, none of the past cycles shows a clear jump after the star; most lines keep drifting the way they were already going. And in past cycles INTC mostly reported around AMD's T-8, while this time it lands at T-3, closer to AMD's own report. Run the same check for NXPI, TXN and LRCX before deciding which dates matter to your position. AMD Straddle RV, 8 past cycles. Stars mark INTC's report in each cycle. A crowded window isn't a reason to skip the trade. It's a reason to know which dates you're holding through and to size for them. Educational research only, not trade advice. Past cycles don't guarantee future results.
-
Thank you, and that’s a fair ask. Two things on it. Self-reported results are the wrong instrument for a win rate: people report wins more readily than losses, and twenty fills from five people can’t move a figure built on hundreds of cycles. What subscriber fills can teach, and what the backtest can’t, is execution: the gap between the card’s mid ±0.5% and what the market actually gave. That gap is the whole game on thin names (LEVI two weeks ago), and it is invisible from the data side. So here’s what I’d suggest instead: post your fills here (ticker, structure, entry date and debit, exit date and credit) and I’ll line each one up against what the card assumed on that day. Over a quarter that gives us something no backtest has: a measured slippage per name. The win rate itself I’ll keep measuring the only way that holds up, on the full history, and publishing with the sample size next to it.
-
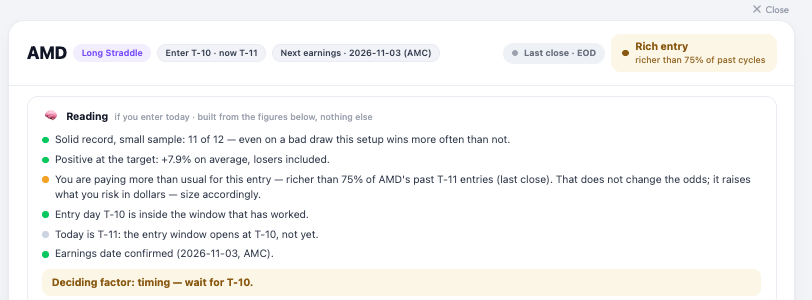
“Reload cheapness” was pricing the first eight tiles of the map and stopping there: each tile is a live chain fetch, so the cap was deliberate, but nothing on the page said so, and a blank tile reads as “no data”. As of today it prices every pre-earnings tile, three at a time, with a counter so you can see it working. Until ~9:45 ET it’s Friday’s close for all of them; after that, live. One more thing you’ll see on each card now: a short “Reading” block under the header (record, return at the target, entry cost, entry day, date, liquidity) and one deciding line. On AMD this morning it says exactly what you’d expect: solid record, richer than usual entry, nothing wrong with the setup, size for the price.
-
@Romuald The new opportunity map is great! Cant wait to test it!! May be you can ask subscribers to inform you of their results, with some details so that you can estimate the win rate and what the subscribers did right & what they need to be cautious about.
-
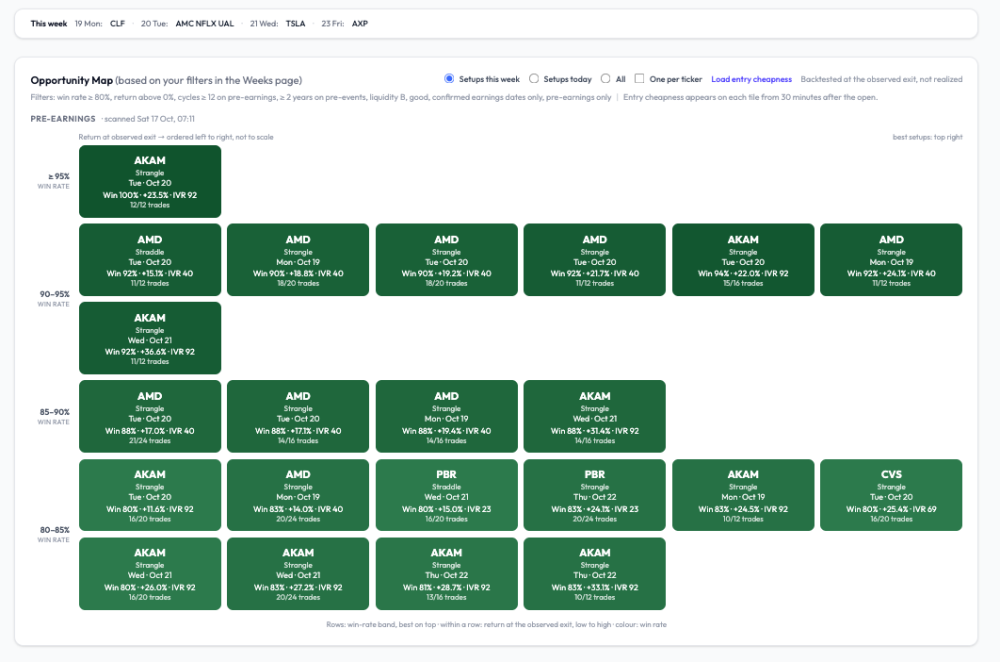
@Romuald great post and like the new look of the opportunity map ... excited to see what the week ahead brings us ... one question (you know I had to have at least one 😁) when reload cheapness is initiated only certain tickers display a value (AKAM, CVS) ... I know they are based on Friday's close and we won't see live updates until appx 30 minutes after open tomorrow but curious why AMD and PBR don't show a value now
-
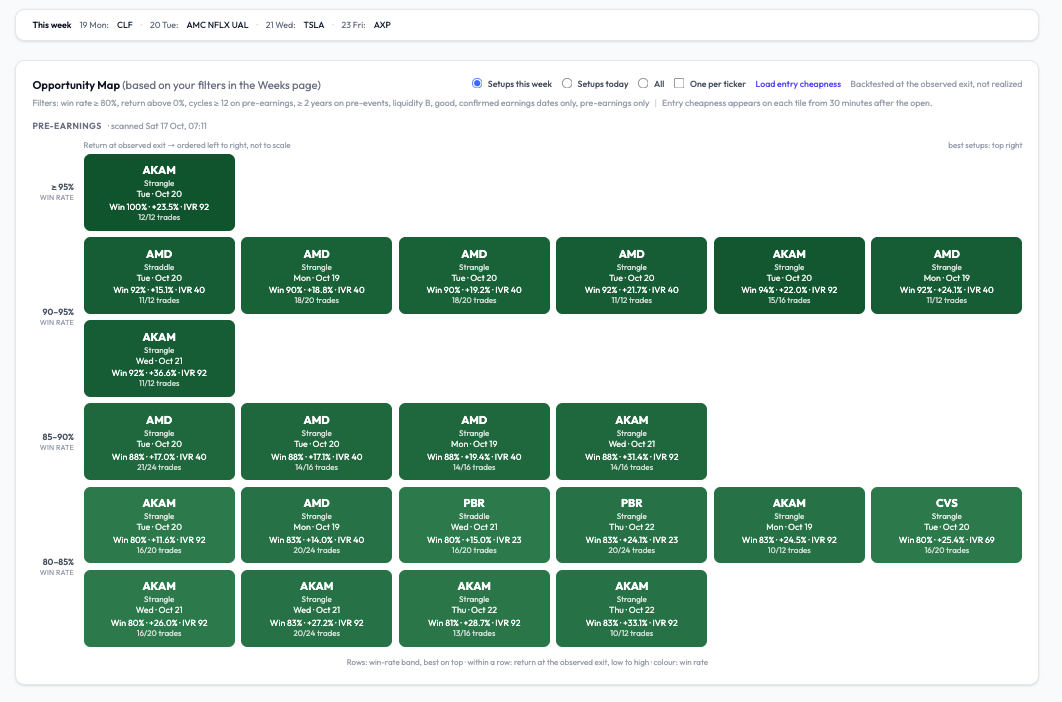
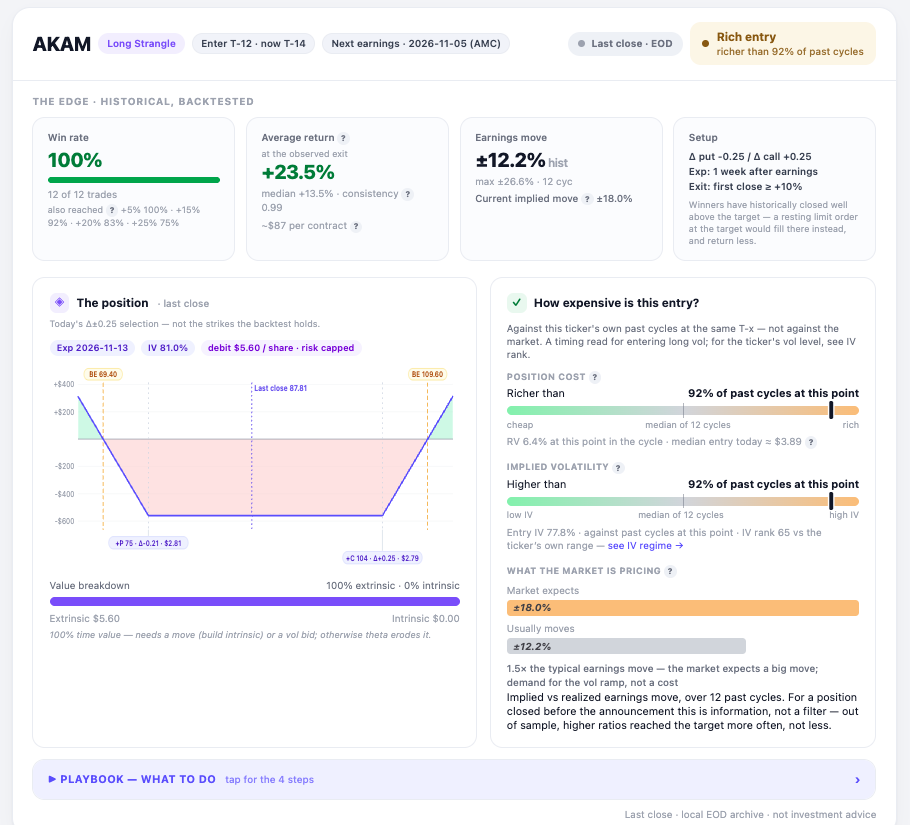
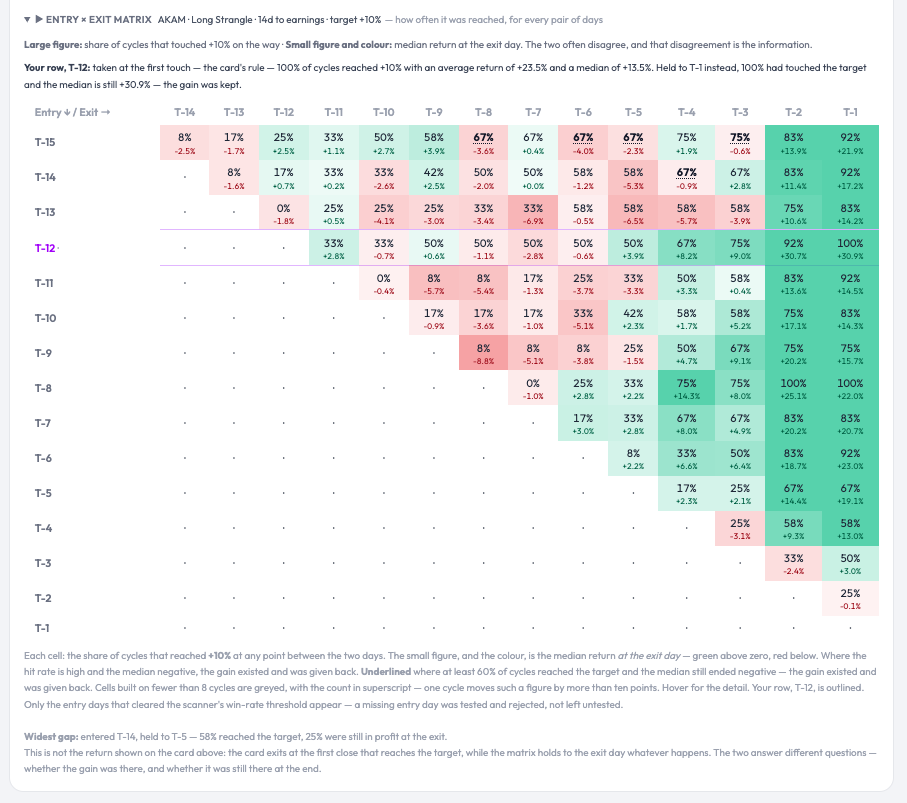
A good-looking pre-earnings week — on paper. The entry will decide. Next week’s scanner is unusually rich in pre-earnings setups with long, clean records: AMD (reports Nov 3, confirmed), AKAM (Nov 5, confirmed), CVS (Nov 4, confirmed), PBR (Nov 10, confirmed). Screenshot below, filtered to confirmed announcement dates only, win rate ≥ 80 %, at least 12 cycles, liquidity B or better. Two things changed in how the grid reads on optionbench, and I’d rather explain them than let you guess. The layout is now an X-Y ranking. Rows are win-rate bands, best on top (≥ 95 %, 90-95 %, 85-90 %, 80-85 %). Within a row, tiles are ordered left to right by return at the observed exit, low to high: ordered, not to scale. So the best setups sit top right, and a tile’s position tells you two things at once without reading it. Colour still encodes win rate. Every tile shows the sample as a fraction (12/12, 18/20) next to the percentage, because 100 % on 12 is not the same evidence as 90 % on 20. The return is “at the observed exit.” That’s the close of the day the position first crossed +10 %, which overshoots the target: AKAM’s +23.5 % average comes with a +13.5 % median. A resting limit at +10 % books less. Both figures are on the card. Now the part that matters. AKAM at T-12 is the strongest line of the week: 12 of 12 cycles reached +10 %, and the entry×exit matrix shows the gain was still there at T-1 in 100 % of them (median +30.9 % held: unusual; on most names the gain exists and has to be taken). Yet today the same card reads Rich entry - richer than 92 % of past cycles at this point, IV higher than 92 % of them, implied move 18 % against a 12 % realised average. The historical record says the setup works; the gauge says Friday’s close was a poor moment to pay for it. Both are true, and the gauge is the one that has been monotonic out of sample: the richer the entry, the worse the outcome, at every level. So the week is promising and no tile is a trade. On each entry day, after the first half hour, the live gauge on the card decides — cheaper than the median, or pass. Click any tile and you get the full card: the historical edge, the live position with its gauges, the playbook (what to do, in four steps), and the entry×exit matrix that shows, for every pair of entry and exit days, how often +10 % was touched and what the median return was if held — the two numbers that usually disagree, and that disagreement is the point. One correction on labelling, since someone will check: when a date shows “estimated”, it means our calendar source has not published a report time yet — the company may well have announced it. The screenshot excludes those on purpose. Romuald - OptionBench.com
-
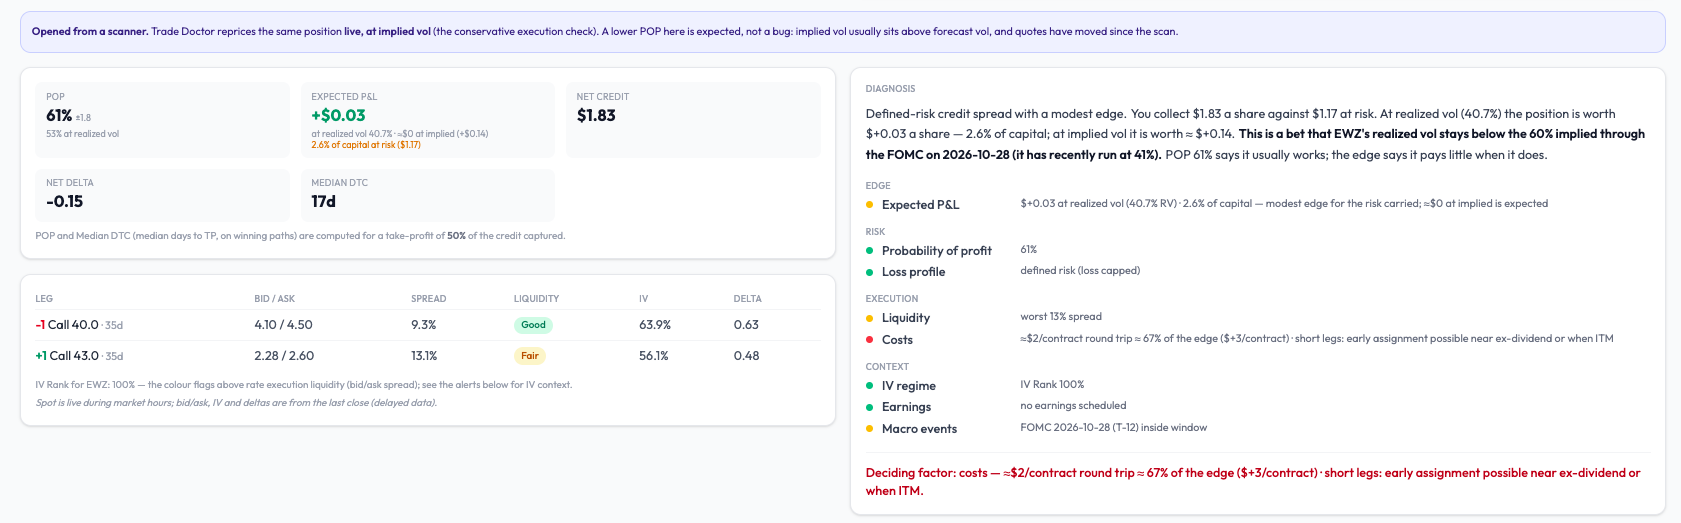
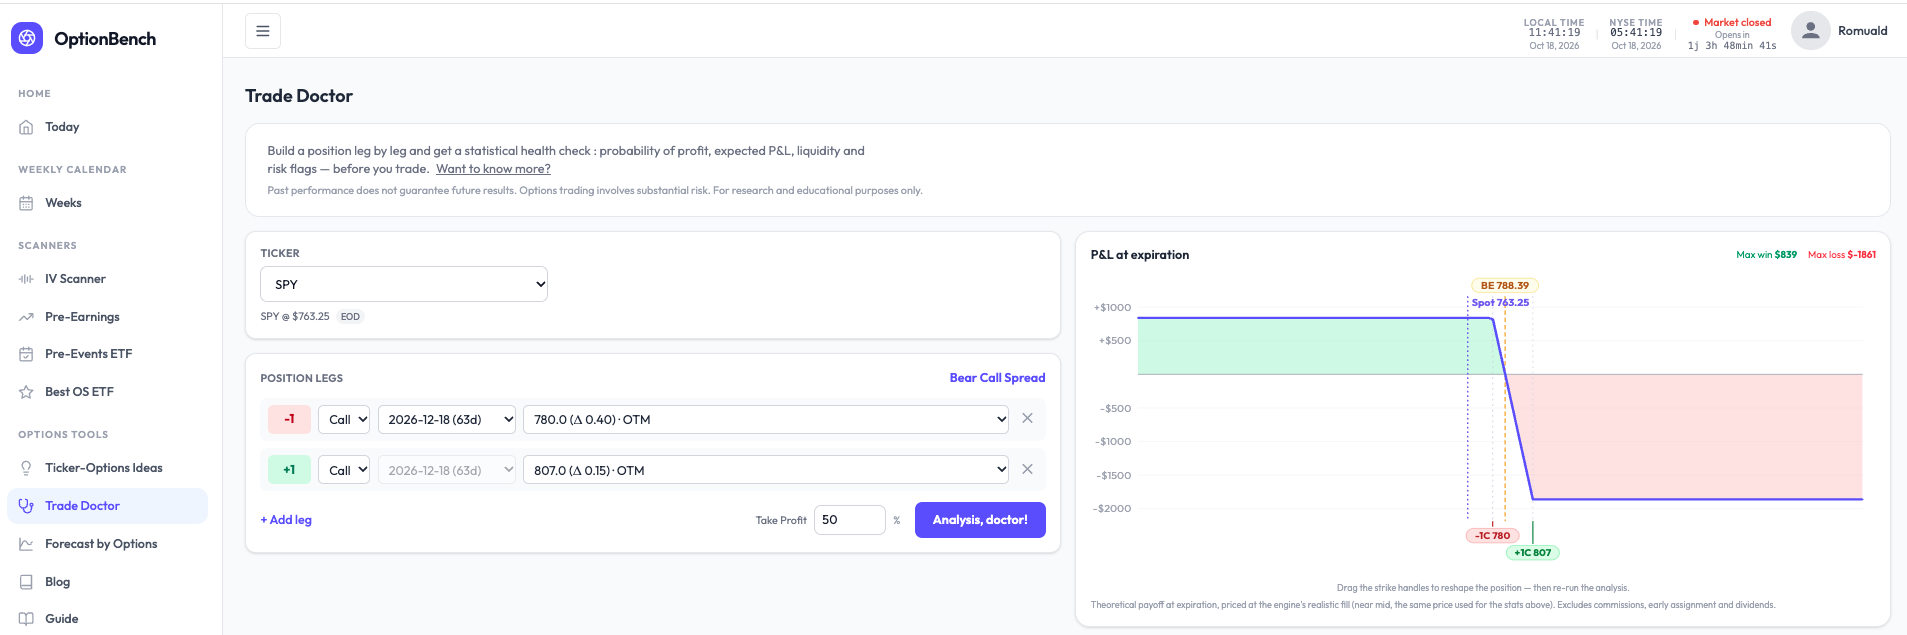
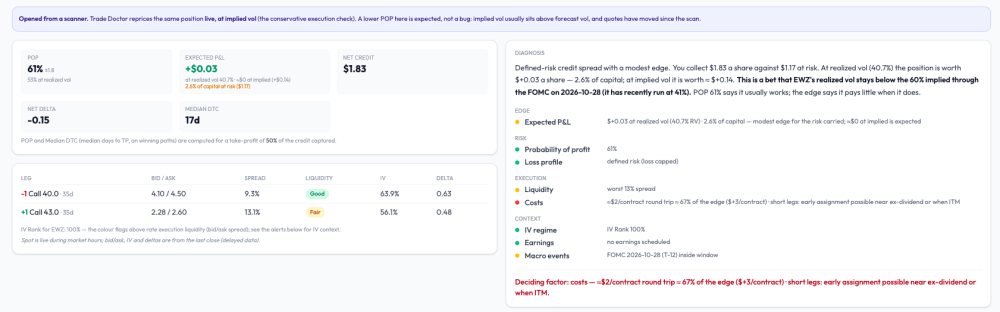
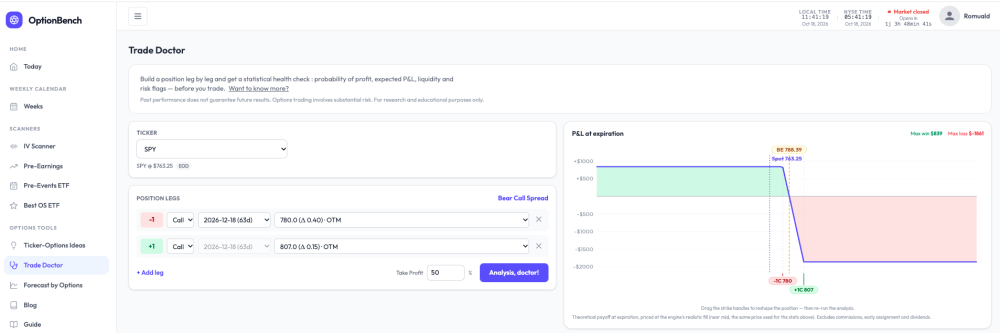
What are you actually betting on? A small change to how Trade Doctor reads a position. Every options tool shows a POP. Almost none tells you what the bet is. A bear call spread on SPY with POP 81% reads like a good trade — until you ask what has to be true for it to pay, and what it pays when it does. I rebuilt the diagnosis block of OptionBench’s Trade Doctor around that question. It now opens with a plain-language reading, computed, not written by a model. For that SPY spread (−780/+807 calls, Dec 18): Defined-risk credit spread with a modest edge. You collect $8.39 a share against $18.61 at risk. At realized vol (10.1%) the position is worth +$0.69 a share — 3.7% of capital; at implied vol it is worth ≈ $0. This is a bet that SPY’s realized vol stays below the 12% implied through the FOMC on Oct 28 (it has recently run at 10%). POP 81% says it usually works; the edge says it pays little when it does. Then four questions — edge, risk, execution, context — one finding per line, one number per finding, all in the same convention. And one last line naming what weighs most: Deciding factor: the edge — +$0.69 a share at realized vol, 3.7% of capital. A rise in realized vol toward implied erases it. No verdict. The tool doesn’t say take it or pass. It says what the bet is, where it’s thin, and what would break it — the three things you need to decide for yourself, in the order you need them. On an EWZ spread it wrote “Deciding factor: costs — a $3/contract edge against ≈$2 of commissions; little is left after the broker.” That sentence has saved a few of us from a few trades. The point isn’t the SPY spread. It’s that “81% POP” and “pays little when it works” are both true of the same position, and most screens only show you the first one. Romuald - OptionBench
-
An OptionBench member asked me whether “rich” pre-earnings vol means we should be selling it. Worth answering in public, because the premise is where most people trip. “Rich” on our gauge is relative: the straddle today versus that same name’s past cycles at the same distance from earnings. It says nothing about absolute vol; and absolute vol is low right now (SPY sits at IV rank 13). Selling index premium here collects little for the same risk. Our structure scanner (it sweeps straddles, strangles, condors, butterflies, debit and credit spreads on 26 ETFs and ranks them by expected value over risk at realized vol) built a SPY bear call spread on Friday and rejected it at 2.4% EV/risk: under the 3% we treat as the friction floor. Selling vol isn’t missing from the toolbox; the toolbox is saying it doesn’t pay this week. Selling single-name vol into earnings because the straddle is rich is a different trade: short gamma into a gap. We backtested that family this summer. The seller’s edge holds as long as nothing moves and collapses on the moves above 10%: a 75% win rate with the losses doing all the work. Not something I’d publish with a win rate attached. What does make sense in a rich regime is what the member actually did: he passed. Entry richness is the strongest single predictor we’ve measured on 95,000 pre-earnings cycles, and it’s monotonic — the richer the entry, the worse the outcome, at every level. Waiting is a position.
-
 William Lento joined the community
- Earlier
-
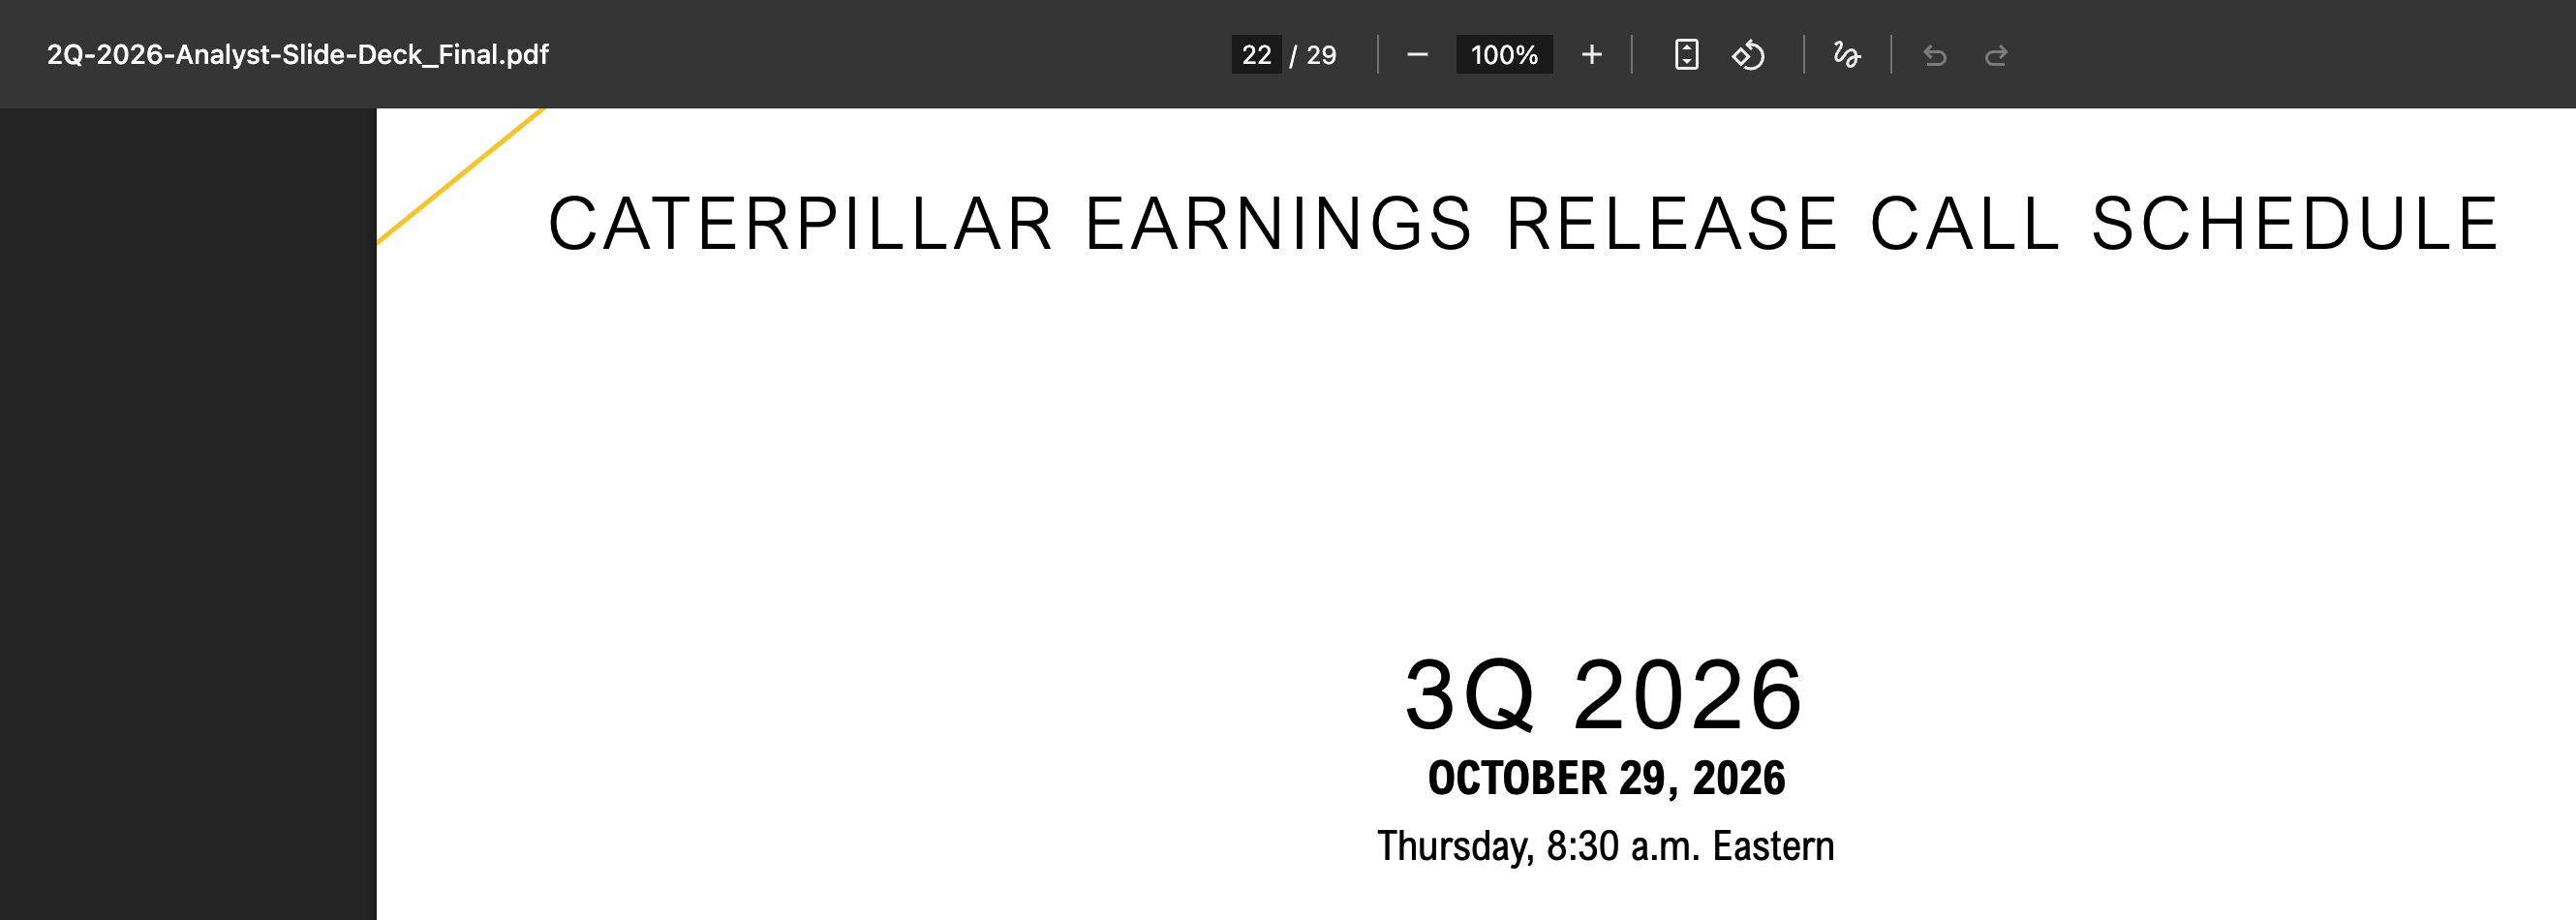
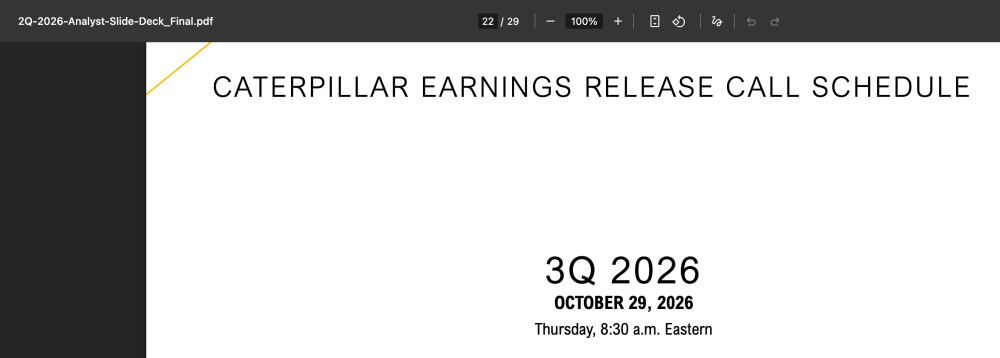
I'm glad you used those links to double check the dates. Thats the whole purpose of making lives easy to click the IR link before placing the trade. Regarding CAT they gave the dates in different place on their website here https://s25.q4cdn.com/358376879/files/doc_financials/2026/q2/2Q-2026-Analyst-Slide-Deck_Final.pdf Page 22. In our experience 90% of the time the confirmed flag aligns with the dates, but there could be misses when the company decides to push the date, they even cancel the earnings call. I have a routine to keep checking the dates across all earning symbols. As a good practice we need to always check the investor relations page to confirm again. I'll try to add the features on the Earnings calendar pages. In the month of August we added 40+ features & improvement, September 30+, this month we rolled out 10+ features. Please check out Gex & RSI in the menu. Articles coming out on those soon.
-
Confirmed Earnings Dates - I am confused. I love your approach and the simple filter earnings date confirmed, even adding the IR web link leading to the investors page. I have great belief in your resources getting earnings dates confirmed so I just want to verify how you get the dates verified even when the IR page does not have the date yet (CAT) or shows projected (AMAT)? Can you please add an USD range, liquidity and a strategy filter to your EarningsCalendar page?
-
 froilancin joined the community
-
We are doing another round of research on traders' views around psychology. The survey is now live: https://www.surveymonkey.com/r/steadyoptions
-
- 2
-

-
 darkhand3001 joined the community
-
 Greenberg Rapp Financial changed their profile photo
-
Greenberg Rapp Financial joined the community
-
 ronbeton joined the community
-
Thanks, sorry i didn’t see this before. You can follow this link with the original inspiration https://steadyoptions.com/forums/forum/topic/3885-volatilityhqcom-official-thread/?page=14#findComment-152525
-
 Leander joined the community
-
 jiaozi577 joined the community
-
@Djtux, I started using the site a few months ago, and wanted to let you know I absolutely love it! I do have a question. Can you explain to me the non-earnings income calculator page? If you've done so already, can you point me to that? I wasn't able to find anything. Thanks! Sean