All Activity
- Today
-
 BaHiram joined the community
 -
 Thanks @Romuald for all your work pulling this together. I appreciated the opportunity to be a beta tester and in a small way a contributor to the shipped product. Looking forward to my first annual subscription and many more after that. Dave is
 -
 Romuald, Sorry to keep sending messages to you. In the "Today's Briefing" page, it would be better (from my perspective), if you move the: "Lower win rate .........Higher win rate" to the top of the "Opportunity Map" Sarang
 -
Romuald, This is Sarang again. When I entered my details for the subscription, the site said the email already exists. Then, I saw that those who have an account can log in - I tried and got in. Let me know how and where to provide credit card details for a subscription. Thanks, Sarang
-
Romuald, This is Sarang, one of your beta-testers. I tried to subscribe using the "Optionbench.com" site. One suggestion: The password line does not have a facility to see the typed password. Please include that.' Thanks, Sarang
-
 koutsodontis14 joined the community
 -
 koutsodontis joined the community
 -
 OptionBench is live! The beta is over. Two months, seventeen testers, a lot of pointed feedback and several improvements. Thank you for that. What you get Nine tools, one subscription: • Today — daily opportunity map, ranked by historical edge • Weeks — every entry date from every scanner in one calendar • IV Scanner — where options are unusually rich or cheap versus their own history • Pre-Earnings and Pre-Events ETF — backtested win rates, average returns, and per-cycle dispersion on FOMC, CPI, NFP, ISM, PCE and earnings • Best OS ETF — option structures across 26 liquid ETFs, with the payoff and key figures laid out • Ticker-Options Ideas — pick a ticker, get what currently makes sense on it • Trade Doctor — any multi-leg position, fully diagnosed: POP, expected P&L at implied and realised vol, loss profile, liquidity • Forecast by Options — the probability distribution the market is pricing right now, straight from the chain Pricing $49/month, or $529/year — $44/month if you pay annually. 7-day free trial, cancel any time during it. Discord Every subscription includes the private server. Methodology questions, scanner discussion, bug reports, and a direct line to me. It's also where I post what I'm working on before it ships. And this is the part I mean Tell me what's missing. Every meaningful change over the last two months came from someone here saying "this is confusing" or "why isn't there a…". The intraday timing tool, the expiration fix, the calendar filters — none of that was on my roadmap. Your roadmap is better than mine. https://www.optionbench.com/ Welcome!
 - Yesterday
-
 GQL joined the community
 - Last week
-
 Rohit S joined the community
 -
 Jimbeaux2 joined the community
 -
 hvs joined the community
 -

 By Alex Liberfield What it does not produce on its own is a complete picture of the risk system those structures sit inside. A trader can know how to construct dozens of strategies and still be missing large parts of that system. The position gets entered correctly, the payoff diagram is accurate, and the trouble shows up later, when volatility shifts, the underlying gaps, liquidity thins out, margin requirements move, or several individually sensible trades start behaving like one concentrated bet. Knowing strategies means understanding how trades are built. Understanding derivatives means understanding how they behave once they are on. That distinction sits at the center of the body of knowledge behind the [Certified Futures and Options Analyst (CFOA) certification, issued by the International Council for Derivative Trading. The CFOA framework treats futures, options, volatility, leverage, margin and portfolio risk as one connected discipline rather than as separate chapters, and for an options trader the practical consequences of that view start in a few specific places. The expiration diagram is only the final frame A payoff diagram shows what a position is worth at expiration, assuming it is still open and every obligation has been met. It says close to nothing about the route taken to get there, which is where most of the actual trading happens. Take a calendar spread. At expiration the payoff is easy enough to describe. Before expiration the position is driven by the relationship between the implied volatility of two maturities, by movement in the underlying, by the passage of time and by the shape of the volatility surface. A trader who files the calendar under "long vega" has compressed away most of what matters. The near-dated and longer-dated options do not respond to volatility changes in the same way or by the same amount. The spread can benefit from a rise in longer-dated implied volatility and still lose if the front month richens relative to the back, or if the underlying travels too far from the strike. The vega itself is not a fixed quantity either, since it moves as time passes and as the underlying repositions relative to the structure. Iron condors present the same problem from a different angle. The maximum loss is defined, which is the appeal, but the path toward that loss produces genuinely difficult decisions. A volatility expansion can damage the position well before the underlying approaches either short strike. One side can turn sharply directional while the other decays into nothing. Closing or rolling a tested side reduces one exposure and enlarges another, and the decision has to be made with incomplete information about what happens next. A trader reading only the expiration graph sees a bounded trade with known edges. A trader reading the whole position sees a shifting combination of delta, gamma, vega, theta, skew exposure, liquidity and execution risk, most of which will look different in a week. The Greeks have to be read as a portfolio Most traders learn the Greeks one at a time. Delta measures directional sensitivity, gamma the rate at which delta changes, vega the sensitivity to implied volatility, theta the effect of time. The definitions are the easy part. The harder question is how those exposures combine across everything held at once. A portfolio can contain trades that look entirely unrelated and express almost the same risk. A calendar in one index, an iron condor in another and a short strangle in a liquid single name look diversified by instrument and by structure. All three can be materially short convexity, or dependent on the same reasonably calm volatility environment, in which case the diversification is cosmetic. The questions worth asking are aggregate ones. What is the portfolio's net delta, and how fast does that delta change after a large move? Is the book long or short volatility, and at which maturities? How concentrated is the exposure around particular strikes? What does the whole position look like after a five, ten or fifteen percent move in the market? That last question matters because displayed Greeks are local estimates. They describe the portfolio in the immediate neighborhood of the current price, under current assumptions, and they are not a description of what the portfolio becomes once the market has moved somewhere else. A position carrying modest delta today can be strongly directional after a large move purely through gamma. A book that looks well hedged can lose that balance in a session. A small net vega figure can sit on top of large offsetting exposures across maturities, strikes or underlyings, all of which reappear the moment those exposures stop offsetting. Which is why serious risk work runs scenarios rather than reading a current Greek summary and stopping there. Implied volatility is not a single number Traders often discuss implied volatility as though an underlying has one volatility level. It has a surface. Different strikes trade at different implied volatilities, different expirations carry different expectations and different supply and demand conditions, and the shape of the surface can change while the headline number sits still. This matters because most multi-leg trades contain relative volatility exposure rather than outright exposure. A vertical spread depends partly on the volatility relationship between two strikes. A calendar depends on the relationship between two maturities. A diagonal carries both. A ratio spread can be extremely sensitive to skew. So a trader who has concluded that volatility is going up has not finished the analysis. Which volatility? Near-dated or long-dated, at the money or downside skew, before or after a known event, across the whole surface or in one segment of it? A position can be long vega in aggregate and still lose money during a rise in a broad volatility index, if the part of the surface the structure actually depends on moves differently from the part the index is tracking. Earnings and scheduled macro events are where this gets expensive. Front-month implied volatility frequently collapses immediately after the event while longer-dated volatility barely moves. A calendar entered into that setup can be an excellent trade, and whether it works depends on relative repricing across the two maturities rather than on whether volatility broadly went up or down. Complete options analysis needs term structure, skew and relative value, not a directional opinion about implied volatility. Liquidity is part of the strategy Plenty of structures look excellent at the midpoint. Considerably fewer survive realistic transaction costs. A four-leg trade can show a favorable theoretical return that wide markets erode substantially before anything has happened, and the same friction applies again on every adjustment and once more on the exit. Liquidity is also not a constant. A spread that fills easily in normal conditions can become difficult to unwind during a sharp move. Bid-ask spreads widen, quoted size disappears, complex orders fill badly or not at all, and the precise adjustment that looked available at entry turns out to be unavailable at any sensible price. An adjustment only exists if the market will let you execute it, which is a principle most adjustment plans quietly assume away. Before entering, the useful questions are about each leg individually: how liquid is it, what does closing the whole structure realistically cost, and is there one option here that becomes very hard to trade if the underlying moves against the position? A structure should be judged on the payoff that can actually be captured after spreads, commissions, slippage and imperfect fills. Assignment is not a footnote American-style options can be exercised early. Most traders know this and still treat assignment as an anomaly rather than as an ordinary feature of the contract they have sold. It becomes live when a short option is deep in the money, carries little remaining extrinsic value, or approaches an ex-dividend date. A covered call writer may regard assignment as harmless since the shares are already there, and early exercise can still change tax timing, remove an expected dividend and close the position earlier than planned. Inside a multi-leg spread the consequences are larger. Assignment creates a stock position and materially different overnight exposure, and the long leg does not exercise in sympathy. The trader can arrive the next morning holding something whose directional profile and capital requirement bear no resemblance to the spread that was entered. Expiration adds its own operational risk, since options sitting close to the money can produce unexpected exercise outcomes, particularly when the underlying moves after the cash market closes. Understanding options includes understanding exercise procedures, assignment mechanics, settlement and what it costs operationally to hold positions into expiration. These are part of strategy selection rather than a separate administrative concern. Margin changes the decision, not just the sizing Margin tends to get treated as a calculation performed once, before the trade goes on. In practice it moves. Requirements change as the underlying moves, as volatility rises and as the broker revises its own risk assumptions. Portfolio margin produces efficient capital treatment in ordinary conditions and can increase requirements quickly under stress, which is precisely when the trader has the least flexibility. Adjustments move margin in ways that are not always intuitive. Closing a profitable leg can remove an offset that was reducing the requirement somewhere else. Rolling a short option can increase notional exposure even though the risk feels like it has been pushed further away. Several spreads combined can produce a capital profile substantially worse than the sum of the individual trades suggested. The reason this matters is that margin pressure forces action at the worst available moment. A position with an acceptable theoretical maximum loss can still be unsuitable if the interim capital requirement is more than the account can carry, because the real risk includes being closed out before the thesis has had time to resolve. Capital planning belongs in stress scenarios rather than in the broker's opening requirement. Adjustments are not free repairs Adjustments get discussed as though they reduce risk at no cost. Every adjustment is another trade, and it changes the portfolio's Greeks, transaction costs, margin requirement and probability distribution along with it. It can reduce immediate delta while adding short gamma. It can collect additional credit while increasing total risk. It can extend the position into another expiration and convert a short-term view into a longer commitment nobody consciously chose to make. Asking whether a trade can be adjusted is not a useful question, since almost any position can be changed somehow. The questions worth asking are what exposure the adjustment is meant to reduce, what new exposure it introduces, whether the original thesis still holds, whether the adjustment beats closing the position and putting the capital somewhere else, and whether the trader would enter the resulting position as a fresh trade today. That last one tends to be the most revealing. Traders defend adjusted positions on the strength of the trade's history rather than the quality of what is left, and the market has no interest in the original entry price or how much credit has been collected along the way. Whatever remains after an adjustment has to stand on its own. Futures belong in a complete options skill set An options trader does not need to become a futures specialist, though futures knowledge belongs inside a complete derivatives education, and the gap shows up quickly in traders who skipped it. Futures are used for directional exposure, for hedging and for portfolio management, and they offer an efficient way to adjust delta without disturbing the options structure itself. They also sit underneath options on futures, which bring contract specifications, settlement conventions and expiration relationships that differ from equity options in ways that catch people out. Working with them sharpens a trader's understanding of leverage and term structure generally. Index futures, energy contracts, interest rate futures and agricultural contracts do not behave alike. Multipliers, tick values, delivery terms, trading hours and margin all differ, and a futures price may reflect financing, storage, dividends, convenience yield or straightforward supply and demand expectations depending on what is being traded. Options on futures add a further layer, since the option may expire into a futures position rather than into shares or cash, and the option's expiration can sit apart from the expiration of the underlying contract. The trader needs to know exactly what is being controlled, when it expires and what arrives if it is exercised. From strategy knowledge to derivatives competence Strategy education is not the problem. Structures are how most traders first learn to express a view, define risk and read an option payoff, and there is no obvious substitute for that as a starting point. The difficulty is when the structure becomes the destination. A complete derivatives skill set runs across instrument mechanics, pricing and volatility, individual and portfolio Greeks, leverage and margin, liquidity and execution, exercise and assignment and settlement, adjustment analysis, futures and options on futures, and portfolio construction and stress testing. The CFOA body of knowledge brings those together on the premise that derivatives competence should be assessed as one integrated discipline, since none of them can be managed well in isolation. The premise is worth something even to traders with no intention of sitting the exam. Markets do not separate volatility from liquidity, margin from leverage, or strategy construction from portfolio exposure. Those risks turn up together, usually in the same week, and they are best learned the same way. Alex Liberfield is Managing Partner of Liberfield Capital and works across investment strategy, derivatives and portfolio risk management.
 -
Hey @equus. Sorry for the delayed response. I'm using thinkorswim, and I didn't notice any changes in my fills. Maybe the professional designation affects the brokers more than the traders. I know that some brokers, tastytrade for example, will close accounts of clients that meet the professional designation.
- Earlier
-
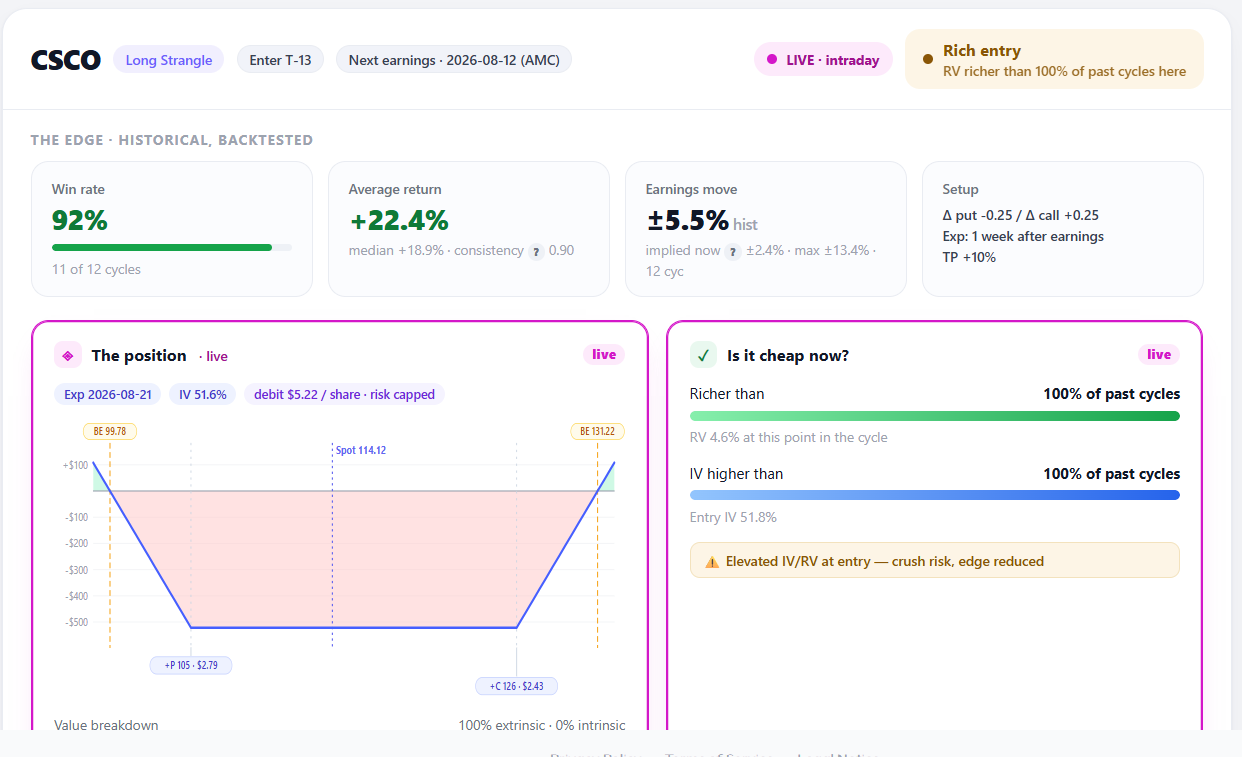
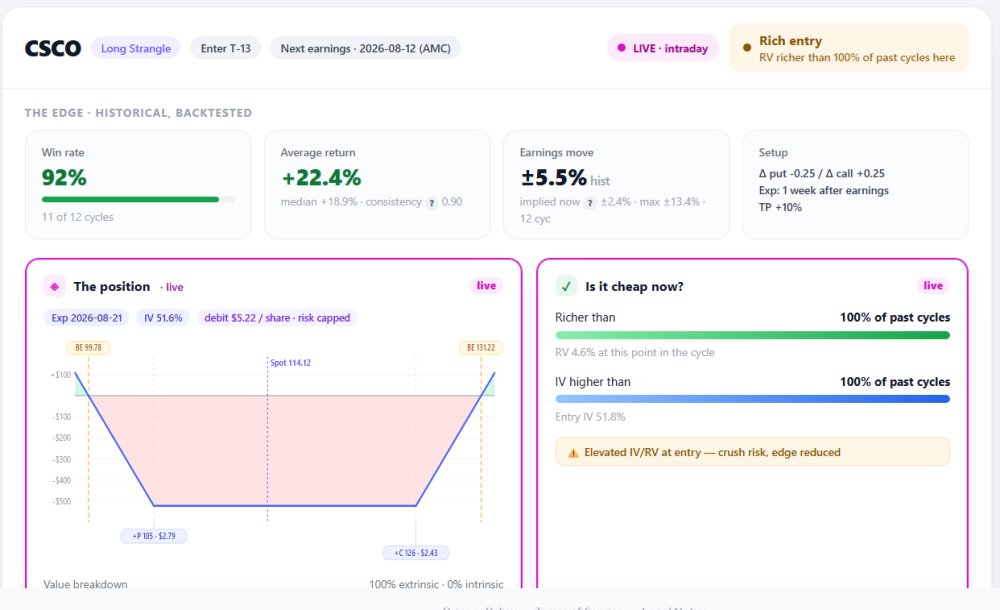
@Romuald looks like we have a similar issue in CSCO ... let's see if it goes "on sale" next week
-
 Sharon_k joined the community
 -
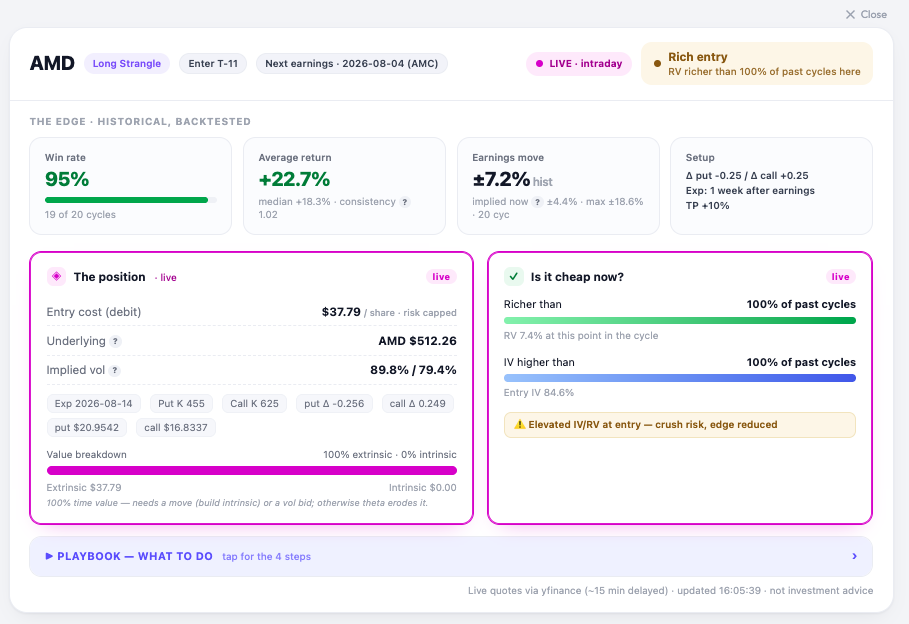
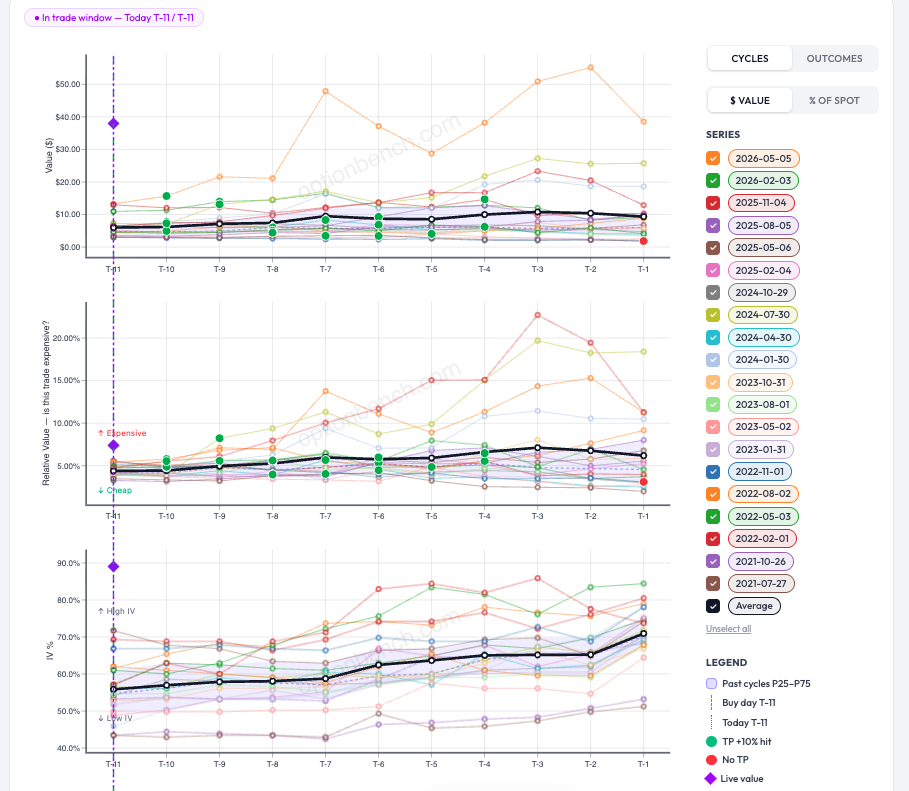
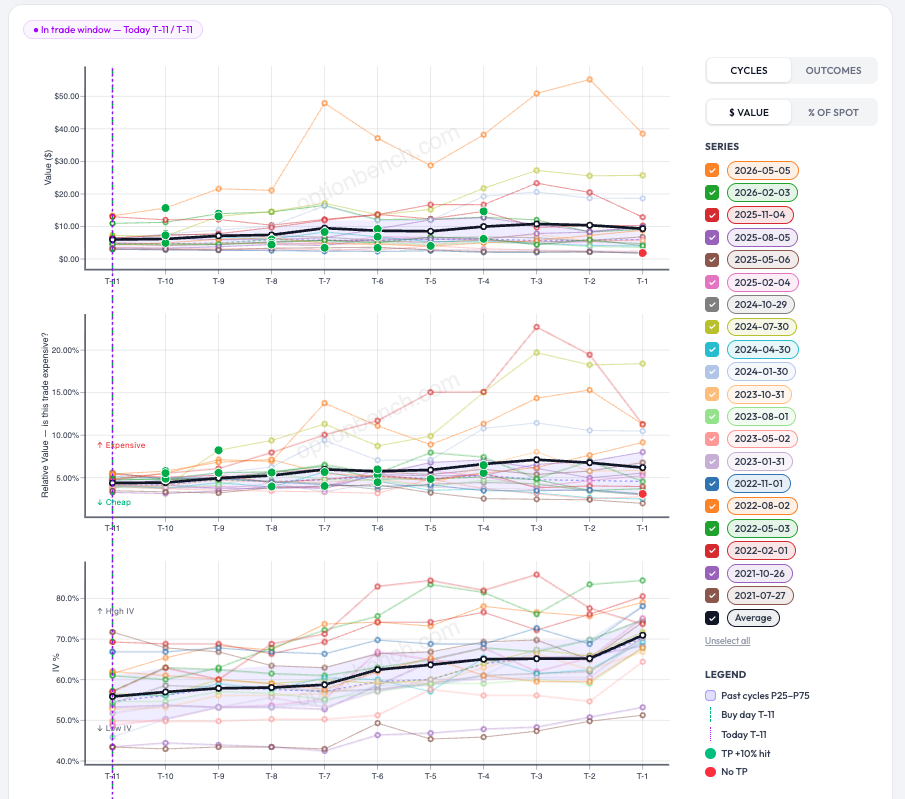
Update — at the open Markets opened, and here's AMD live: the strangle re-priced from $38.69 to $37.79, AMD gapped up to $512, and entry IV eased from ~87% to 84.6%. Marginally cheaper — but the verdict didn't budge: still "Rich entry," still richer than 100% of past cycles, still flagged for crush risk. On the charts, the live-value diamonds sit at the very top of every panel — value, relative value, and IV. Translation: the setup got a little bit cheaper, not cheap. It never dropped into its normal P25–P75 band, so the disciplined read is unchanged. Personnally I would pass, and let the backtest stay a backtest for this cycle. That's the tool doing its job: a 95% historical win rate is only worth having if you don't overpay to get in, from my POV. Romuald - OptionBench
-
@Romuald these revisions are a great step forward keep them coming
-
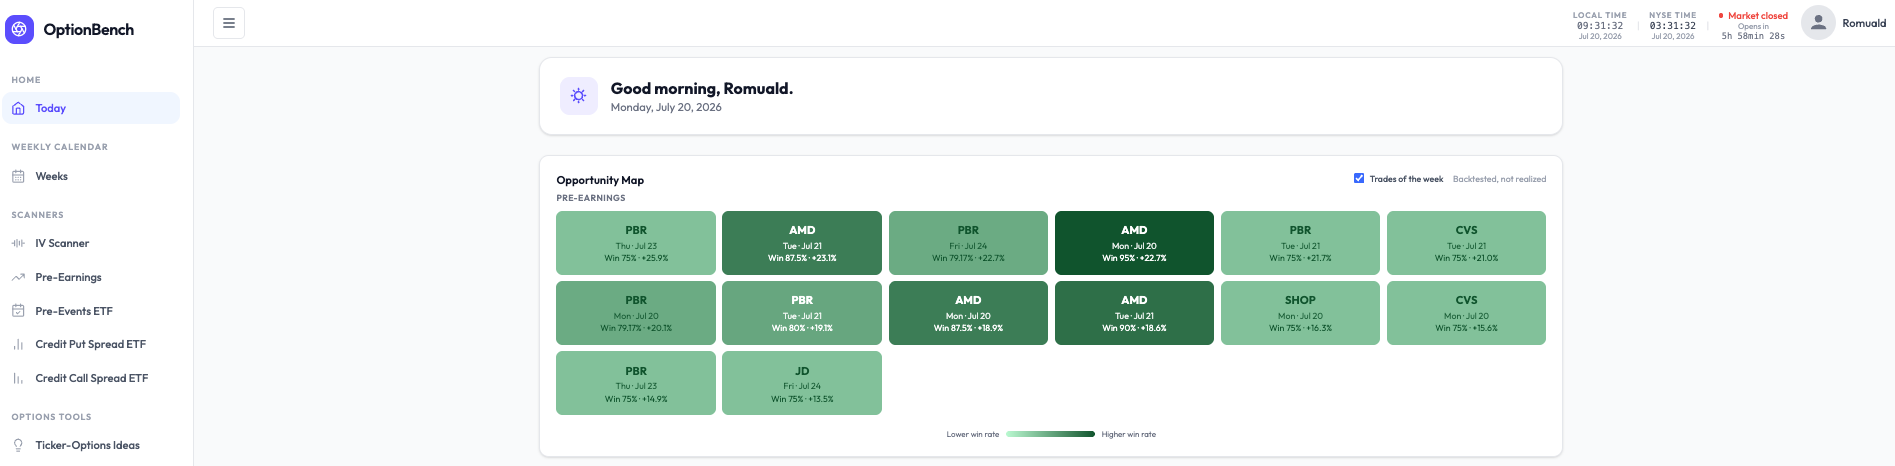
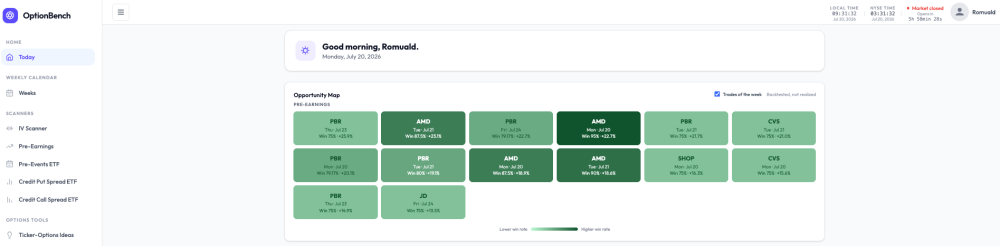
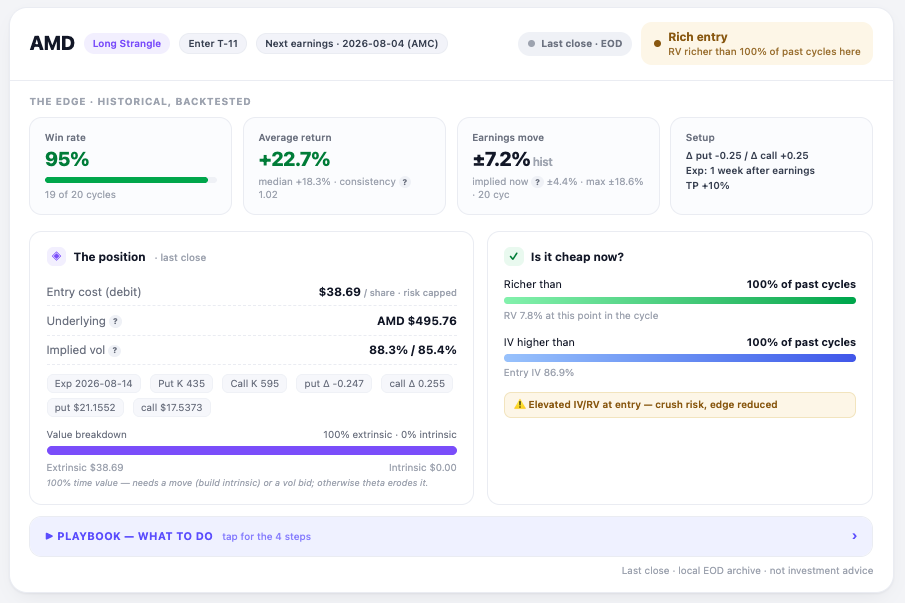
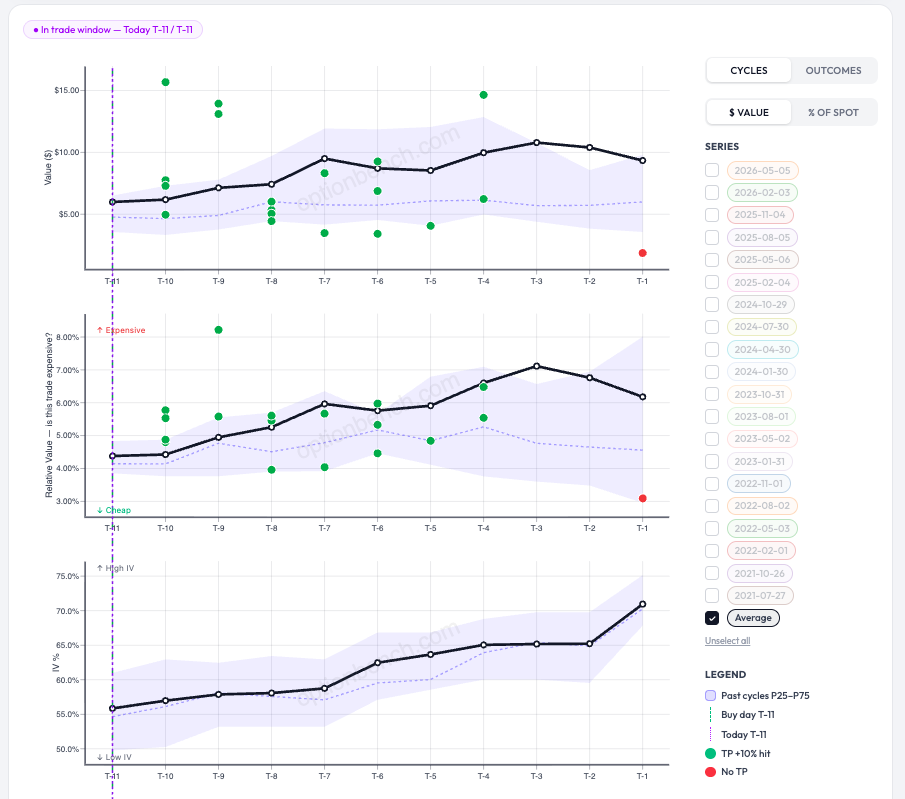
From a Green Tile to a Trade Decision: Inside OptionBench's Pre-Earnings Workflow Most screeners hand you a list. OptionBench hands you a decision — and then argues with you about it. Here's how that works, walking through a real setup on AMD. Start on the map The Today page opens on an Opportunity Map: where you can see one tile per backtested pre-earnings setup for the current week (or week ahead it it is the week-e,d). Each tile carries the ticker, the entry day, and two numbers: historical win rate and average return. The colour encodes the win rate: the darker the green, the more often the setup has worked across past earnings cycles. A "Trades of the week" toggle narrows the grid to the days just ahead, and the caption never lets you forget the key caveat: backtested, not realized. The darkest tile in this view is AMD — Mon, Jul 20 — Win 95% · +22.7%. Tempting. So we click it. One click into the analysis Clicking a tile doesn't dump you at the top of a table, it drops you straight onto that exact row in the scanner, ticker already in focus. For AMD, the setup is a long strangle entered eleven business days before the Aug 4 report and exited the latest about a week after, with a +10% take-profit. The top strip is the historical, backtested edge: a 95% win rate (19 of 20 cycles), a +22.7% average return, a +18.3% median, and a typical earnings move of ±7.2% versus ±4.4% implied today. On the backtest alone, this looks like one of the strongest setups on the board. The part that keeps you honest Here's where OptionBench stops cheerleading. The right-hand verdict reads "Rich entry — RV richer than 100% of past cycles here," and the cheapness panel flags elevated IV/RV at entry — crush risk, edge reduced. In plain terms: the strangle is currently more expensive than at any comparable point in its own history, so buying it now would mean overpaying for volatility, exactly how a great backtest quietly turns into a mediocre fill. One more detail to notice: the badge says "Last close · EOD." Markets are closed right now — it's Monday morning (in France), and the NYSE opens in about six hours — so every live number on the page is the last end-of-day snapshot, not a tradeable quote. The rich-entry read is real, but it's a photograph from Friday's close. The right move isn't to trade it. It's to wait for the open and see whether the morning re-prices the strangle cheaper, or confirms it's still rich. Reading the cycle charts To judge that, we drop into the cycle charts (next Figure). Three stacked panels track the trade from T-11 to T-1 (business days before earnings): the strangle's dollar value, its relative value (RV% — "is this trade expensive?"), and its implied volatility. Every faint line is one past earnings cycle; the bold black line is the average; green dots mark the cycles that hit the +10% target, red dots the ones that didn't. It's a lot to take in at once — so a single click ("unselect all," keep Average) strips it down to the essentials: the average path, the outcome dots, and a shaded band. What the shaded band means That band is the P25–P75 range — the middle 50% of past cycles at each point in the run-up. At every T-x day, we take all the historical cycles and shade from the 25th percentile up to the 75th; the dotted line running through it is the median (P50). Think of it as the setup's normal range. When today's live reading sits inside the band, the trade is priced about as usual; below it, cheaper than history; above it, richer than history. To be continued — at the open So AMD is a beautiful backtest with a currently rich entry, frozen at Friday's close. The interesting moment is only a few hours away: when the market opens, we'll watch whether the strangle cheapens back down into its normal band — and only then decide whether it's worth putting on. That's the whole idea. The map surfaces the opportunity; the analysis tells you whether today is a good day to take it. The discipline is in the gap between the two. See you at the open. Romuald - OptionBench Backtested results are historical and are not realized returns. Nothing here is investment advice. Figures: (1) Today — Opportunity Map · (2) AMD analysis header · (3) Full cycle charts · (4) Simplified view with the P25–P75 band.
-
Unlocking EarningsStudy's Daily Screener The Daily Screener — one of EarningsStudy's most-used tools, and until now reserved for SO Contributors — is being opened up to all Subscribers, free of charge. If you've been curious what the Contributors have been working from each morning, this is it, and now it's yours too. What the Daily Screener does Every trading day, the Daily Screener surfaces the names with earnings on the immediate horizon and lays out how the market is pricing them across EarningsStudy's strategy models — straddles, calendars, strangles, iron flies, double diagonals, long options, and call debit spreads,... — in a single, sortable view. Instead of hunting name by name, you get the day's opportunity set on one screen, ready before the bell. A couple of things worth knowing It's a daily tool — check it daily. The screen is built around what's reporting now. It refreshes each trading day, so its value is in the habit: a quick morning look to see which setups are live before the window closes. Yesterday's screen isn't today's. It's built for comparison, not just a list. Each candidate is shown with strategy-level context and historical win-rate framing, so you're weighing setups against one another on their merits rather than reacting to a single number. If a name trades weekly options, you can fold those into the view as well. It's a research tool, not a signal service. The Daily Screener is there to sharpen your own judgment and point you toward setups worth a closer look — not to tell you what to trade. As always, do your own diligence before putting on any position. How to access it Already using EarningsStudy? The Daily Screener is now in your sidebar — just sign in and open it. Not signed up yet? Register at https://earningsstudy.com/ with the same email you use on SteadyOptions, and you'll have it alongside the rest of the core platform. This is exactly the kind of thing we set out to do with this partnership: take the tools that were once behind an extra tier and put them in the hands of the whole community. More to come. — The SteadyOptions Team
-
@Romuald no rush I'm sure there are other more pressing issues that need your attention ... good luck with the maintenance over the weekend
-
OK, in my (long...) todo list
-
Quick heads-up for anyone using or checking out OptionBench this weekend: app.optionbench.com will be in scheduled maintenance from this Friday 10th of July afternoon (France Time) through the weekend, back to normal Monday. We're doing a planned infrastructure migration on the backend — consolidating the data layer so the scanners run faster and cleaner as we grow. Nothing's broken; we'd just rather take it offline than serve half-migrated data. If you hit a maintenance page over the weekend, that's why — everything will be back Monday. If you were mid-analysis on something and want a hand once we're back up, just ping me and I'll help you pick it back up. Thanks for your patience — doing the plumbing properly now so the tool holds up as more of you come on board. — Romuald, OptionBench.com
-
@Romuald thanks for sharing those thoughts .... I did consider both of them before jumping in .... the richness factor did concern me somewhat and I realize there may be a reduced edge due to that .... I also looked at the other cycles and well not as good as 8 cycles they were all still acceptable in my books as an aside is there anyway to pick more than one strategy in the scanner .. . it would be nice to be able to choose straddles and strangles together as they are closely related ... thanks for the words of thanks it has been a great ride thus far in being able to play a small role in the development of OB

-
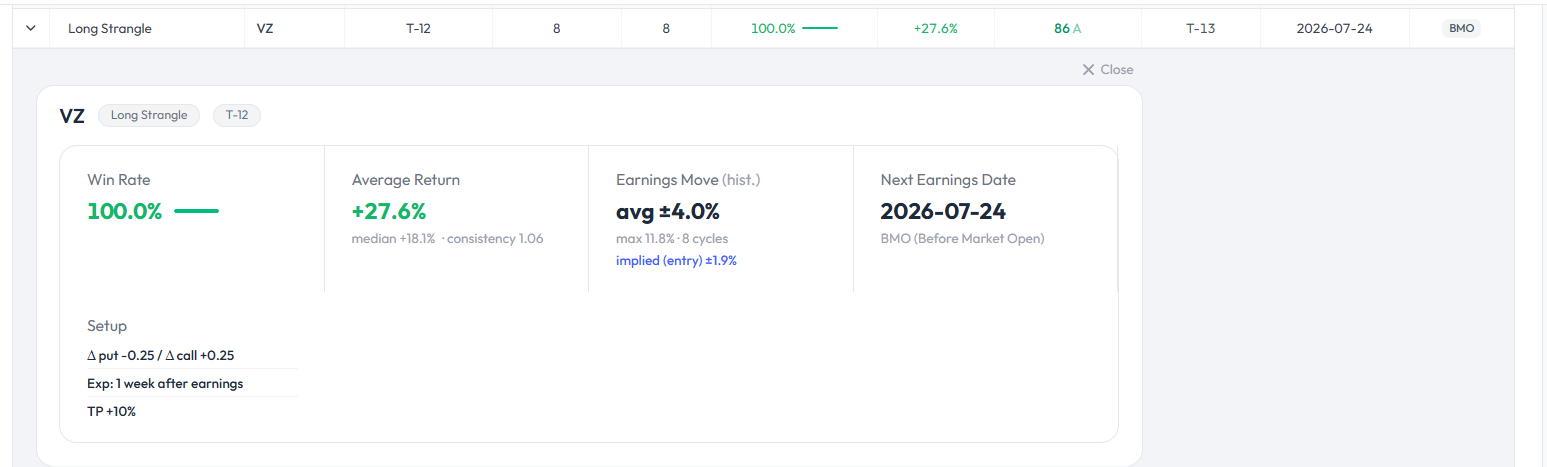
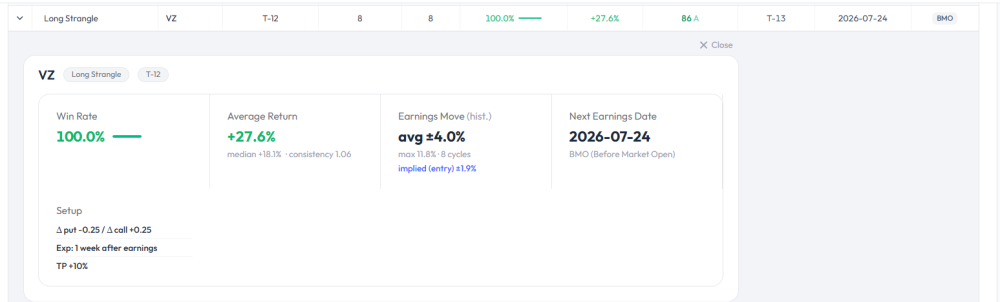
Hey Dave, first of all, thanks a lot for putting OptionBench through its paces and sharing your trades on Discord, it genuinely helps during the beta. On this VZ one, a couple of things I'd flag for how I read these cards — not a verdict on your trade, just the lens I use, but it is very personal. The 100% win rate is on 8 cycles. VZ only reports earnings four times a year, so 8 cycles is about two years of history — a small sample. A 100% rate on 8 is statistically fragile: the true rate underneath could be anywhere from ~65% to ~95%, you just can't tell from 8 observations. So I treat the headline number as "promising, low confidence" rather than a strong edge, and I lean harder on cycle counts of 20+ where the win rate actually stabilises. But, again, this is my POV. The other thing I personally always check before entering is the live banner — the "richer/cheaper than X% of past cycles" read. The historical win rate tells you the setup worked before; the live cheapness tells you whether you're entering at a good price right now. A great historical setup entered when the premium is rich can lose the edge to a vol crush even when the direction's right. So I wait to see that read before pulling the trigger. None of this means it won't work out — just how I'd weigh it. Really appreciate you testing and posting; keep them coming, this back-and-forth is exactly what makes the tool better :).
-
@Romuald time for another test drive VZ strangle
-
I've been exploring how AI can predict market changes. The potential of combining it with options trading looks promising for improving strategies by identifying trends early. What do others think?
-

 For an active trader, those differences can add up to thousands of dollars a year. This article breaks down what actually separates the two, using concrete dollar examples, and gives you a simple framework for choosing the right instrument for your account and your strategy. Underlying Asset Differences: Index vs. ETF Options SPX is the S&P 500 index itself. It is a statistical construct, not a security — there are no shares to buy or sell. You can only trade options (and futures) on it, and those options settle in cash. SPY is the SPDR S&P 500 ETF. It holds the actual 500 stocks, trades like any share, and its options settle by delivering shares. That single distinction — cash settlement versus physical share delivery — cascades into almost every practical difference that follows: exercise style, assignment risk, contract size, and even how the two are taxed. SPX vs SPY Option Contract Sizes and Capital Requirements SPY trades at about one-tenth the level of the SPX index. With SPX near 7,500 and SPY near $750, the notional exposure of each contract looks like this: SPX SPY Approx. level 7,500 $750 Multiplier $100 100 shares Notional per contract ~$750,000 ~$75,000 One SPX contract carries roughly the same market exposure as ten SPY contracts. For a trader putting on size, that means fewer contracts, fewer commissions, and less execution complexity. For a smaller account, it means SPX can be too coarse — you may only be able to hold one or two contracts where ten SPY contracts would let you scale in and out with precision. Settlement and exercise: European vs American SPX options are European-style. They can only be exercised at expiration, and they settle in cash. If you hold a long 5,900 call and SPX settles at 5,910, you simply receive $1,000 (10 points × the $100 multiplier). No shares ever change hands. SPY options are American-style. They can be exercised at any point before expiration, and in-the-money contracts result in shares being delivered or called away. For anyone trading multi-leg positions, this is bigger than it sounds. If you are short the body of an SPX iron condor or butterfly and the index blows through your strike intraday, nobody can exercise against you early — the position stays intact until expiration. With SPY, a short leg that goes deep in the money (especially around an ex-dividend date) can be assigned early, leaving you with an unwanted 100-share-per-contract stock position and a hedge that no longer lines up. Cash settlement removes that failure mode entirely. Section 1256 Tax Advantages of SPX Options This is where SPX earns its keep for active traders. SPX options are taxed more favorably than SPY options because they qualify as Section 1256 contracts. This subjects them to a 60% long-term and 40% short-term capital gains tax split, whereas SPY options are taxed at 100% short-term capital gains if held under a year. Even a 0DTE trade opened and closed in the same afternoon gets 60/40 treatment. Section 1256 positions are also marked to market at year-end, and wash-sale rules do not apply. SPY options are taxed like ordinary equity options. A trade held under a year is taxed 100% at your short-term (ordinary income) rate, and wash-sale rules do apply. Consider a trader with $20,000 of net options profit in a year, in a 32% marginal bracket with a 15% long-term rate: SPY (all short-term): $20,000 × 32% = $6,400 in tax. SPX (60/40): ($12,000 × 15%) + ($8,000 × 32%) = $1,800 + $2,560 = $4,360 in tax. Same trades, same market, roughly $2,000 saved — purely from the instrument you chose. For a high-volume premium seller, that gap compounds year after year. Tax treatment of options is complex and depends on your situation. Section 1256 generally applies to broad-based index options, but confirms applicability with a tax professional. Dividends: a wrinkle SPY carries and SPX doesn't SPY pays a quarterly dividend. Its price drops on the ex-dividend date, and market makers price that expected drop into the options — call premium tends to sag and put premium firms up ahead of the event. Deep in-the-money SPY calls also face elevated early-assignment risk right before the ex-dividend date, as holders exercise to capture the payout. SPX, being an index, pays no dividend and has no ex-dividend date. One less variable to track. Liquidity and spreads: it depends how you measure SPY options are the most actively traded options in the world. In absolute dollar terms they carry the tightest bid-ask spreads and offer the most granular strike selection, which suits smaller accounts and precise position sizing. SPX spreads look wider in dollar terms, but remember one SPX contract equals about ten SPY contracts — so on an apples-to-apples exposure basis the relative cost is competitive, and you are crossing the spread on one contract instead of ten. At-the-money SPX and SPXW strikes trade with deep liquidity and penny-wide markets during active sessions. A quick word on the ticker: SPX vs SPXW In your option chain you will see both SPX and SPXW. SPX (the classic monthly) is AM-settled — it stops trading Thursday and settles off Friday's opening prices, which introduces some overnight gap risk on the final day. SPXW covers the weekly and daily expirations and is PM-settled off the 4:00 PM close, so you can trade it right up to the bell. If you are trading 0DTE, you are in the SPXW chain. Both get identical Section 1256 tax treatment. XSP Options: The Mini-SPX Alternative to SPY XSP is the Mini-SPX option — it trades at one-tenth of the SPX level (comparable in size to SPY) but keeps SPX's cash settlement, European exercise, and Section 1256 tax treatment. In theory it is the best of both worlds for a smaller account that still wants the tax and assignment advantages. The catch is liquidity: XSP volume is far thinner than either SPX or SPY, so spreads are wider and fills are harder. Worth knowing about, worth checking the chain before you commit. How SPX and SPY Options Behave During a Flash Crash Everything above is theory until you watch it play out in a live position. On Friday, June 26, 2026 — during a jittery week in which JPMorgan (read more on that) had publicly warned of flash-crash risk in crowded AI names — the S&P 500 delivered a textbook demonstration of why the SPX-vs-SPY distinction matters. Right at the 4:00 PM close, a wave of sell orders hit thin liquidity. On a standard 1-minute line chart, nothing looked wrong: the line simply connects close-to-close, and the close held around 731 on SPY. But pull up the 1-minute candlestick chart for that final bar and the story changes completely — a tiny body around 731 with an enormous lower wick stabbing all the way down to 716.58, then recovering, all within a single closing minute. The volume bar on that candle dwarfed everything around it. That's the signature of a flash crash: a momentary liquidity air-pocket where a flood of orders blows through a thin book before buyers step back in and the close resolves. This is a closing-bell liquidity cascade — arguably the single most dangerous moment for this kind of event. At 4:00 PM, market-on-close imbalance orders execute, index rebalancing flows hit, and options-expiration settlement pressure peaks all at once. A large sell imbalance in that window can momentarily overwhelm the order book before the closing auction resolves. Here's where it gets instructive. That 716.58 print was SPY's worst individual tick. But the SPX cash index — pulled from live data — only printed down to about 7,336 in the same minute. At the roughly 10:1 ratio, SPY's 716.58 implies an SPX near 7,232, yet the actual index bottomed 100 points higher. Why the gap? During a flash crash, the ETF and the index decouple. SPY is a single instrument, so a market-sell order blows straight through its book and prints an extreme low. The SPX index, by contrast, is an average of all 500 constituents — and not every stock crashes to the same degree in the same instant. The index is "cushioned" by its own construction. The true dislocation sat somewhere between the two readings, with SPY overshooting to the downside. Now apply this to two hypothetical traders, each holding the same S&P 500 put spread going into that close: The SPY trader watched the ETF physically trade at 716.58 — potentially deep inside a danger zone — and, because SPY is American-style and physically settled, faced real assignment mechanics around any in-the-money strikes, plus the gut-punch of seeing the market trade through their level. The SPX trader settled off the official closing print near 7,354–7,357, determined by the closing auction — not the wick. Even the intraday SPX low of ~7,336 stayed above where an equivalent short strike would have sat. The terrifying wick, however real, never touched a cash-settled position that keys off the close. The lesson isn't that SPX is risk-free — that wick proves the market physically traded at a stressed level, and a stop-loss order resting in that zone would have been triggered, auction or not. The lesson is that cash settlement and European exercise changed the outcome. The same market event that could have been painful in SPY or in stock was, on a cash-settled SPX position, a non-event that expired off the official close. That is the structural edge described in the tax and settlement sections above, made concrete in a single closing minute. The decision framework Lean SPX if you: Trade meaningful size (one SPX replaces ten SPY, cutting commissions and complexity) Have enough capital and margin to handle the larger contract comfortably Run an active income strategy where the 60/40 tax treatment materially lowers your bill Want zero early-assignment risk on multi-leg structures Prefer the simplicity of cash settlement and no dividend exposure Lean SPY if you: Trade a smaller account and need granular position sizing Want the tightest absolute spreads and the widest strike selection Are building a strategy around actually holding shares (covered calls, cash-secured puts as accumulation) Are trading inside an IRA, where the Section 1256 tax edge is irrelevant Are newer to S&P 500 options and want to learn on a smaller, more familiar contract Consider XSP if you want SPX's tax and settlement benefits at a SPY-sized contract — and can live with thinner liquidity. The bottom line SPX and SPY track the same market, but they are not interchangeable. For a serious, active options trader — especially one selling premium or trading 0DTE at size — SPX's Section 1256 tax treatment, cash settlement, and freedom from early assignment give it a structural edge that compounds over time, in your fills and in your tax bill. SPY remains the better tool for smaller accounts, share-based strategies, and IRAs. Many experienced traders end up using both: SPX for tax-efficient premium selling at size, SPY for tactical trades and anything involving shares. The right answer isn't universal — it comes down to your account size, your tax situation, and the specific strategy in front of you. Choose the instrument that fits the trade, not the other way around. The examples above exclude commissions and fees and are for educational purposes only. Options trading involves substantial risk and is not suitable for every investor. Review the Characteristics and Risks of Standardized Options before trading.
 -
That's great to hear — congrats on the BAC fill! And thank you, that really means a lot!
-
Thanks Sarang, really appreciate it! More to come with other analyses. Encouragement like yours on my work helps me move forward!
-
@Romuald first test run was a success as BAC hit 10% target just after open .... that write up is awesome very worthy of a second or even third read ... thanks
-
 Why new developments call for a fresh look at pinning Here are, however, specific reasons to revisit pinning as a retail option investor strategy and the first and foremost of this was the announcement on April 16 by the SEC as reported (in this case) by Schwab: "...Under the new rules, traders will no longer be required to maintain a minimum account balance of $25,000 to engage in frequent margin day trading. Instead, eligible margin accounts of more than $2,000 will gain access to intraday margin buying power set by individual brokerages based on current positions and maintenance margin requirements. Currently, under the old rules, four or more day trades in five business days triggers a "pattern day trader" designation and the $25,000 requirement. Under the new framework, the pattern day trader designation will be eliminated, and day trades will no longer be counted...." (or see this video) 1) The biggest limitation to use pinning or expiry strike price effects was the pattern day trader issue. Inevitably strike price effects whilst usable from the Thursday before expiry to the Friday concentrated on the last trading day. Relatively complex positions are required with three or more legs and therefore pattern day trading was unavoidable. This in turn meant that $25,000 had to be in your account and yada yada. Well this is no longer the case and we can trade freely with most brokers; 2) The advent of 0DTE options has contributed massively to an increase in strike price effects. Older research attributed strike price effects to market makers unwinding massive static open positions built up over month at the crunch time of the 3rd Friday expiry. The effects being strongest at the so called ‘triple witching hour’ when stock index futures, stock index options and stock options would expire (3rd Friday of March, June, September and December respectively). With the multiplication of expiries this has decreased dramatically but the advent of shorter options drives market maker gamma hedging. Positive gamma (net long options) forces market makers to buy shares when a stock drops and the reverse if it rises. This creates a mean-reversion mechanism that drives stocks towards strike price levels. 3) A great deal more study was expended looking at the 0DTE options and they have validated something noted in the 2019 article: mid-strike pinning. At the time it was an empirical observation that stocks prone to pinning sometimes gravitated to the exact mid-point between strikes and pinned there instead. This phenomenon is now known as the gamma wall. Competing hedging behaviour finds an exact equilibrium which causes a pin at the mid-level as every hedge needs to be either over or under the current stock price. As the market is a random phenomenon market, makers cannot choose altogether to go for the one or the other. The stock then becomes stuck in a liquidity pocket halfway between strikes. In other words pinning and strike price effects are alive and well and in fact exploitable more than ever. Strike price effects: pinning, crosses, wild trading Steady Options is a unique service in that it proposes strategies that are typically appropriate for the retail investor. Most of us are unable to harness quant strategies or massive positions exploiting minute arbitrage pricing differences. Many people feel that the game is therefore rigged in favour of big money. Sure, if you go head to head with Goldman Sachs you will be crushed. What else would you expect? It’s like going head to head boxing with Mike Tyson in his prime. The retail investor benefits from his ability to trade small, which means better prices than those opening very large positions. Furthermore, there are certain phenomena like rising volatility towards earnings or the effect of additions to the S&P index that cause predictable effects on elements involved in option pricing. A retail investor can count on those and exploit them where a larger investor would find the market as a whole moving if he attempted the same. Pinning is a phenomenon that certain stocks gravitate towards the strike price of an option on the expiry of that option (generally Friday). Pinning is deemed to occur if the stock price remains (and ends) within 15% of strike spacing. This is an adaptation of Jeff Augen’s approach which used static values to determine whether pinning occurs or not. Nominal Stock Price Strike Spacing Old Static Threshold Dynamic Threshold (15% of Spacing) $40.00 $1.00 $0.40 (Too loose) $0.15 $150.00 $2.50 $0.40 (Perfect) $0.37 $350.00 $5.00 $0.40 (Too tight) $0.75 $600.00 $10.00 $0.40 (Impossible) $1.50 This simple visual from my previous article with a live example by AAPL speaks plainly enough as regards to the phenomenon of pinning itself: Figure 1: APPLE 17 March 2017 Expiry The Y-axis is in dollars representing the amount that the stock was trading away from a strike price. The X-axis represents the number of minutes since trading started (a total of 390 minutes). As noted, a stock can also pin in between strikes – a so called mid-way pin. One needs to analyze specific stocks to make a choice but the phenomenon sometimes takes the shape of the above with a sudden plunge or rise towards a strike. At other times a stock will cross a strike price over and over during the final trading day. Another known strike price effect is the sudden inflation of IV (Implied Volatility) towards the day prior to expiry (usually Thursday) around 4 p.m. and the deflation of that IV in the first half hour of trade on the Friday morning. Same as with our earnings or SPY addition trades, no effect is repeated 100% of the time, in fact even in ideal conditions the effect occurs only 50% of the time. Any strategies must therefore be combined with clear risk limitation tactics taking into account we also know that IV will rise exponentially as we near the bell for ATM strikes. Which stocks are suitable? Broad research shows all stocks are affected – oddly even ones without options – however most option strategies that can be used to exploit them require liquidity and narrow spreads. Here is a list of requirements that need to be fulfilled, ideally in all cases but in any case not massively off target: Liquid large cap optionable stocks with small spreads and a stock price over 100$ or more. The general environment must be one of low VIX – if VIX is high you will get ripped because of underlying market effects. Absence of macro catalysts, so no morning CPO, FOMC, significant earnings by market moving stocks and above all shield us from Trump tweets. Check open interest on the day – it should be heavily stacked on a single psychological strike generally a round number or at least a multiple of 5. This should be quite asymmetric to the remainder of stock open interest at other strikes. The expiry day strike price effects occur over a slightly broader range than my original article averred. You can start looking for effects around 11 a.m. right up to even 1 p.m.. Closing always before the end of day and a minimum of 15 minutes as closing minutes get crazy. If we speak of volatility effects of the end of day before expiry the opening should be around 4 p.m. and closing maximum 30 minutes after the opening. With the proliferation of expiry dates, Friday is not necessarily the only day but liquidity remains the biggest issue. AAPL remains a pinning stalwart and before its company split FDX was the loose electron that would gravitate over and under a strike. GS, MA, NVDA and similar stocks are all worth examining for potential strike price effect opportunities. What option strategies are suitable? In options trading nothing beats being right on direction whatever that direction is, so this includes the stock being stationary. How to exploit that knowledge really has no limit due to the flexibility of options as a trading instrument. Here are just some scenarios with stocks that you believe will pin. The ideas can be tweaked based on the situation. Exploiting the day before expiry This builds on the brief collapse in volatility after 4 p.m. on Thursday, its reinflation on Friday morning and the fall again after 10 p.m. that day. A simple way is the ratio trade for example if the stock is between strikes S and S+1 (the +1 in this case being the next optionable strike not 1$ necessarily). The position is to be opened on Thursday around 4 p.m. if the other criteria for strike price effects (see above) have been met. Buy 10 calls of next day expiry at S Sell 30 calls of next day expiry at S+1 The position should be closed at 10a.m. on Friday and will generate substantial profits even if the stock rises to the S+1 strike price. This is due to volatility decreasing and theta decay. A heavy drop in the stock will be buffered and losses should be manageable. Likewise an unexpected strong rise of the stock is temporarily buffered by the volatility loss and the long underlying position. The position is not proof to all circumstances but simply sufficiently flexible to bail if it goes sideways. If the stock is really pinning at S+1 you should hold till the end as that will maximize profits. On the hand a massive, runaway gap up past represents a maximum risk zone, which is why a disciplined hard exit at Friday's 10 a.m. open is non-negotiable. The classic pin This strategy presumes that you see pin occurring at a particular strike S. As stated, that should become apparent between 11 a.m. to 1p.m. on the expiry day. The lull in trading caused by lunch is helpful to get good prices. Buy 10 calls at S-1 Sell 30 calls at S Buy 20 calls at S+1 or Buy 20 calls S=2 to limit margin and have an open balanced wing butterfly. This position should be closed at the latest 10-15 minutes before the bell when ideally the value of the ATM calls has been bled dry by theta. It relies fully on a real pin at a strike occurring and will lose money in free trading or mid-pin outcomes. A less trade intensive variant is to sell a call or put at S (the pinning strike) and buy the same one week out. You then wait for the short option to bleed its premium whilst the smaller amount of theta bleeding from your long still protects you in case things go sideways. The mid-way pin If you foresee the stock sticking between two strikes one can open an Iron Condor ‘Plateau’ spread (again between 11 a.m. to 1 p.m. on the expiry day). Buy 1 Put at (OR S-1) Sell 1 Put at -1 (OR S) Sell 1 Call at (OR S) Buy 1 Call at (Or S+1) Like all these strategies, you can’t afford to walk away whilst this is playing out but the set-up works in case of a mid-strike pin and if held to (near) the end even if S-1 or S+1 are reached. The biggest issue used to be that not many stocks provide sufficient premium to make it worth one’s while to open this but it is possible with some high volatility high priced stocks. With the current run of high value tech stocks, however, the story is different and IC premiums can be attractive. Utilizing crosses-gamma scalping As mentioned some stocks are known– FDX was notorious for this at least until their stock divestment – for not pinning in a fixed manner but continually crossing a pinning strike either to the upside or the downside. The idea in this case is to utilize the lull in trade as of 11am to 1pm to open a straddle at S if the stock happens to be there. If the stock moves up or down, one or the other side of the spread will make a gain. Occasionally this in itself will be enough to take a profit but usually it is not. The trick is then to delta hedge by either going long or shorting shares to neutralize your delta. Option software to know how many shares to sell is helpful here but one can eyeball it to a degree. Once the stock moves back to S one can close the stock position (or the whole position) and make small gains. Beware of attempting to sell short straddles when the stock is away from S, pinning happens tops 50% of the time so you can find yourself with a huge loss if the stock goes to S+1 or S-2 whilst the profits from all the above strategies are modest. Finding candidates As mentioned above, we need high liquidity stocks with massive option volumes and a clear indicator in the open interest that a pinning situation or crossing is on the books. With the advent of AI, things have become considerably simpler compared to 2019 when the previous article was published. At the time there was nothing for it but to laboriously download data and run analyses through excel on it (at least as a retail investor). With the help of AI we have created a number of little python scripts which can help you. They can be run from python directly if you have that installed but you can also run it in Google Colab. When you run this simple script (see file below entitled simple script), you will be asked to input a ticker, a date for which you want to run the analysis – limited in this case to the previous 4 weeks as the source is Yahoo which is free for that period – and then an entry time. You will get – for example for MSFT – an output like this: So in this example MSFT did a min pin level for most of the trading and a strategy utilizing that and closed in time would have yielded a good result. Historical outcomes do not guarantee a repeated pattern but the idea is to visualize for you how you can identify what the potential pinning level might be and see where trades might have been successful. This can then help you to open positions. The second script (see file below called complex script) is a little more involved, it requires you to have a polygon.io account (free) so that the minute by minute stock data can be downloaded. If you register, your dashboard will give you an API Key that you need to paste in to run it. The script requires 10 minutes+ to run because there is a limit on the amount of data you may download. It gives the following output for, again, MSFT in this case: Note that the values for the option spreads are based on Black & Scholes and not downloaded data. They are not going to be identical to what’s in the market but not a million miles away either. In this case we asked the script to determine the best entry price rather than asking it to pick one as that wouldn’t make sense during a whole year. The outcome is that actually the midday lull – after major morning institutional activity is over – remains the best time to take the jump to open a position. Waiting until at least 12 noon reduces the number of Free Trading outcomes – that is where no perceptible pinning occurred – to 25% or less. What is also clear is that when VIX is higher – i.e. over 16 – more free trading failures occur, whereas below this the number of successful trades is almost double. The cross count column is a powerful indicator of market maker positioning. The distributions across your 39 weeks reveal a stark reality: Intraday Gravity Days: Feature a massive average of 20.2 strike crosses. Classic Pin Days: Feature a clean average of 7.3 strike crosses. Mid-Pin Trap Days: Feature a low average of just 4.4 strike crosses. If you enter a trade during the midday lull and the stock begins to continuously slice back and forth across your target strike, market-maker gamma walls are actively trapping the asset. The heavy volume is forcing a tight mean-reversion around that strike pivot. However, if you establish a position and the stock drifts away without crossing your strike at least twice within the first 30 minutes, the gravity is absent. Given the low cross average on trap days, the asset is likely locked into a clean, low-friction trajectory straight toward a mid-pin hit. For MSFT – based on the last year – a good guide seems to be to open after 12 noon, to avoid ratio strategies if VIX is under 16 but to use an Iron Condor instead. Note that this requires a stock that has a high price – around $300+ although a high beta-stock will also work. Finally, if within 30minutes of opening the trade there are few crosses you should consider that the position might migrate to a mid pin. Change your position in function of that. Finding what works Without boring everyone with the various back-tests that were carried out, analysing stocks with rather different characteristics in the manner described above yielded an interesting playbook of strategies to play. Check the VIX. If it is printing above 20.0, walk away. Institutional fear is too high for pinning to work. If trading a High-Priced Mega-Cap (e.g., MSFT): Check the morning session's realized volatility proxy. If it passes your 17% VIX floor, deploy an OTM Iron Condor (Short Put / Short Call). It provides an airtight, 100% historical safety net. If trading a Mid-Priced, Low-Beta Tech Asset (e.g., AAPL): Completely avoid the OTM layout—the market won't pay you enough to justify the margin. Instead, deploy the ATM Iron Fly to harvest a premium cushion that neutralizes the mid-pin traps. If trading a High-Beta Volatility Outlier (e.g., FDX): Again deploy the OTM Iron Condor. The asset's native whipping action guarantees a good premium payout to sit safely behind a wide strike wide protective boundary. Remember also that the cross-count is a key indicator whether things are going as you expected or not. This is not a fire and forget kind of strategy but one where you sit behind your computer and watch the skies err... the market. Conclusions Pinning is alive and well and there are opportunities for retail traders for the very good reason that institutionals cannot profitably trade such tiny volumes easily. Whether it is a good strategy does depend on the environment and low VIX at the minimum is required or it becomes too risky. Oddly, another factor that is important is the high prices of current high liquidity stocks – this facilitates the use of Iron Condors or Iron Flies which can show excellent outcomes based on holding a position for just a few hours or less. As usual, you do have your eggs in one basket so you’d better watch that basket. In 2019 we estimated a 6% per month return was possible taking into account inevitable losses. With the refinement and encompassing of mid-pin outcomes which enables us to be >60% in having a pin, mid-pin or mid-day gravity outcome, we should have better results than before.
 -
Good morning Romauld, Great Analysis and discussion! Thank you. Sarang