SteadyOptions is an options trading forum where you can find solutions from top options traders. Join Us!

We’ve all been there… researching options strategies and unable to find the answers we’re looking for. SteadyOptions has your solution.

Volatility Trends in the DJIA


Options traders focus, often too much, on implied volatility to estimate the next change in option valuation. Is this always a wise policy? Options are derived from volatility in the underlying security (thus the term derivatives), a good question is: Why not focus on volatility trends in the underlying (historical volatility) to judge likely future valuation trends in options?

Traders trends to be absolute in their faithfulness. They might believe in tracking the Black-Scholes pricing model even with its well-known inaccuracy, or in calculating implied volatility even with its questionable and unknown quantity called “risk-free interest rate.” Anyone who disagrees with adherence to these methods is considered a heretic.

Another sect of the options faithful relies on underlying volatility to judge option valuation and also to time trades. This group looks for trends in historical volatility in order to time trades. Because volatility goes through cycles, with decreases following increases and vice versa, timing based on historical volatility is a reasonable tactic in deciding when to enter or exit trades.

The simplified “rule” is to sell options when volatility is high (because this also means option premium is rich) and to buy when volatility is low (because option premium tends to be depressed), so traders using timing based on historical volatility – assuming comparisons are made based on similar moneyness and expiration timing – is not unreasonable.

For example, look at how the Dow Jones Industrial Average (DJIA) has been behaving recently. The financial news announces the biggest-ever price drop in a single day, the loss of billions of dollars in market value, and the gut reaction of the market to economic news. But from a technical point of view, does any of this matter for the long term?

The Dow, we should remember, is not a singular market force, but the net of 30 different  companies. These may move through volatility cycles in a similar and collective manner, as seen recently, but traders also have to remember the often observed reality: Volatility changes, but it also goes back and forth over a period of time. For example, look at the six-month chart for the DJIA.


image.png


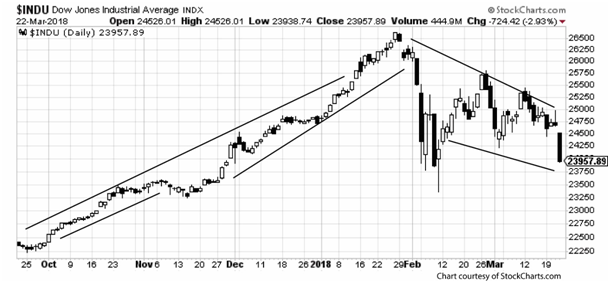
For the first four months shown on the chart, the channel was exceptionally narrow, and the price trend was remarkably consistent. Given that the value of the index is between 22,250 and 26,500 on this chart, the 500-point channel was remarkable over a four-month period.

The last two months presented a different story. The trading range was as high as 3,000 points and even when the early February volatility settled down, the bearish  channel narrowed only slightly, with recent trading range about 1,250 points.

The change in volatility is noteworthy – and visible. For those traders deeply concerned about the “end of the trend” and the unexpected explosion in volatility, it is worth remembering that volatility itself is cyclical, just like price direction. These big moves over 1,000 points over only a few days is unlikely to continue indefinitely. Volatility will calm down once the impact of recent news is absorbed. The president’s decision to impose tariffs on Chinese imports is deeply concerning to the markets, but this economic news tends to have only short-term impact on volatility.

The news dominates equally important economic news including reduced tax rates, improved employment news, and much more. We also cannot know the outcome of the possible tariff war. Since it benefits no one, it could be that tariffs will be canceled with a revised trade agreement, and that the long-term impact on the markets will be positive rather than negative.

The situation at the moment, in which depressed stock prices have caused panic and retreat from the market among many institutions and individuals, is a passing volatility trend. The unending tendency to “buy high and sell low” (instead of the other way around) repeats itself time again. For options traders who are aware of the evolving nature of historical volatility, when the markets are unsettled as they have been in recent weeks, this presents an exceptional trading opportunity.

Options traders who consider themselves hedger rather than speculators, and who act as contrarians, will be able to recognize the opportunity this market presents. High volatility is “bargain-hunting season” for options traders, based on the easily observed changes in historical volatility.


What Is SteadyOptions?

12 Years CAGR of 122.7%

Full Trading Plan

Complete Portfolio Approach

Real-time trade sharing: entry, exit, and adjustments

Diversified Options Strategies

Exclusive Community Forum

Steady And Consistent Gains

High Quality Education

Risk Management, Portfolio Size

Performance based on real fills

Subscribe to SteadyOptions now and experience the full power of options trading!
Subscribe

Non-directional Options Strategies

10-15 trade Ideas Per Month

Targets 5-7% Monthly Net Return

Visit our Education Center

Recent Articles

Articles

  • SPX Options vs. SPY Options: Which Should I Trade?

    Trading options on the S&P 500 is a popular way to make money on the index. There are several ways traders use this index, but two of the most popular are to trade options on SPX or SPY. One key difference between the two is that SPX options are based on the index, while SPY options are based on an exchange-traded fund (ETF) that tracks the index.

    By Mark Wolfinger,

    • 0 comments
    • 889 views
  • Yes, We Are Playing Not to Lose!

    There are many trading quotes from different traders/investors, but this one is one of my favorites: “In trading/investing it's not about how much you make, but how much you don't lose" - Bernard Baruch. At SteadyOptions, this has been one of our major goals in the last 12 years.

    By Kim,

    • 0 comments
    • 1,299 views
  • The Impact of Implied Volatility (IV) on Popular Options Trades

    You’ll often read that a given option trade is either vega positive (meaning that IV rising will help it and IV falling will hurt it) or vega negative (meaning IV falling will help and IV rising will hurt).   However, in fact many popular options spreads can be either vega positive or vega negative depending where where the stock price is relative to the spread strikes.  

    By Yowster,

    • 0 comments
    • 1,410 views
  • Please Follow Me Inside The Insiders

    The greatest joy in investing in options is when you are right on direction. It’s really hard to beat any return that is based on a correct options bet on the direction of a stock, which is why we spend much of our time poring over charts, historical analysis, Elliot waves, RSI and what not.

    By TrustyJules,

    • 0 comments
    • 808 views
  • Trading Earnings With Ratio Spread

    A 1x2 ratio spread with call options is created by selling one lower-strike call and buying two higher-strike calls. This strategy can be established for either a net credit or for a net debit, depending on the time to expiration, the percentage distance between the strike prices and the level of volatility.

    By TrustyJules,

    • 0 comments
    • 1,818 views
  • SteadyOptions 2023 - Year In Review

    2023 marks our 12th year as a public trading service. We closed 192 winners out of 282 trades (68.1% winning ratio). Our model portfolio produced 112.2% compounded gain on the whole account based on 10% allocation per trade. We had only one losing month and one essentially breakeven in 2023. 

    By Kim,

    • 0 comments
    • 6,321 views
  • Call And Put Backspreads Options Strategies

    A backspread is very bullish or very bearish strategy used to trade direction; ie a trader is betting that a stock will move quickly in one direction. Call Backspreads are used for trading up moves; put backspreads for down moves.

    By Chris Young,

    • 0 comments
    • 9,871 views
  • Long Put Option Strategy

    A long put option strategy is the purchase of a put option in the expectation of the underlying stock falling. It is Delta negative, Vega positive and Theta negative strategy. A long put is a single-leg, risk-defined, bearish options strategy. Buying a put option is a levered alternative to selling shares of stock short.

    By Chris Young,

    • 0 comments
    • 11,516 views
  • Long Call Option Strategy

    A long call option strategy is the purchase of a call option in the expectation of the underlying stock rising. It is Delta positive, Vega positive and Theta negative strategy. A long call is a single-leg, risk-defined, bullish options strategy. Buying a call option is a levered alternative to buying shares of stock.

    By Chris Young,

    • 0 comments
    • 11,935 views
  • What Is Delta Hedging?

    Delta hedging is an investing strategy that combines the purchase or sale of an option as well as an offsetting transaction in the underlying asset to reduce the risk of a directional move in the price of the option. When a position is delta-neutral, it will not rise or fall in value when the value of the underlying asset stays within certain bounds. 

    By Kim,

    • 0 comments
    • 9,983 views

  Report Article

We want to hear from you!


There are no comments to display.


Create an account or sign in to comment

You need to be a member in order to leave a comment

Create an account

Sign up for a new account. It's easy and free!


Register a new account

Sign in

Already have an account? Sign in here.


Sign In Now

Options Trading Blogs