

kvn86
-
Posts
232 -
Joined
-
Last visited
-
Days Won
2
kvn86's Achievements
Advanced Member (4/5)
50
Reputation
-
Chartaffair.com - RV Charts & Backtesting for Steady Options
kvn86 replied to Christof+'s topic in Promotions and Tools
Hi @Christof+ I am trying to look for ABNB but it says the following: Could you help look into this please? Thanks
-
Chartaffair.com - RV Charts & Backtesting for Steady Options
kvn86 replied to Christof+'s topic in Promotions and Tools
CRWD and ZM look like they've been fixed...thank you @Christof+ -
Chartaffair.com - RV Charts & Backtesting for Steady Options
kvn86 replied to Christof+'s topic in Promotions and Tools
Hi @Christof+ I am trying to look at CRWD and it looks like some of the recent cycles are missing from the calendars chart - could you help please? I am also seeing the same thing for ZM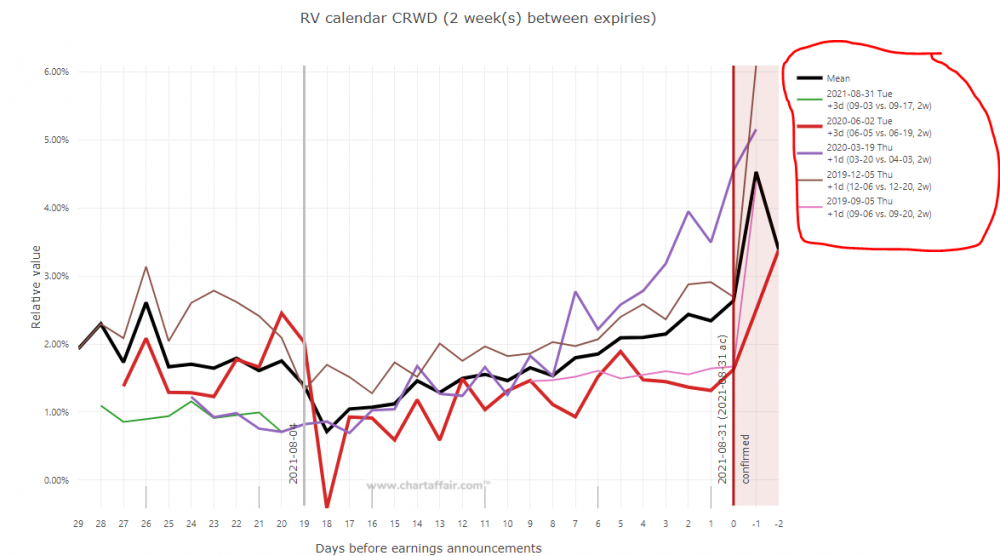
-
Chartaffair.com - RV Charts & Backtesting for Steady Options
kvn86 replied to Christof+'s topic in Promotions and Tools
Thanks @Christof+ Based on the current fields, what would then be the best way of understanding which stocks are potential candidates for calendars in terms of value (in your opinion)? The only field I am using is the "Cal Rise" field, but my understanding is that it still doesn't say whether current RV is a cheap or not. Can I also ask you another basic question around the following stat found on the earnings chart page: what is the difference in the two sets of numbers eg -0.2308 and -2.83%? This is for INTU, with average RV at T-15 = 7.5% and T-0 = 4.05% I can see -0.2308 = (4.05- 7.5) / 15 But if I do (4.05/7.5 -1) / 15 = - 3.06% ..........which doesn't tie up with -2.83%. Is my interpretation of the calculation completely incorrect? Thanks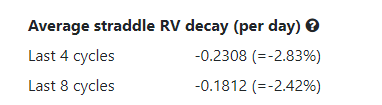
-
Chartaffair.com - RV Charts & Backtesting for Steady Options
kvn86 replied to Christof+'s topic in Promotions and Tools
Hi @Christof+ I've just signed up to your tool and it's great so far. Looking at the column "RVrel", are you considering adding a version in for calendars? I guess it would be nice to be able to compare current cal RV to average RV, just ;like the RVrel field for straddles. Apologies if it doesn't make sense to do this! Thanks
