Andre
-
Posts
127 -
Joined
-
Last visited
-
Days Won
4
Content Type
Profiles
SteadyOptions Trading Blog
Forums
Everything posted by Andre
-
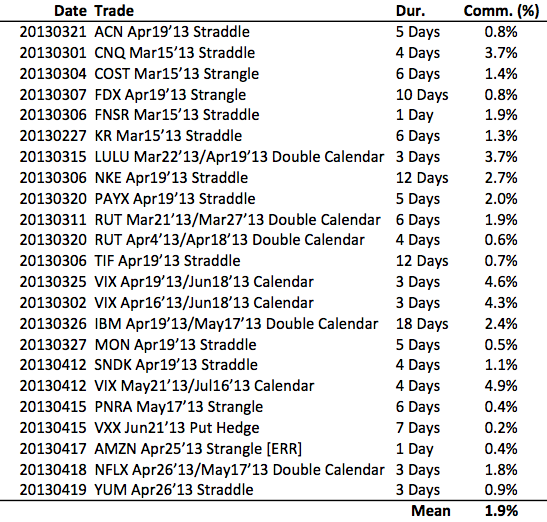
Sorry for the comment spam. Here's my data from March and April: I think your numbers are mostly right if you just consider ordinary straddles. It's the VIX calendars that skew the numbers. Edit: I should note that this isn't very scientific. I'm just dividing the commissions by what was my mental allocation that month, not the exact cost of each trade. So your numbers are likely to be more exact.

-
Wait — at first I thought my numbers actually agreed with you, but then I reread your comment more carefully. You're saying it should be around 1% per trade? In which case, it was double for me in March, and 2/3 more in April. This is IB. Commissions per month depend on the number of trades, so it's not a good reference.
-
Thanks for not letting me spew numbers off the top of my head. In March, I paid an average of $65 per trade, on a 3.2k allocation. So that's 2.0%. In April, I paid an average of $57 per trade, on a 3.4k allocation. So that's 1.7%. And this includes those very expensive VIX calendars and the occasional dollar trade.
-
Thanks. I wish there was an easier way, strange that TOS doesn't implement something so simple.
-
Thanks for that. I use TOS a lot though, can any TOS users chime in as well?
-
Hi everyone, Do you know of an easy way to plot the price of straddles, strangles, verticals, etcetera, in either ToS or IB? I'm not talking about the P/L charts, but the actual historical value of complex orders. I can't seem to find it. Thanks in advance