salliah
-
Posts
8 -
Joined
-
Last visited
salliah's Achievements
Newbie (1/5)
0
Reputation
-
Chartaffair.com - RV Charts & Backtesting for Steady Options
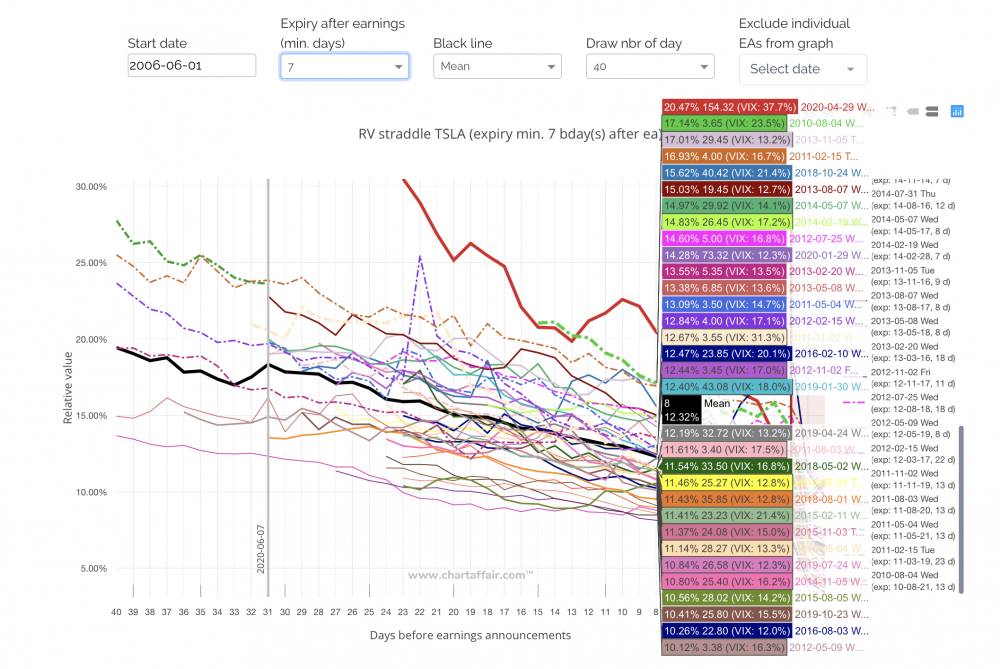
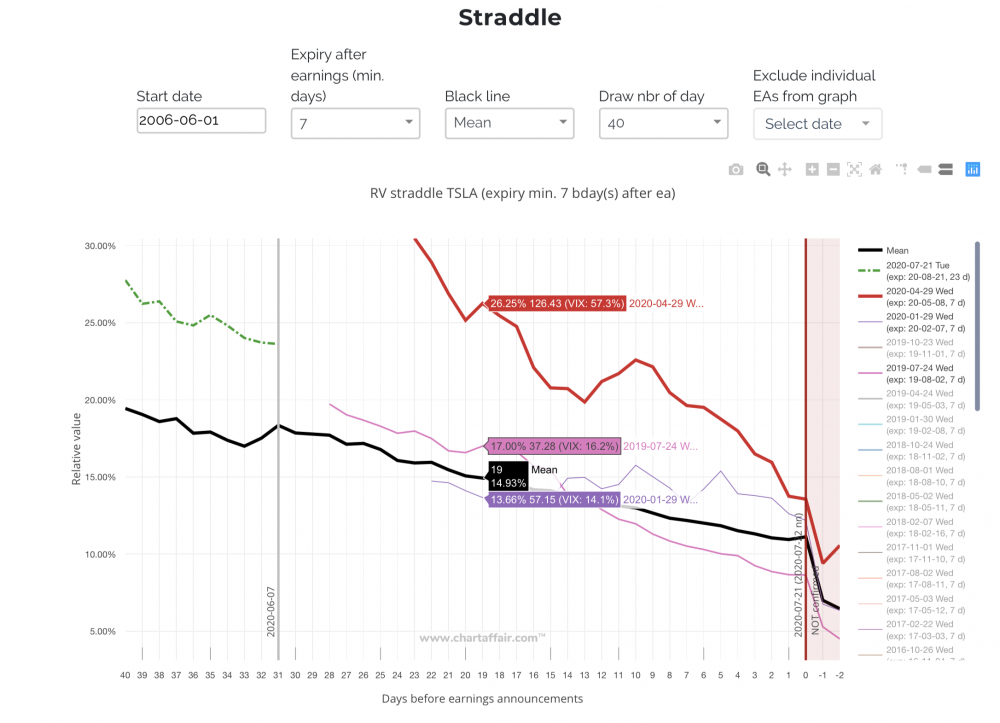
salliah replied to Christof+'s topic in Promotions and Tools
Hello, I just subscribe the service of Chartaffair.com, but sorry that I cannot understand of RV straddle chart though I tried to read the forum of <RV Charts : Volatilityhq.com Official Thread> and <Tools To Analyze The Earnings Trades> which I hope I could get some hints: Basically the RV (relative value) chart displays the RV of a straddle or a calendar, and helps determine how cheap/expensive a strategy is compared to previous cycles. RV straddle = straddle price / stock price RV calendar = calendar price / stock price colour tap (the 1st picture) Regarding the colour tap, I would like to take 1st & 2nd lines shown the screencapture as an example: - 20.47% 154.32 (VIX 37.7%) : 2020-4-29 W - 17.14% 3.65 (VIX 23.5%) : 2010-8-4 W How do I interpret those data mentioned above? - I guess 20.47% & 17.14% = straddle price / stock price, but what is the meaning of the figure "154.32 & 3.65"? the data in gray colour shown right column (pic 2) Regarding the data in y axis right column, I would like to take the 1st, 2nd and 3rd lines shown the screencapture as an example: - Mean : 19, 14.93% <--- What do it mean? - 2020-07-21 Tue (exp: 20-08-21, 23 d) <--- It believe 2020-07-20 is the day before next earning, but why it show 23 days while other lines showing 7 days (which I choose 7 expiry after earnings)? - why each line (green, red, pink, and purple) start from different points? What meaning should I get from the graph? SORRY that I might ask a questions too basic to answer, but I did try to read different posts and hope I can understand the conversation. Unfortunately, I cannot grasp the idea... Thank you for your help in advance.