

yalgaar
-
Posts
209 -
Joined
-
Last visited
Content Type
Profiles
SteadyOptions Trading Blog
Forums
Everything posted by yalgaar
-
I sure did buy/sell on the same day due to human error that need to to be fixed. But I sure didn't do this 4 times in 5 business days. Thanks for the details.
-
I did open and close something due to a human error situation. I guess that is why it got flagged. Thanks for confirming. I had decided on $1000 since I was going to only trade the Hedged Straddle and nothing else because that is what I have spent most of my time learning.I guess I will just have to re-think on how I want to proceed now.
-
Is our trading considered as day trading? I read the FINRA definition and its just confusing to me. TOS just told me they have removed the flag on my account but put it back if they see me as a pattern day trader. If this is the case, I guess the only option would be to deposit 25K. I just didn't want to go that route until I was confident about certain things.
-
I have experienced a Roadblock on my path of learning and growing. I would appreciate any suggestions or ideas to clear this block. So I subscribed here and instantly realized that this is an ocean of knowledge and information which is must to pursue any real Options trading results. So I just read and learnt as much as I could for several weeks. I opened account with TOS and started paper trading the official trades. Only Hedged Straddles for now. I soon realized paper trading is completely useless for me. It may be useful for someone who is a complete beginner in Options trading ( I am not) I know about most trading strategies and legs and greeks and stuff...I just never figured out a consistent way to profit thought. I reason I said paper trading is useless is because the fills are not real. You can very easily get filled in paper trading on TOS but you would never get those same prices in real. I can easily make 100% everyday on Paper Trading! 🙂 I also contacted the their support but that didn't get anywhere. That was all about why Paper Trading was not a way...so I deposited $1000. I didn't want to invest real money until I actually understood all dynamics of the trades we take but I had to make that call. My bad luck, the first trade I took was a loser! I believe the last 6-7 trades before the one I took were all winners. 🙂 It does hurt your confidence when that happens. Now TOS will not let me trade anymore. Some day-trading limitations having to do with $25000 balance. I am really not ready to invest $25000 into something that I am don't clearly understand 100%. But I don't want to stop here. Please suggest how do I proceed from here?
-
Based on what you are posting, your assumption is correct....not sure why you say it is incorrect. When you chose ATM, you made around 200% profit, when you chose the strike where you knew price would go....you made exact 300% profit.
-
@zxcv64 @Kim @Yowster Thank you all. I believe I understand the reasons for around 25% returns for the month of Jan and Feb as well as around 3% returns for March April. The most important thing is these are based on real trades on live accounts with real fills. So even with 3% in these market conditions is amazing returns! I am just so excited to learn all these methods and have similar returns on my LIVE accounts....hopefully soon. I am currently only focussing on the Straddle/Strangle and the Calendar Strategies. My intention is to understand why each trade is taken and all the dynamics around it. I am still not where I want to be with respect to understanding it to the level I would feel comfortable to take trades on real money accounts. Hopefully soon....... Thanks again all of you!
-
@Yowster Thank you very much for the detailed explanation about this.
-
I do absolutely wonder that and I am amazed at how everything is done here. The Trades taken, the discussion, the reporting etc. etc. Thanks for your suggestions. I appreciate it.
-
@Kim @zxcv64 I am not sure why am I being asked to have a reality check!! I never mentioned in my post my expectation is 3% per month or 25%. As far as my expectations are concerned, at this point in time I expect to make nothing but gain knowledge and It seems like I am in the right place to get that. IMO 3% a month is an amazing ROI. Hopefully I have made it clear that I am not expecting to make 25% a month ROI. To me that would be extremely naive. Back to my the purpose of my post, I am trying to understand why such a huge difference in performance? Is there an opportunity to learn from this and change certain things about how we are trading here and use it to our advantage.
-
I noticed the Performance for the month of March was 3.3% and based on Performance for April so far, the numbers most likely will be around 3% as well. The months of Jan and Feb were relatively very good. Performance was around 25% for both months. I would like to understand what are re reasons for such a difference in Performance between these months? Is this something that can be defined? Wanted to understand the kind of Markets where the Strategies that are traded thrive and/or when they do not perform so well?
-
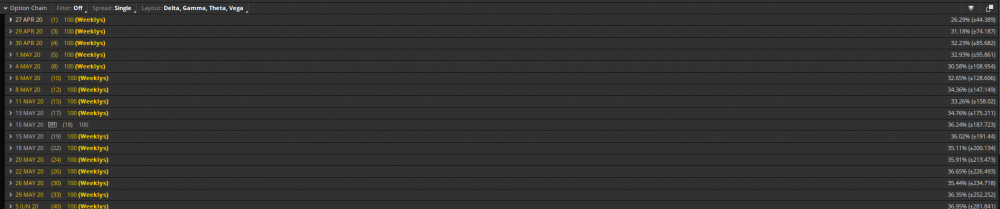
I got a bit confused about Implied Volatility and suggested movement for a certain Option Chain on TOS platform. Can someone help me understand the relationship between the 2? Example: Lets look at the 11 May Chain below. It shows that the IV is around 33.26%. But the suggested move for this is around 158. How are these 2 numbers related? Can I derive 1 from the other? Based on the formula I am aware of it should be 2836 X 33.26% X sqrt of 15 / sqrt of 365 = 191 Why does it show 158 instead of 191?
-
Newbie to this community and came across this thread while looking for all the tools needed to understand and eventually trade steadyoptions. @Christof+ Can I also get a trial please?
-
OK. I wanted to confirm since I was not sure if the tools mentioned before were must and if the multiple tools mentioned were options or all must. So far I have gathered the following tools needed to be able to analyse the Trades taken by "SteadOptions" strategies. Want to ensure I got this right. I want to understand what is my business expense per month for tools and subscriptions. 1) Steady Options Subscription. 2) ONE Software. 3) chartaffair.com 4) volatalityhq 5) Optionslam.com Did I get this right? Any more tools needed? Are all the above needed?
-
Hello Kim- Do you use any other tools besides the ONE software to be able to decide on the trades? I know you mentioned OptionSlam in 1 of your post, I wonder what else is needed to understand the Steady Options Trades. Want to get an idea of monthly cost for this. I am treating this as a business and investing on financial education but nice to know the running monthly expense for the same.
-
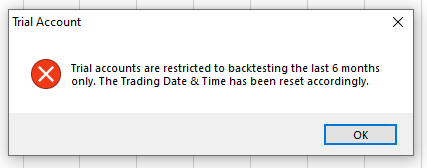
Just checked again. It does limit you to 6 months back testing. I get the following popup when I attempt to go beyond 6 months. Also after looking further into the pricing structure I found the following: They charged me 10 GBP for 1 month trial and then they will charge me 150 GBP for 3 months. With SteadyOptions Link, they would charge 25 GBP for 1 month trial and then 135 GBP for 3 months.
-
I have been playing with it all afternoon. I just love it even though I am just getting started. Do you recommend any videos that goes over all the features of the software? Also I noticed it won't let me go before around Oct 2019. Is it due to Trial version?
-
I thought I did, but on further investigation it seems like I didn't do it correctly. I will check with their customer support to make the adjustments.
-
OK. Thanks. I just bought the subscription. Which version do you use currently? The stable 1.28.27 OR the Beta 2.0.54?
-
Can someone recommend a stock screener tool? There is so much out there when I google I still can't get some of the very basic features that I need. At the minimum I would like the screener to show me the following: 1) Top Gainers / Top Losers 2) Top Gainers / Top Losers (from various Indices) 3) Filter based on Liquidity 4) Filter based on Market Cap.
-
Where can I find this? Is there a particular one you recommend?
-
I am a new member to this amazing community and enjoying learning. I realized Straddles and Calendar Strategies are the bread and butter for SteadyOptions trades. I am overwhelmed with all the information and learning on this and have decided to narrow down my focus and have decided just to master these 2 strategies and spend time as much as I can. That said what are the must have tools to understand why certain trades are taken? I would like to understand how we look for a potential trade and how we decide to go for a specific trade? Do I need to buy any paid subscription or do I need to install any software free or paid to be able to achieve my goal? Basically what are the must have tools to master the in and outs of the 2 Strategies?
-
I found it. It was right in this "General Board" https://steadyoptions.com/forums/forum/topic/5914-2019-year-end-performance-by-trade-type/ Still getting used to finding all information.
-
I remember coming across a page that showed breakdown of all the different strategies used each year. It showed how many trades were taken using Straddle, how many calendar. etc etc. I am not able to find that page? Can someone please kindly send me the link?
-
Thanks for your reply. What you mentioned makes total sense.
-
I am a new member and have been reading all the material here several hours each day to understand everything in depth. I could not find or figure out the right way to allocate contracts while Opening a new position based Steady Options Trade. Let us take an example of the following trade so I can explain better: T hedged straddle at 9.10 debit Posted Apr 09 2020 Buy to open 5 T Apr.24 30.5 put Buy to open 5 T Apr.24 30.5 call Sell to open 2 T Apr.17 30 put Sell to open 2 T Apr.17 31 call The allocation on the above trade is based on a $10,000 account. All is well if I had a $10,000 account as well. Even if I had a $20,000 account no issues. I would just double the contract size. i.e 10 contracts for the Long and 4 contracts for the short side of the trade. The challenge is when my fund are in between $10,000 and $20,000. Let us know my funds with exactly $14,000. How would I allocate in this case? If I allocate it based on $10K then I am not using the full potential of my funds....and it would feel like $4000 are just sitting and doing nothing. If I allocated based on$20K I might be taking more risk than what I should be taking or I would want to take. Also I would like to mention that the performance page seems to calculate returns based on allocation perfectly to $14000. But I believe I will not be able to achieve the same results. Please let me know your thoughts?


