

Maji
-
Posts
713 -
Joined
-
Last visited
-
Days Won
7
Content Type
Profiles
SteadyOptions Trading Blog
Forums
Everything posted by Maji
-
I am glad that things did not get worse but I am sorry to hear about your losses too. On a lighter note, you were just too big to fail and TT helped you out. It is a lesson to all of us... stick to position sizing.
-
Someone in my family wants to learn swing trading stocks. Is there any suggestions from the community? Thank you.
-
Congratulations to @Yowster. His insights and suggestions has helped me and I am sure many other members here.
-
You are a Caucasian Texan in the investing industry and you have a liberal slant!! Are you an unicorn?
-
@Rob by demo you mean paper trading account?
-
TT does not have charting of spreads... they are “working “ on it is what I hear from their customer support.
-
Based on what I read on IB's website, if I fill in an account opening paperwork, I am allowed to start paper trading. After I fund the account, I will then get to live trade... obviously! My question is: 1. If I don't fund my account, how long can I have the paper trading account? 2. Does the paper trading account have live streaming quotes or are they delayed? In reality, I am just trying to find a way to plot the intraday charts for mainly calendar spreads. I trade with TT and don't have that ability. I also don't need live data, I can just plot the intraday charts at the end of the day and check what the general minimum and maximum values of the Mid prices. If someone knows a better way that is free, please let me know. Thank you.
-
I believe IB has intraday options spreads charts where you can plot the mids of calendars etc. Is that possible on ThinkOrSwim or on TastyTrade? Thank you.
-
Bye but hope to see you back soon.
-
I never put real money to test it. The stop losses can get triggered more frequently than the deltas suggest during gyrations we are seeing currently.
-
Congrats... you won a small lottery... now time to buy Lotto tickets
- 1716 replies
-
- 1
-

-
- pre-earnings
- trade machine
- (and 1 more)
-
man... you are brave to take up those trades...
-
No he did not... I guess that is something he found out through backtesting...
-
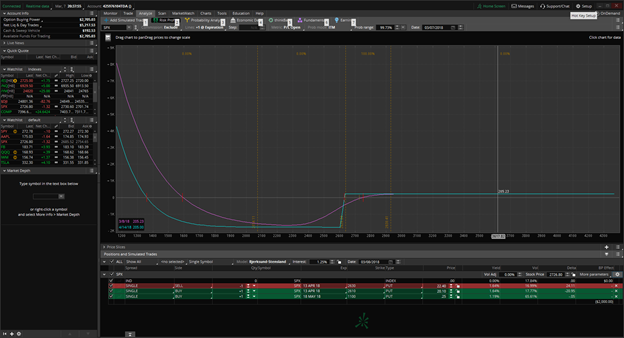
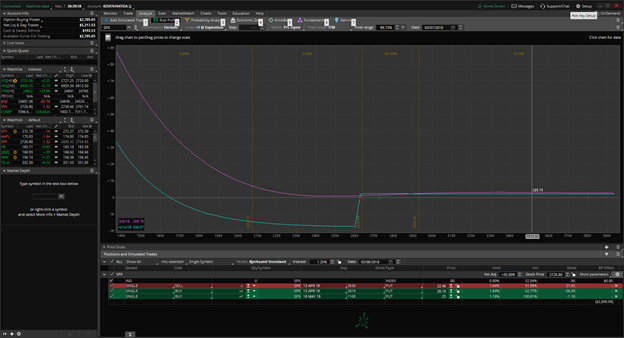
@CPO... please take a look at the second image in my initial post. The purple line shows that the spread is making money even when the market is crashing as the IV has increased. Compare it with the first picture. The risk is around $1800 per spread and the reward is $200. So, in order to prevent those kind of large losses, the deep OTM put comes to use. Actually, the person who made the presentation showed his PnL curve during last February's mini market crash..
-
@scubaskeeter The protective puts are really in case of crashes... they are basically cost of doing business. For SPX spreads, where each spread risk is $1800, a $20 insurance is cheap. For the sake of the system, a May 18, 120 Put for 0.02 will be the insurance. Remember, this will not protect you from the normal stop loss being triggered, but will come into play if the market crashes and the market has gone through your stops. The elevated volatility will increase the cost of this put which will help to offset that loss.
-
As AT is a subscriber only system, I can't tell you the details. The concept is there but not exactly. Also, in its current form, it does not use covered calls to pay for the long puts. You should ask for a free trial and see if it works for you. Good luck.
-
You should look at the Anchor Trades system. It does what you are looking for in a systematic fashion. Good luck.
-
If you are in the markets all the time, you may still not be able to match SO performance unless you put in effort to learn the systems. If you want to blindly follow the system, then I don't believe you can make similar profits as the official SO trades, whether you are there three hours or more. Good luck.
-
@greenspan76 thank you for posting your findings. I do not follow this thread on a regular basis, so please pardon my ignorance. Do you trade mainly the long calls before earnings? If you do, what delta do you trade? Any other entry/exit criteria you follow? Thank you.
-
Each one is about 2000 minus 200 = 1800 dollars. You are correct, I meant 75-80 deltas away.
-
@CPO I believe they had records for two years. Would like to see chop performance myself too.
-
I attended a webinar based on an invite and saw a system of incorporating credit spreads including some protection in case of large moves to the downside. Basically, if there is a spike up in volatility due to a market meltdown, the system may even generate a modest profit or allow for exit with a small loss. The system is designed for the SPX but I will be testing it on SPY for a few weeks to see if I want to jump into SPX with it. Also, for the SPY, I won’t include the downside protection because the exposure will be small in absolute dollar terms and the commissions will be large compared to the cost of the protection. I am assuming everything is SPY will be 1/10 of SPX. Here are the rules: 1. If this is the first trade then determine if the SPX is in an uptrend or downtrend. Nothing fancy, just look at the chart and see. From what I see, the SPX is in an uptrend (There you go, I have called the top 😊). 2. Sell a 20-point credit Spread on SPX (2 point for SPY). Sell put spread for bullish case, call spread for bearish case. 3. Make sure you get at least a credit of 2.20 for SPX. The distance of the short strike will be determined here. Try to maximize it from current price but ensure that you get at least 2.20 credit for a 20-point spread. From empirical observations, it appears that these are about 75-80 deltas or something near there. Do not try to get too much more than this credit as it will move you to a closer strike than the system anticipated. 4. Use options with expiration ideally around 35 days. 5. The profit target is entire credit collected as the spread expires OTM. 6. Stop Loss is when the debit to close the spread has increased to 6.00 (based on bid). That means the loss is 3.80 for the SPX. 7. Place trades every two weeks. If the latest spread is making money then place trade in the same direction. If it is underwater, then place the trade in the opposite direction. If you exited the last trade due to a stop loss then you need to use some judgement. If you believe the market will move up, then sell a put spread, if not, then go with a call spread. 8. For SPX put credit spreads, buy a long Put for 0.20 with 60-75 days to expiration. Basically, this is insurance and will expire worthless most of the times. However, during large spikes downwards, there is Vega inversion and these will help to mitigate the losses as the markets won’t honor the stop loss during those times. According to the webinar presenter, the win rate was around 80%. Thus, expectation is 0.8*(2.2-0.2) – 0.2*3.80 = +0.84. If, I use 0.75 as the win rate, then expectation is +0.55. For options with the deltas mentioned in the rules, a 0.75 win rate appears reasonable. For SPY, sometimes corresponding strikes may not be available. In some cases, the SPY options for the required dates have strikes with 2.50 separation. For practice purposes, I am thinking of locating the short at the SPX or near there and the long will be the nearest strike 2 or 2.5 away. For this example, it will be 257.5/255 instead of 2580/2560 for SPX. The purpose is to get a feel for the market. The transaction costs for the SPY will end up being higher than the SPX any way and can't be traded on a regular basis unless you have a free or a very low commission deal. Maybe someone can back test the system and let me know. My Scottrade account recently got transferred to TDA and now I have access to TOS platform. I am not familiar with it but I was able to simulate the trade and then spiked up the volatility and it showed how the curve moved up with the increase in volatility allowing us to probably close the trade at breakeven or smaller loss in case of those large moves. The screenshots for the PnL for two cases are shown below. The first one is with the volatility at the current level. In the second case, the volatility is bumped up by 35%. You can see that the magenta line moves up the zero line, showing that we may be able to liquidate the spread for a breakeven or maybe for a small loss. For normal down moves, the stop loss can be honored but for the catastrophic down moves, we need this kind of protection. Also, if you have any comments please post here. I am not sure if I can answer all your questions but I am hoping to learn and add another system to our arsenal.
-
Here is a table from Optionslam that lists the post earnings move by TGT. EARNINGS DATE PRE-EARNINGS CLOSE POST-EARNINGS OPEN PERCENTAGES REPRESENT PRICE CHANGE RELATIVE TO PRE-EARNINGS CLOSE FOR SPECIFIED NUMBER OF CALENDAR DAYS PRICE PERC% 1 DAY 3 DAYS 5 DAYS 8 DAYS 13 DAYS 21 DAYS 34 DAYS 55 DAYS Tue 03/06/2018 BO $75.14 $74.25 -1.18% -4.45% N/A N/A N/A N/A N/A N/A N/A Wed 11/15/2017 BO $60.09 $56.26 -6.37% -9.86% -3.24% -3.24% -4.32% -7.07% 3.51% 6.64% 11.79% Wed 08/16/2017 BO $54.35 $57.00 4.87% 3.6% 2.39% 2.39% 3.88% 0.16% 5.51% 8.72% 3.49% Wed 05/17/2017 BO $54.53 $56.96 4.45% 0.93% 2.67% 2.67% -0.73% -0.23% 0.09% -5.17% -7.97% Tue 02/28/2017 BO $66.91 $57.41 -14.19% -12.16% -13.39% -14.28% -17.59% -17.26% -18.74% -17.51% -18.12% Wed 11/16/2016 BO $71.44 $77.50 8.48% 6.42% 6.64% 6.64% 9.85% 8.79% 7.46% 7.83% -0.01% Wed 08/17/2016 BO $75.48 $70.48 -6.62% -6.42% -7.1% -7.1% -4.96% -5.86% -7.12% -8.73% -8.77% Wed 05/18/2016 BO $73.61 $67.48 -8.32% -7.62% -6.72% -6.72% -5.88% -6.39% -7.29% -7.63% -1.45% Wed 02/24/2016 BO $73.98 $74.39 0.54% 3.98% 6.0% 6.0% 9.6% 9.23% 10.35% 11.9% 12.74% Wed 11/18/2015 BO $72.91 $71.64 -1.74% -4.29% -2.85% -2.85% 0.34% -0.56% -0.34% -1.64% -0.67% Looks like the average 8 day move (taking the highest and lowest out) is around 4% ish. Those are nice gains for a 4% move.
-
Maybe I should take the credit It is a tongue in cheek comment, so take it in that spirit. I kept on complaining and emailing them screenshots and lists of trades that I did not get filled when others here got filled even when I placed the trade earlier than them... thanks to the various members here who shared the screenshots of their fills so that I can send it to Tasty.
- 92 replies
-
- 1
-

-
- tastytrade
- tastyworks
- (and 1 more)
-
@cwelsh I use Tastytrade and their fills have been worse than IB... at least from what I have observed. I have often complained about that on here and to TT staff. I think there are some cases where you may get better fills, but as Kim mentioned earlier, IB's smart routing is the way to go. FYI, I just have a small account and I don't trade large sizes... so YMMV.

