

Spread
-
Posts
245 -
Joined
-
Last visited
-
Days Won
1
Recent Profile Visitors
714 profile views


Spread's Achievements
Advanced Member (4/5)
21
Reputation
-
Update : after a reboot , I see it's there. I'm sure I look in the right place yesterday. But I'm also assume there are a lot of changes going on in the TOS software, resulting in weird behaviour
-
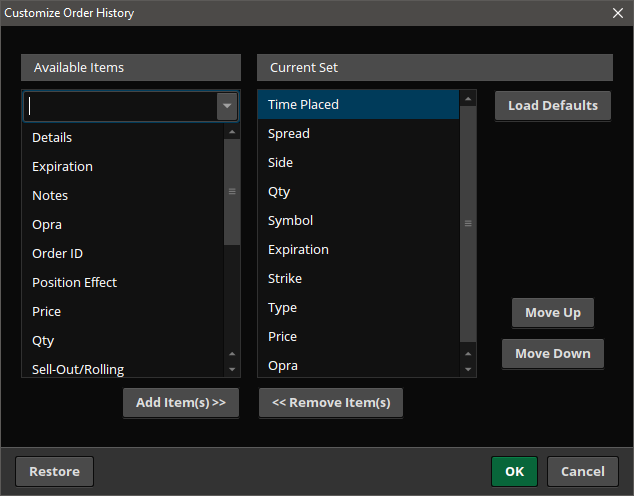
Thanks for pointint that out, but I don't see a customize "Trade History" gear symbol (anymore?)
-
They seem to have changes the custom export fields, which has broken the ONE import function. I already placed a request at ONE to update there software
-
I was also think about steady .... , what about SteadyBasics SteadyService SteadyTerms SteadyMovement
-
Hello @zxcv64, first of all thank you for sharing your story. It's really encouraging to go on. The above quoted sentence jumped out for me, since I'm trying to setup a personal trading log for a while. I experimented with different methodes and tools. Varying for 'screen-shooting' everything, till only making short telegram style notes. I'm not doing very well on this area, by not sticking consistent to one methode, or never look at the made log notes and do some evaluating, etc, etc. So I would appreciate if you would share your methode of trade logging. What and how do you register ? Perhaps you can share a sample log ? Any thought / tips / advise regarding maintaining a trade journaal you wish to share. Thanks in advance.
-
That's oke, sorry if I wasn't clear, but do you know the answer to my question, about what exactly does the heatmap shows ?
-
Then the next step would be to combine the heatmaps of the long and short option to a ratio heatmap. So if I'm understand you correctly the ratio heatmap is calculated in this way: Exit value = ( Long exit price * Long number of contract ) – ( Short exit price * Short number of contracts ) Long exit price = Long entry price + Long PL – RV decline on extrinsic value long option Short exit price = Short entry price + Short PL – RV decline on extrinsic value short option
-
Thx @TrustyJulesfor your quick answer. This is even more than I was asking for. My intention was to build up the questioning. Above question focussen on a single long call position.I really would like to know how this is calculated (I still think the answer might be A or B). And I consider this a need to know before I can really understand the ratio heatmap. Basicly I'm asking is the heatmap a reflection of just the changing IV ( answer B ) or does it include changing IV and price movement of the underlying ( answer A )
-
Hello @Djtux , I have been reading a lot in the ratio spread threats from @TrustyJules and the posts about the VolHQ ratio spread analyser. But I didn't find the answer for this question.I might be obvious, but I thing it's really important to get this right. The 'Return Matrix' offers the PL matrix of call with a specific delta. My question is ; how is the PL calculated ? Is this A. Buy the option with the selected delta on the entry day. En sell THE SAME option after the historical stock move on the exit day B. Compare the price off the option with the selected delta on the entry day with the price of an option with the same selected delta (so this might be another strike) on the exit day.
-
Do you know when de exchange changes from $1 strikes to $2,5 to $5 ? I mean is there a default policy ?
-
I use TOS for trading, but just opened an IB account. I'll try to get the market data settings right
-
Hello @Djtux I hope you don't mind answer another question. Could you please let me know which quote bundle you need for the desktop app ? Currently I only have the free delayed data (and snapshots). The logging is listing errors like : BrokerError: ID:100002 errorCode:354 errorMessage: Requested market data is not subscribed.Delayed market data is available.Error&BEST/OPT/Top&BEST/OPT/Top&BEST/OPT/Top&BEST/OPT/Top
-
Thanks for the first answer. To clarify the second question. I'm using XLQ and Excel to keep track of the current RV etc. I'm using a formula to construct the ATM put and call symbols. To get the ATM strike I divide the current price of the underlying by the strike distance ( mostly 1, 2.5 or 5 ) round it down and multiply it by the strike distance. I noticed the strike distance of the back month is mostly larger as the front month. So I use the back month in the formula. Now I look for strike distance in my broker platform, but it would be easier it was listed in the scanner
-
Hi @Djtux Indeed works great. Very handy to copy and paste the candicate list into the white-list. I do have a request , would it be possible to add a column with the base IV in the scanner. ( to quickly see the most suitable strategy ) Also the strike distance of the back month would be most convenient Thanks in advance
-
Thx for the tip, I'll check my statement for the yearly paided commission and give them a call