

Ordos
-
Posts
203 -
Joined
-
Last visited
-
Days Won
3


Ordos's Achievements
Advanced Member (4/5)
10
Reputation
-
Pass.
-
Appreciate the reply, this makes sense as to why some brokers do and some don't. I'm still not sure I can wrap my head around why SPX options can't theoretically undergo backwardation, but I'll give it another mental shot tomorrow at a more godly hour. Thanks
-
So I always already typing this before @anand331 reponded, my thoughts are the same. Theoretically: if the SPX is at 2000, I sell a 10 jul puts at 2000, and go long 10 2000 august. Now the market collapses and goes to 1800 with a day to expiration. Maybe IB detects this would cost me 400K, which would put me on margin call. but what can they do? They can't exercise the remaining long leg to flatten my margin, so they can only sell it. But that assumes the long put is worth the difference, and that may not be so. I'll have a look at the worst crash we have in recent options data on 2008-10-15 and see what happens to a theoretical calendar for kicks.
-
Thanks, that actually makes sense. Should have though of it since I don't trade calendars on the VIX for the same reason, but I guess its extreme daily moves made me more aware of that risk as opposed to the SPX which does so (relatively) rarely. I would guess that in practice, this would only be an issue if you held till expiration of both strikes, if you just close when such a large move occurs the price increase on your backdate option should have increased to offset such a loss.
-
I just don't understand this. I'd be very interested in their explanation of why not. I've previously read other folks saying OptionHouse told them because of Finra, if that's the case I'd love to hear them point out where this is written..
-
Thanks, but in my case it most definitely wasn't this issue. As mentioned above it was because for some reason IB changed the IV from annually to daily.
-
Here is some documentation: https://www.interactivebrokers.com/en/software/tws/usersguidebook/ordertypes/volatility_trading.htm
-
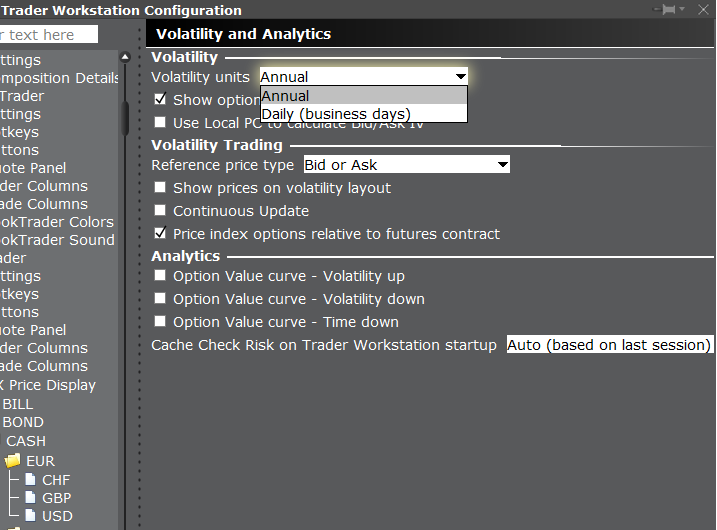
Hmm, it seems likely that this is related to the version of your TWS. I'm using 957.3h, aug 9 2016. It could be that they added it later and you're using an older version. I certainly didn't enable anything special to get this section. The only other thing I can think of is that you have a feature selector which can hide things, see image. Other than that, I don't know what these features do, but I'm sure IB has documented it.

-
I think I figured it out. Apparently you can choose between showing IV daily (business days) or annually. The later is the standard. I certainly don't recall changing this but should anyone have this problem, you can change it here as shown:
-
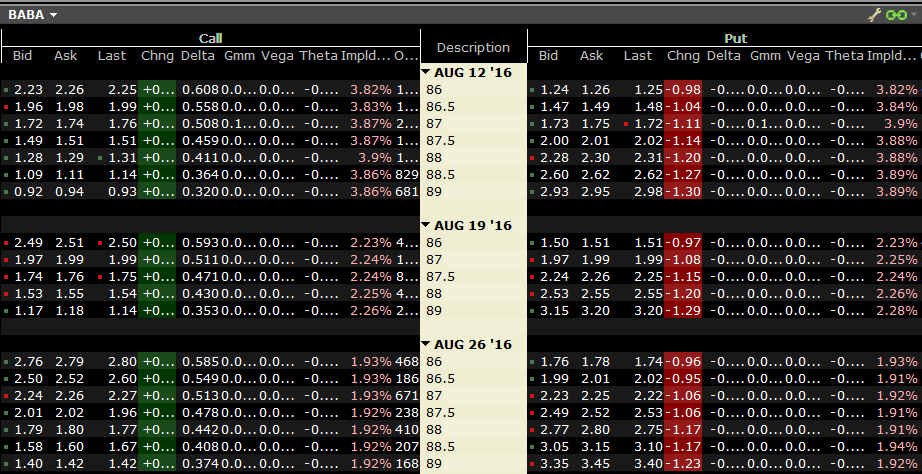
Since a while the option implied vol numbers in my IB tws interface are off. It seems the ratio of it is still correct, ie earlier expiring options have higher IV before earnings in the case of BABA, but they are usually expressed in higher percentages. Anyone seen this before or knows why?
-
I used to consider OI and volume leading for liquidity, these days I also look at the bid/ask and strongly prefer it to be less than 10% off either bid or ask depending on which side I'm on. However, all things being equal I strongly prefer there to be some OI too. A tight bid/ask could be just one market maker, and what if he decides not to market make as market conditions change? Then I can't exit a position easily. A larger OI/Volume indicate to me that there are (probably) at least be some other participants I could trade with. But that's just my perception, maybe others could chime in?
-
Kim, luxmon: Appreciate the comments. Just to be clear: I wasn't suggesting this is a viable strategy, but I'm the sortof of fellow who likes to ask 'what if' questions, and I figured others might like to see the above results.
-
Was curious, so I had a look at their returns. Have calculated the following (without compounding): 2009 Avg return 445.17% 2010 Avg return 119.21% 2011 Avg return 83.28% 2012 Avg return 83.28% 2013 Avg return 89.81% 2014 Avg return -58.66% 2015 Avg return 0.50% 2016 Avg return -67.32% Average total 99.32% Not sure what to make of it really. Seems easy to replicate, but I wonder how such a strategy performs long(er) term, as we've been in a bull market for a while now (and since their inception). The drawdown on 2014 is too heavy though. I wonder what happened there, 2014 was uptrending and so it should've been pretty profitable too. I guess the volatility just wasn't high enough to compensate for the risk as it was in 2009.
-
Edit: oops wrong thread
-
Thanks for you response. I wonder, is this a standard policy of theirs, or did you have to call to beg and plead for the 10 minute window? Because if its default behavior that would be ideal. From what I've read on their knowledgebase its hack and slash liquidation until the margin is down. What concerns me about this is that they might also sell the hedging option leading to more exposure/risk. I'll also ask them directly, but I was curious as to actual experiences.
