tnTrader
-
Posts
55 -
Joined
-
Last visited
Content Type
Profiles
SteadyOptions Trading Blog
Forums
Everything posted by tnTrader
-
True, as long as none of the accounts are limited partnerships or corporations, as I now see Kim has also mentioned. In my case I am managing an account owned by an LP and that pushes me into the higher fees, even though it is small and all family.
-
@seotrader- Those are the "professional" fees. Even if you don't fit as a professional in the questionnaire you will be asked to pay these fees if you trade as a limited partnership. I manage a little money for a family limited partnership (LP) and IB says that's enough to trigger the higher fees. Since I have the LP account tied to my personal account for log in purposes it means my data subscriptions for my personal trading are also charged at the higher rates. I'm considering changes.
-
I recently took a live Sheridan mentoring class titled "Weekly Options for Income". It was very good for me. I've been working on my options trading for about 18 months now, including study time before real trading. I've been a member here since last summer. I've not followed up with Sheridan mentoring or community, but might do so after I get a little more experience. I do continue to watch a number of the videos they release. I'm convinced there are a number of successful methods one can follow. The trick is to find what fits your comfort zone. There is also a great community of knowledgeable people here. Hugh
-
Thanks Edwin. That looks like minutes from the last meeting rather than the day of the next Fed meeting. Not to say that is not the cause for the increase. I expect those minutes could be quite revealing. The next Fed meeting is on March 18th, I believe.
-
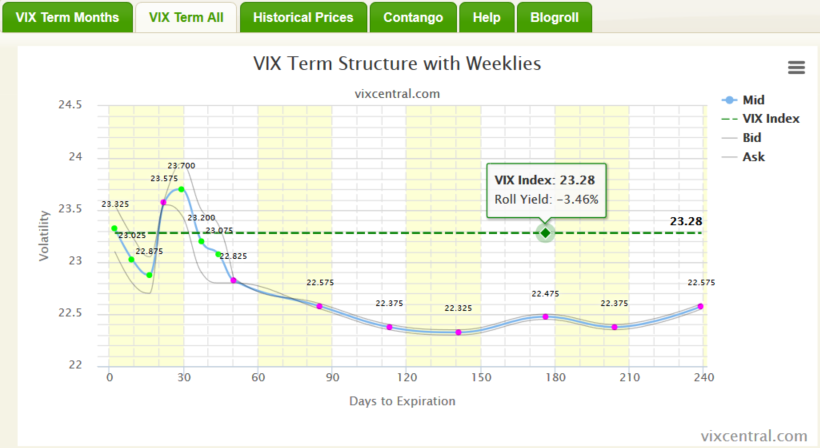
I've been spending a good bit of time with the VIX market recently, focusing on the term structure of both the futures and the various VIX indexes. The chart of the futures market as of this afternoon is shown below (courtesy of vixcentral.com). The common pattern is either a rather consistent trend up or down as you go out in time. This chart drops for a few weeks, rises going into next month's expiration and then the usual pattern of drops (given the current elevated VIX). I've traded futures for years, but am new to VIX. Any explanations of this would be appreciated. Thanks.