
Leaderboard



Popular Content
Showing content with the highest reputation since 10/03/25 in Posts
-
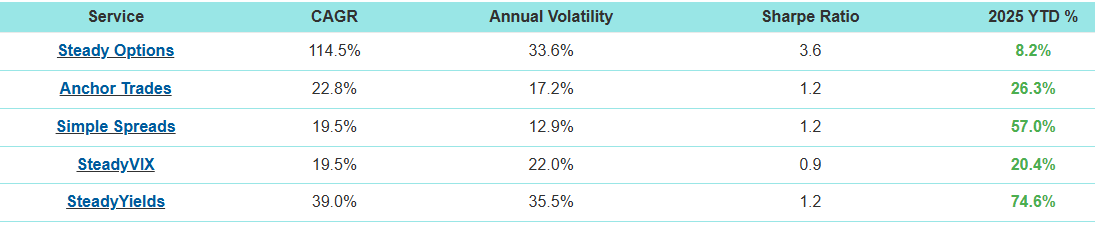
As I do at the end of each year, I’ve broken down the Steady Options 2025 trade performance by trade type. Numbers were taken directly from the data in the Performance screen (plus some recently closed trades). Here’s are this year’s stats along with some comments from my perspective. Where applicable, I added totals from prior years for comparison. Unfortunately, 2025 was Steady Options worst performing year. I’ll try to present what I believe to be the main reasons for this as they apply to each type of trade. From an overall perspective, here are some key points that I believe factored into the performance: Most SO trades are Vega positive trades leading up to earnings events, so volatility plays a key role in the outcome of our trades. Volatility rising helps trades and volatility declining hurts trades. 2025 saw 4 VIX spikes that occurred rather quickly (not a gradual rise), most spikes were relatively short in duration with declines starting shortly after the spikes. When you look at the year in total, the vast majority of the time we were in time periods where volatility was falling. Trades that were in place prior to the spike performed well, but other trades that did not encompass a spike commonly dealt with falling volatility and RV declines bigger than prior earnings cycles. This meant that trade that would have been small to moderate gains in prior years turned into small to moderate losses this year. Losses above 10% were also more common. There were some things that worked very well this year, although they were in some of the portfolios outside of SO. Steady Yields (SY) and Simple Spreads (SS) performed very well as many of their trades were helped by the same things that hurt the SO trades. Most trades in SY and SS tended to be Vega negative, meaning that they were helped by declining IV – so both time decay and declining IV helped these trades. Pre-Earnings Calendars 24 Trades – 21 win, 3 loss (88% win) – Average Gain +8.77% 2024: 65 trades (81% win) – Average Gain +12.13% 2023: 65 trades (85% win) – Average Gain +9.56% 2022: 11 trades (64% win) – Average Loss -9.55% 2021: 110 trades (79% win) – Average Gain +12.82% 2020: 33 trades (85% win) – Average Gain +21.97% 2019: 54 trades (65% win) – Average Gain +9.27% 2018: 40 trades (78% win) – Average Gain +9.61% 2017: 31 trades (84% win) – Average Gain +13.81% 2016: 44 trades (80% win) - Average Gain +15.07% 2015: 51 trades (80% win) – Average Gain +12.67% 2014: 48 trades (71% win) – Average Gain +13.80% 2013: 24 trades (88% win) – Average Gain +20.60% Comments: Overall winning percentage was at the high end compared to prior years, but average gain per trade was at the lower end. This year lacked some larger gains that we got in prior years (likely due to volatility declines). Number of trades was much lower than most prior years as this year saw the calendars for many stocks having their calendar RV significantly higher than prior cycles, and therefore trades were not opened in these cases. There was a learning here to take forward into next year. For calendar trades entry we look to enter at lower RV levels and/or on stocks that show a pattern of rising calendar RV heading into T-0. Many stocks show a tendency for calendar RV to rise regardless of current levels, but we didn’t open trades on these stocks if the current RV was elevated. While we wouldn’t want to enter if calendar RV was sky high, hindsight showed that opening trades when RV was slightly to moderately elevated wound up being winners. Earnings calendars continue to be a core SO strategy. Straddles/Strangles 42 Trades - 21 win, 20 loss, 1 break-even (51% win) – Average Loss -0.56% Breaking down further by hedged and non-hedged: Non-Hedged – 21 win, 17 loss, 1 break-even (55% win), average gain +0.24% Hedged – 0 win, 3 loss (0% win), average loss -10.97% 2024: 57 trades (73% win) – Average Gain +4.72% 2023: 166 trades (64% win) – Average Gain +1.65% 2022: 148 trades (71% win) – Average Gain +4.89% 2021: 129 trades (68% win) – Average Gain +3.27% 2020: 118 trades (67% win) – Average Gain +2.80% 2019: 106 trades (68% win) – Average Gain +3.58% 2018: 72 trades (83% win) – Average Gain +5.40% 2017: 77 trades (79% win) – Average Gain +5.02% 2016: 18 trades (72% win) – Average Gain +5.19% 2015: 44 trades (68% win) – Average Gain +2.61% 2014: 74 trades (62% win) – Average Gain +2.54% 2013: 104 trades (57% win) – Average Gain +1.35% Comments: Lower number of straddle/strangle trades compared to prior years, due primarily to double diagonal (DD) trades which have similar gain targets to straddles and strangles but can be kept open longer. Overall winning percentage and average gain per trade were at lows. This is primarily due to the decline volatility which saw straddle RV dropping by larger percentage compared to cycles in prior years. When the stock price did moves, gains were often muted when factoring in the larger RV declines. From a downside risk perspective, we saw more losses above 10% compared to prior years with 7 of the 20 losing trades having a loss greater than 10%. 12% of trades hit 10% gain target, which is lower compared to prior years. These trades remain low risk trades as it takes RV dropping much more than their prior cycle tendencies to be significant losers – unfortunately we saw more cases of the outsized RV drops this year. Double Diagonals DD trades have the goal of having performance similar to straddles/strangles – but have the ability for the trades to be open for much longer periods of time (up to 3 weeks prior to earnings) giving the stock more time to move but still have minimal downside risk. 48 Trades - 28 win, 19 loss (60% win) – Average Gain +0.79% 2024: 52 trades (73% win) – Average Gain +4.86% Comments: Winning percentage was down from last year and average gain per trade was only slightly positive. Again, a result of RV declines more than prior years. What were small winners last year because small losers this year. Last year, all losing trades were under 10% losses (majority of losses were under 5%). This year we saw 6 losses above 10%, but all losses were under 20%. The DD trade is a low risk trade type with minimal downside risk, but this year has shown that when RV declines are more than expected then losses in the 10%-15% range can occur if the stock price doesn’t move. 25% of trades hit 10% gain target (compared to 35% last year). This is not a huge difference, it means that when the stock price moves you can hit that 10% gain target regardless of what happens with RV. Pre-earnings Iron Condors In the 4th quarter we introduced the pre-earnings Iron Condor (IC) trade as a way to get a Vega negative trade type into the SO mix of trades. We targeted stocks that have a consistent and large straddle RV decline heading into earnings whose historical straddle performance show mostly losing trades (meaning the stock price doesn’t tend to move a lot prior to earnings). 10 Trades - 7 win, 3 loss (60% win) – Average Gain +0.07% Comments: Large percentage of winning trades, but one of the three losing trades was an oversized loss when stock price made a big move corresponding to a larger market downturn. Will continue with these trades in the future, trying to limit those bigger losing trades by keeping risk vs reward near equal and by selecting stocks whose straddle RV decline is both large/consistent and happens in a relatively short period of time. Other Trades Non-Earnings RICs: 2 win, 1 loss (67% win) – Average Gain +0.00%. These non-earnings trades have higher downside risk if stock price doesn’t move. In this case the 1 loss equaled the 2 wins. Hedged ratios and BWBs: 2 win, 3 loss (40% win) – Average Loss -10.90%. These were hedged directional trades, the losses were larger when the stock price didn’t move in the right direction. S&P500 addition date trade: 1 win, 2 loss (33% win) – Average Loss -14.50%. These trades play for stock price decline (or at least staying flat) after the S&P500 addition. The pattern of prior year additions was broken this year. Several of the additions this year had much less lead time compared to prior years, so this might be a factor. Summary 2025 was a very challenging year for the Steady Options model portfolio. We used the same types of trade setups and analysis that has worked for us year after year. However, the market behavior this year yielded underperforming trade results. Going forward, we will continue to try to optimize trades and limit losses – but one underperforming year does not mean we need to re-think every type of trade as they have performed consistently well in prior years As always, I’d like to highlight and thank the SO community. We continue to have a group of very smart people that seems to grow each year who share their ideas and knowledge – this is what makes SO great. Looking forward to a better 2026.17 points
-
As all our American friends are recovering from their dinners and drinks, a bit of light humour on this Monday. A friend of mine knew I was an active trader and asked whether I could share my portfolio with him and we could then discuss it. To be fair to him, he was a complete newbie and I restricted myself to sharing my shares portfolio explaining that the options bit is perhaps a bit complicated. The idea was that we would talk about it and how to build a balanced portfolio, again credit to him he took it seriously and researched the companies in my portfolio perhaps further than even I had. He therefore came prepared with his homework for our discussion this weekend and proudly laid out what he found, prefacing it with: "I researched all the companies in your portfolio, there is just one I had an issue with: ALPHABET, I googled it but can't find out which company it is."10 points
-
Steady VIX 2025 Strategy Performance vs. SPY The Steady VIX 2025 strategy outperformed SPY in 2025 after closing out today’s trades. Performance Comparison: • SPY returned approximately 17.x% as of its latest level around 683. • Steady VIX 2025 finished with 20.4% total returns after including today’s closed trades. This outperformance is particularly noteworthy given that 2025 featured multiple significant VIX spikes — most notably during the April volatility surge that many market participants will remember for years. Despite these periods of elevated uncertainty, the strategy was often only half-allocated, yet still managed to outperform SPY. Trades like those executed in the Steady VIX 2025 strategy — in addition to a regular long-only portfolio — materially boosted overall returns. Also I wanted to mention, Allocation wise, we didn't over allocate, didn't take risky positions as much as possible. HALF allocation most of the time was highly conservative from our side. If someone had 1-2% better entry price as limit to enter the trade, I think most of the time there was BETTER PRICING for all the trades that we entered. So I won't be surprised folks getting 25% returns on SteadyVIX as well.6 points
-
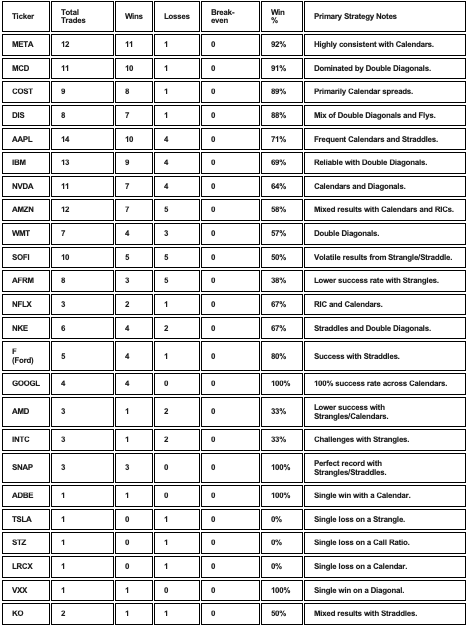
Aggregated Win Analysis by Stock (2022–2025)
 4 points
 -
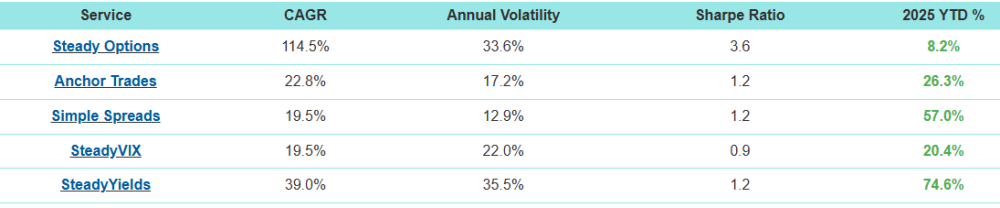
Thank you @Yowster for an excellent summary as usual. Few comments. First, we are definitely working hard to make adjustments to our strategies in order to get back to the previous years performance. Specifically: We will do more calendars even if the RV is slightly elevated, as long as there is a pattern of rising calendar RV. We will be using our newly introduced strategy Pre-earnings Iron Condors, but use a better risk management to prevent larger losses. We will be more selective with Hedged ratios and BWBs to limit the losses. Straddles/Strangles: we will likely try to cut the loss before it reaches double digits. As a general note, no strategy can work 100% of the time. Our model portfolio was still up in 2025, just not as much as in the previous years. The market conditions have been very different in 2025, and it's unrealistic to expect any strategy to work all the time. That said, our other strategies performed very well. If you invested an equal amount of money between all our services, your portfolio would be up around 37%. As always, diversification is the key. I don't know what the future holds, but I am confident that the strategies we use are solid and are based on probabilities. Sometimes it just takes more time for the probabilities to play out. I'm also aware that some people join based on 13 years of triple digit returns but cancel after a few sideways months. This is similar to someone who entered the market at the beginning of Covid in 2020, based on ~10% yearly historical returns, and exited a few months later after 30% drawdown, just to watch the markets more than doubling in the next 5 years.
 4 points
 -
A better strategy would be not to trade options that expire the same day. Extremely risky. A better strategy would be to understand what you are doing and asking questions before you place a trade. Learn first, trade later. And if you think education is expensive, try ignorance.4 points
-
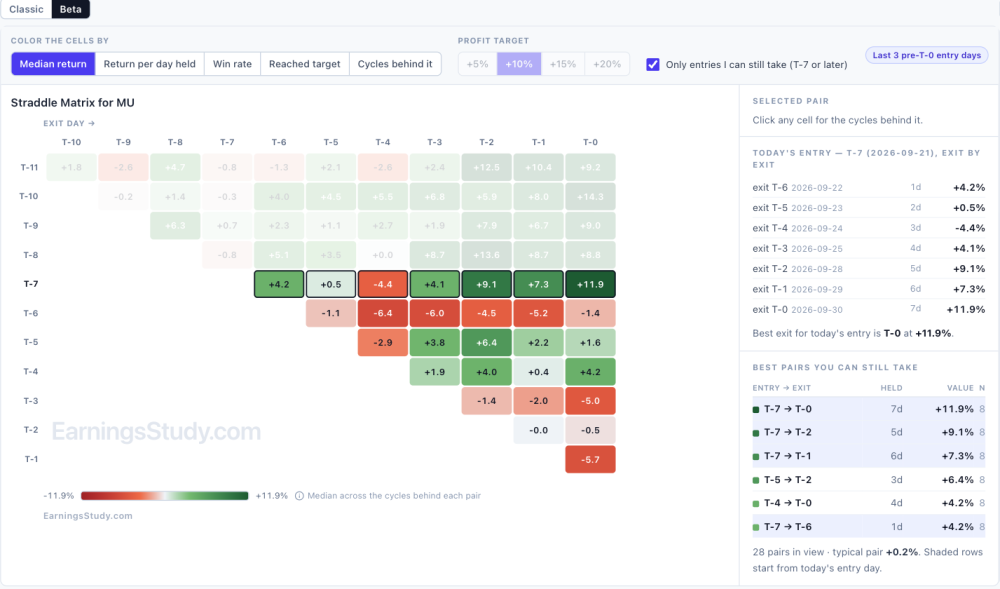
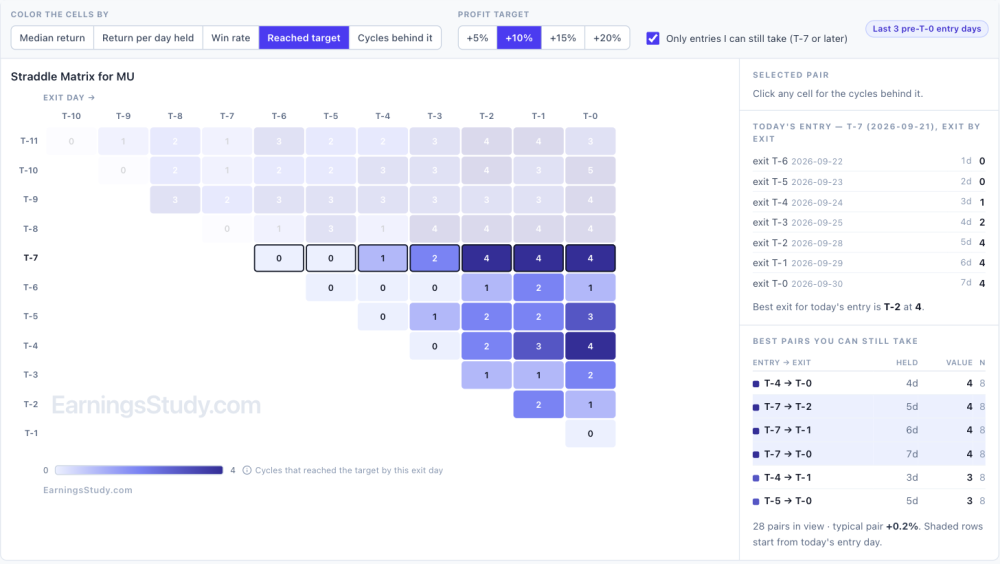
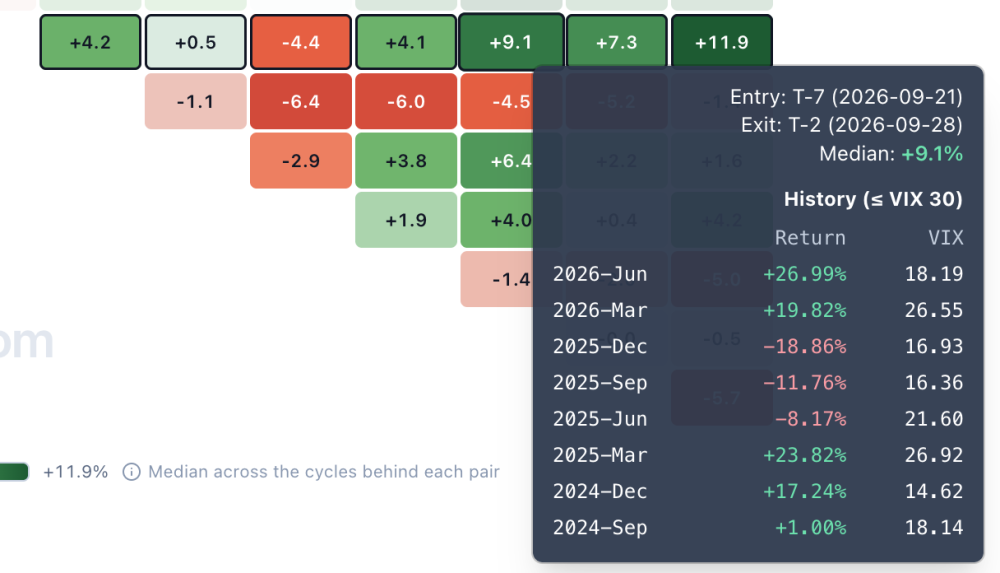
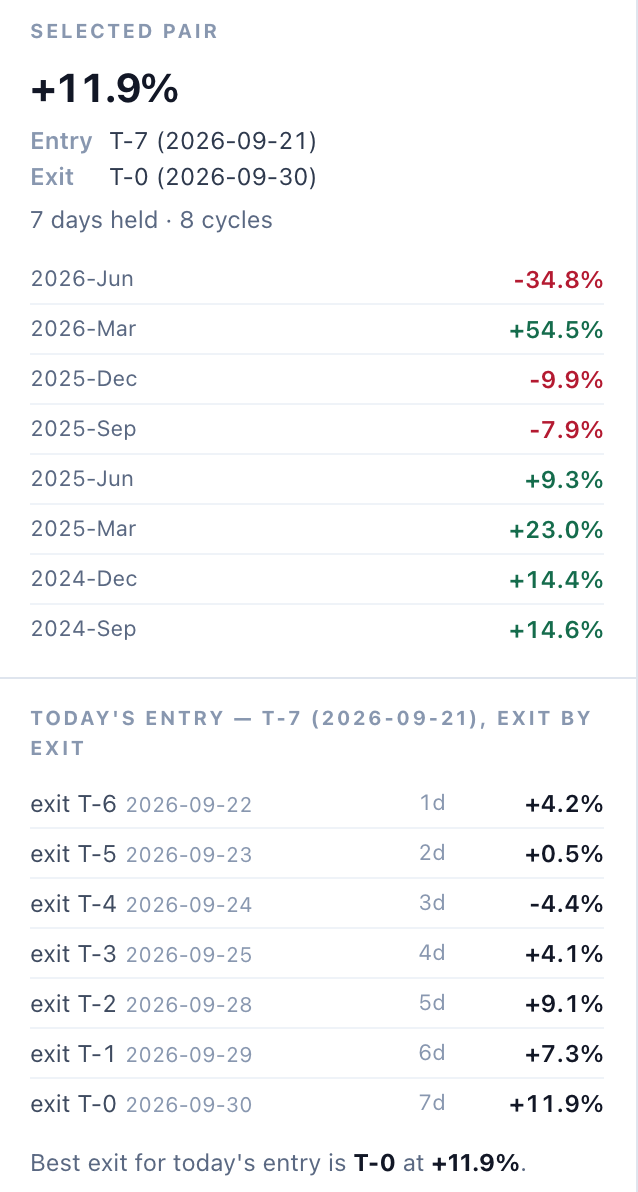
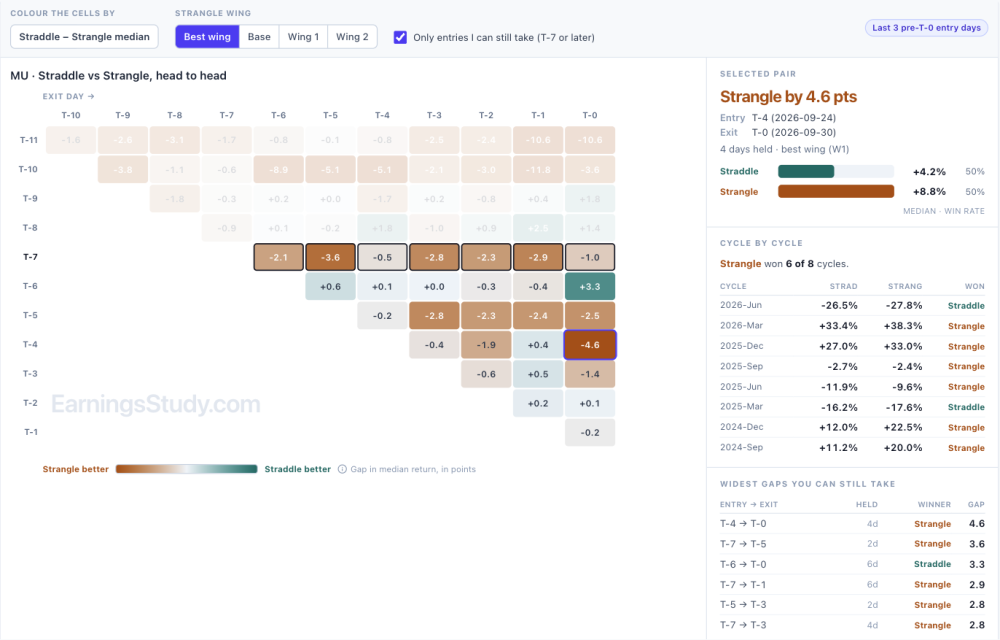
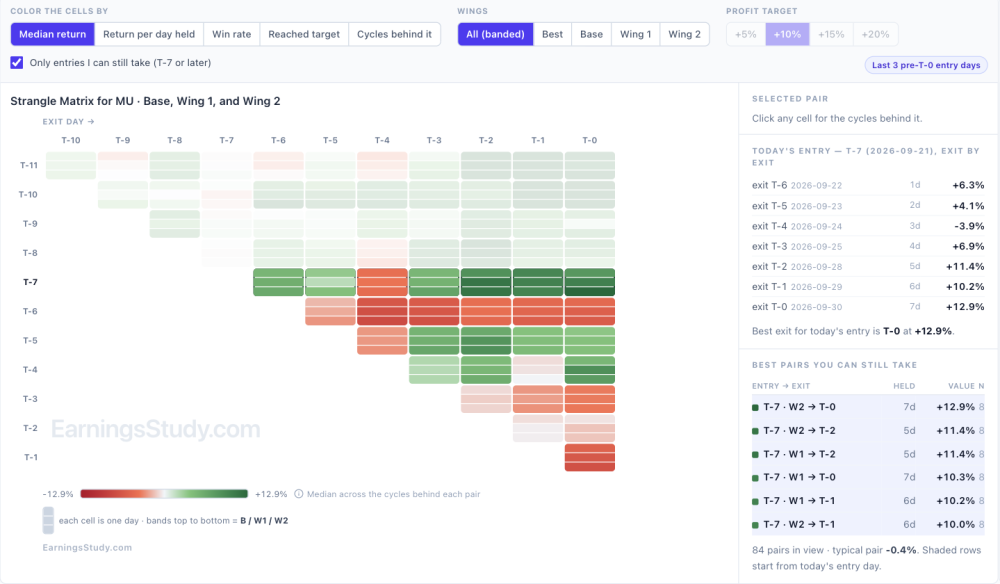
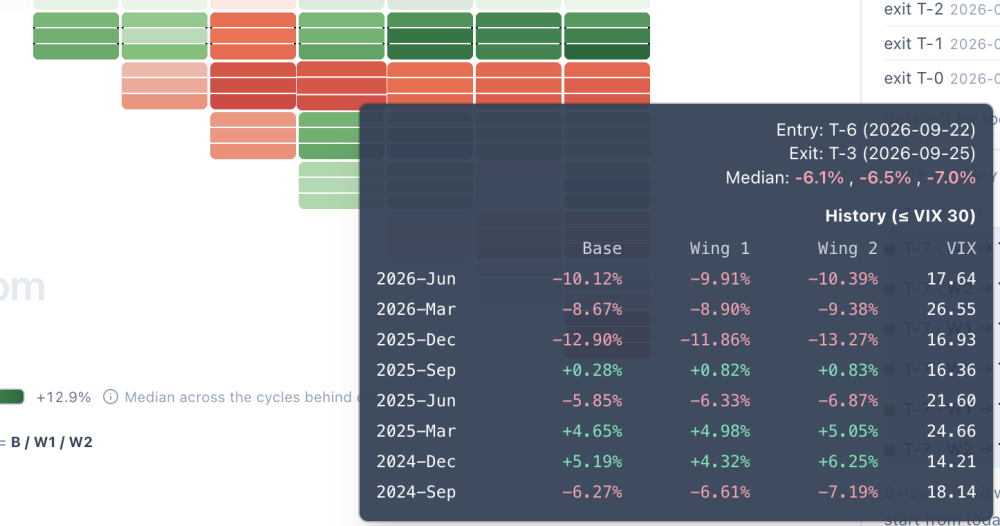
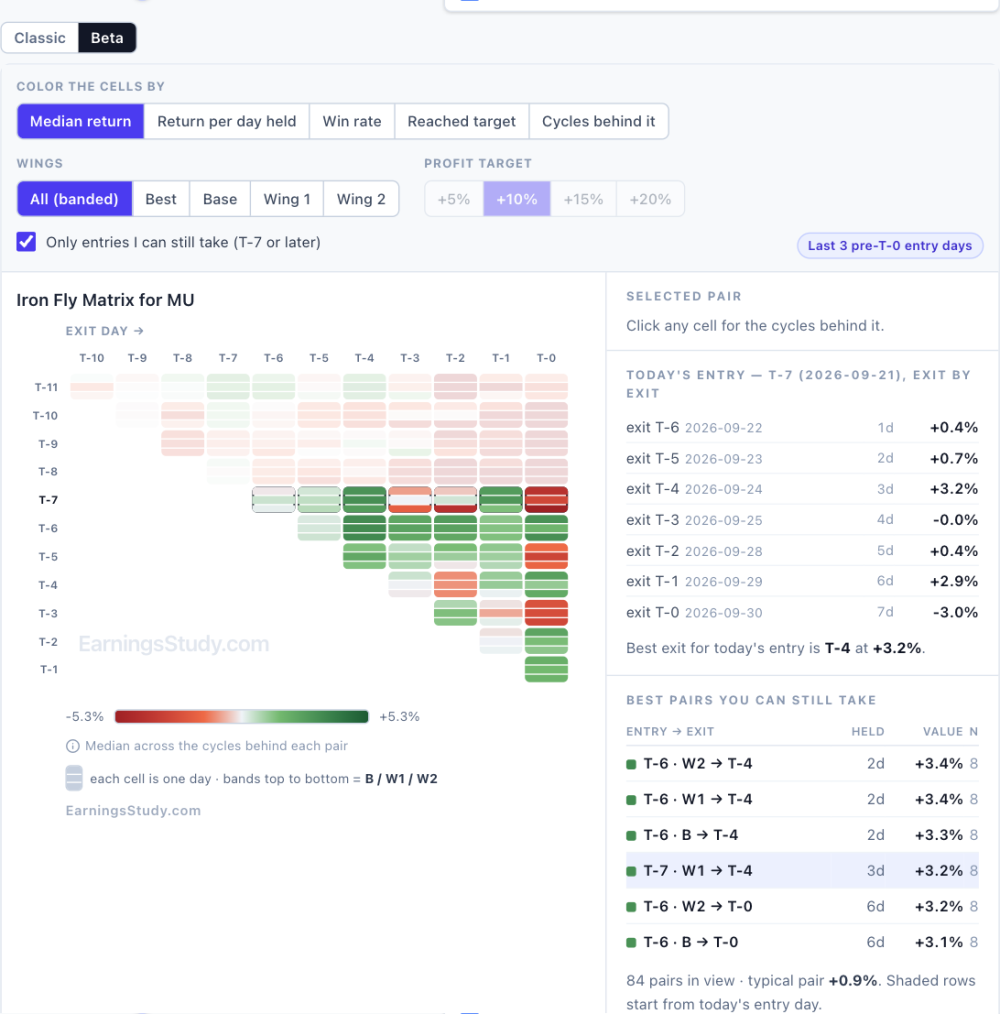
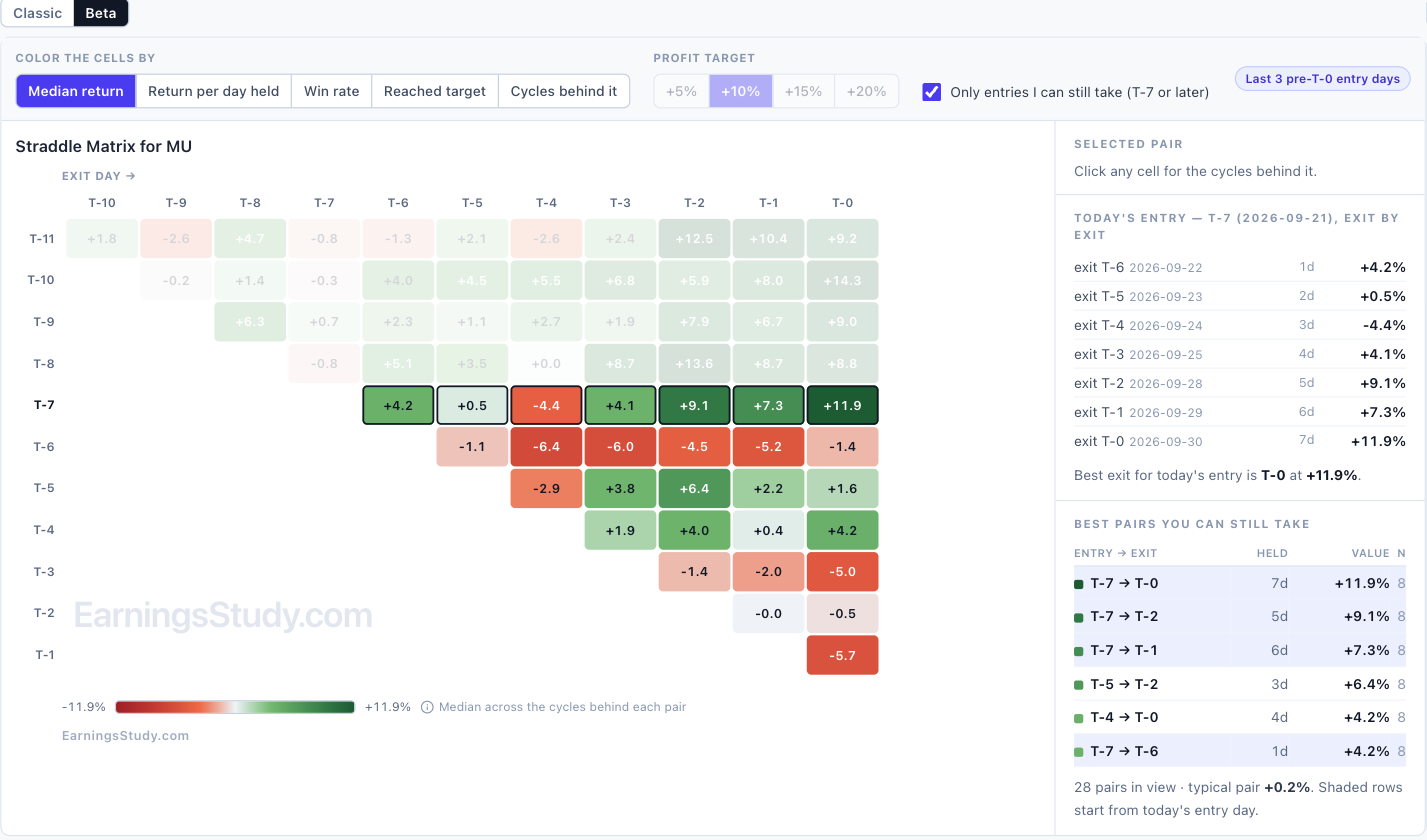
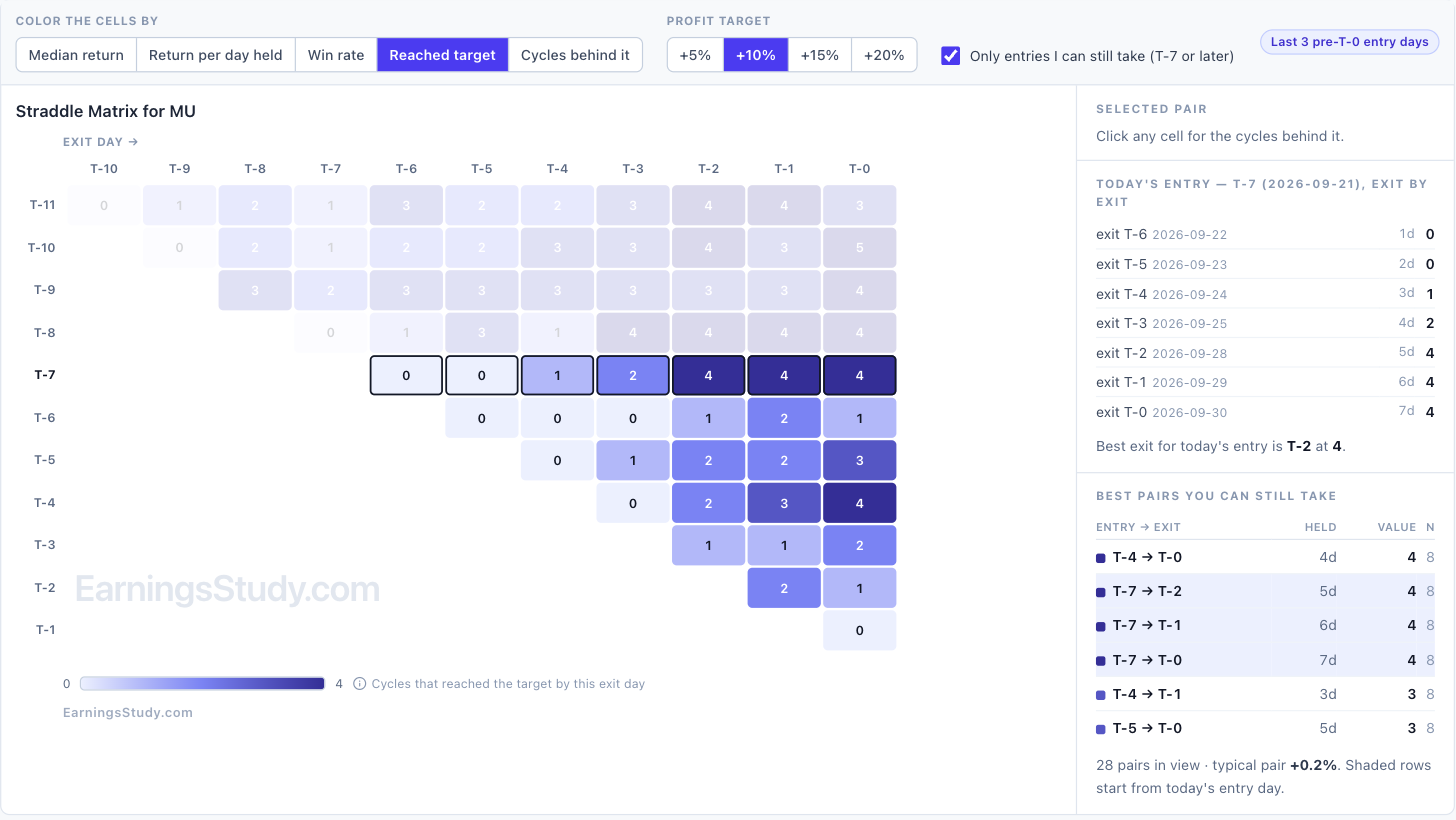
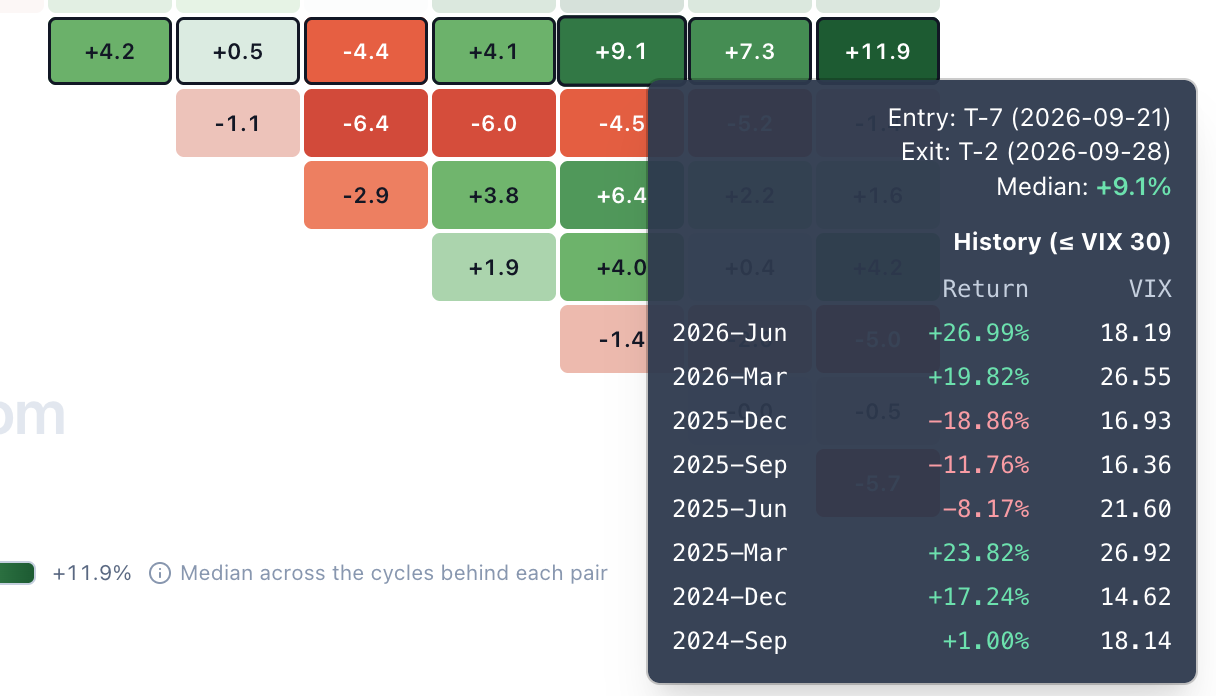
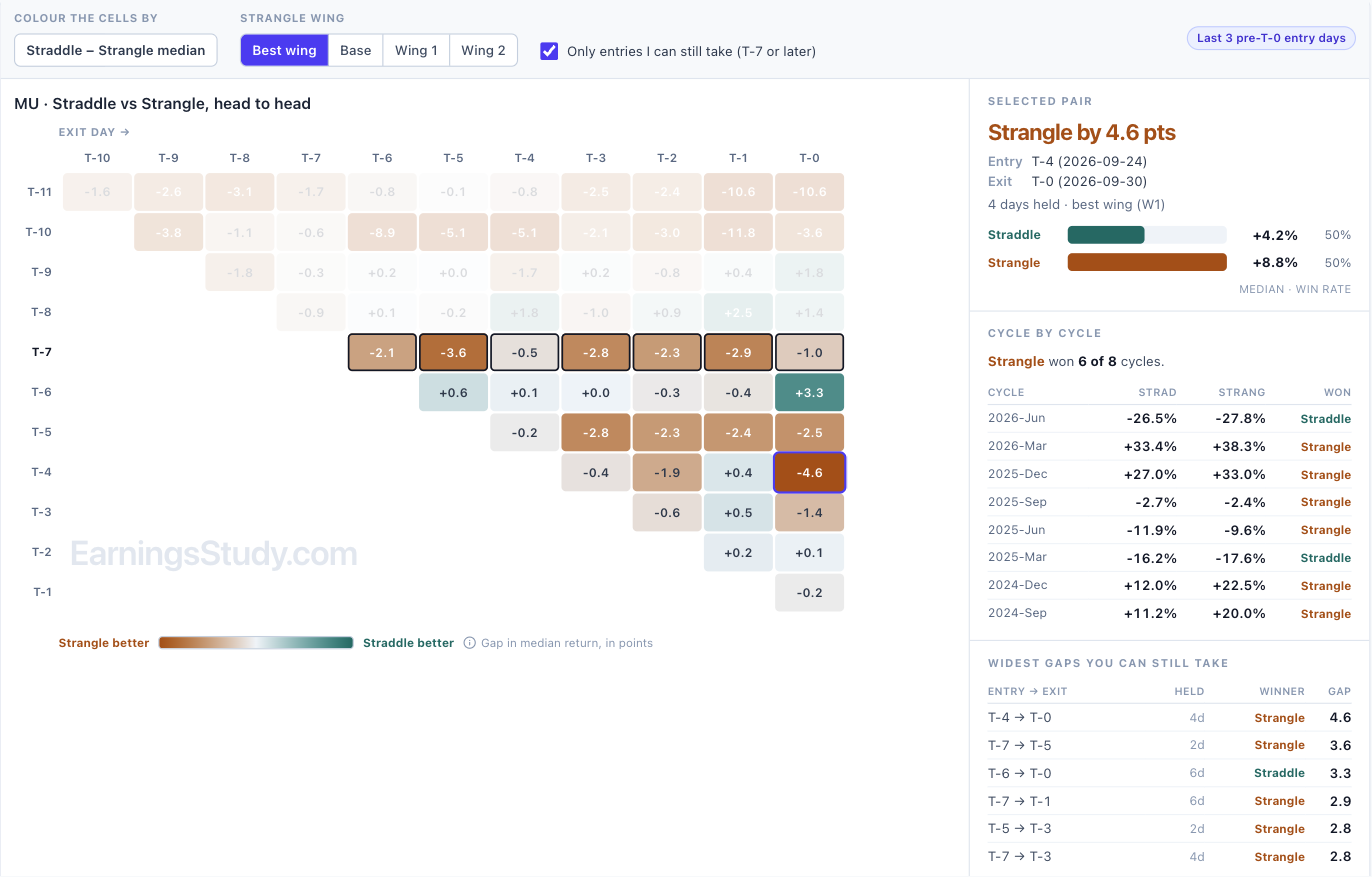
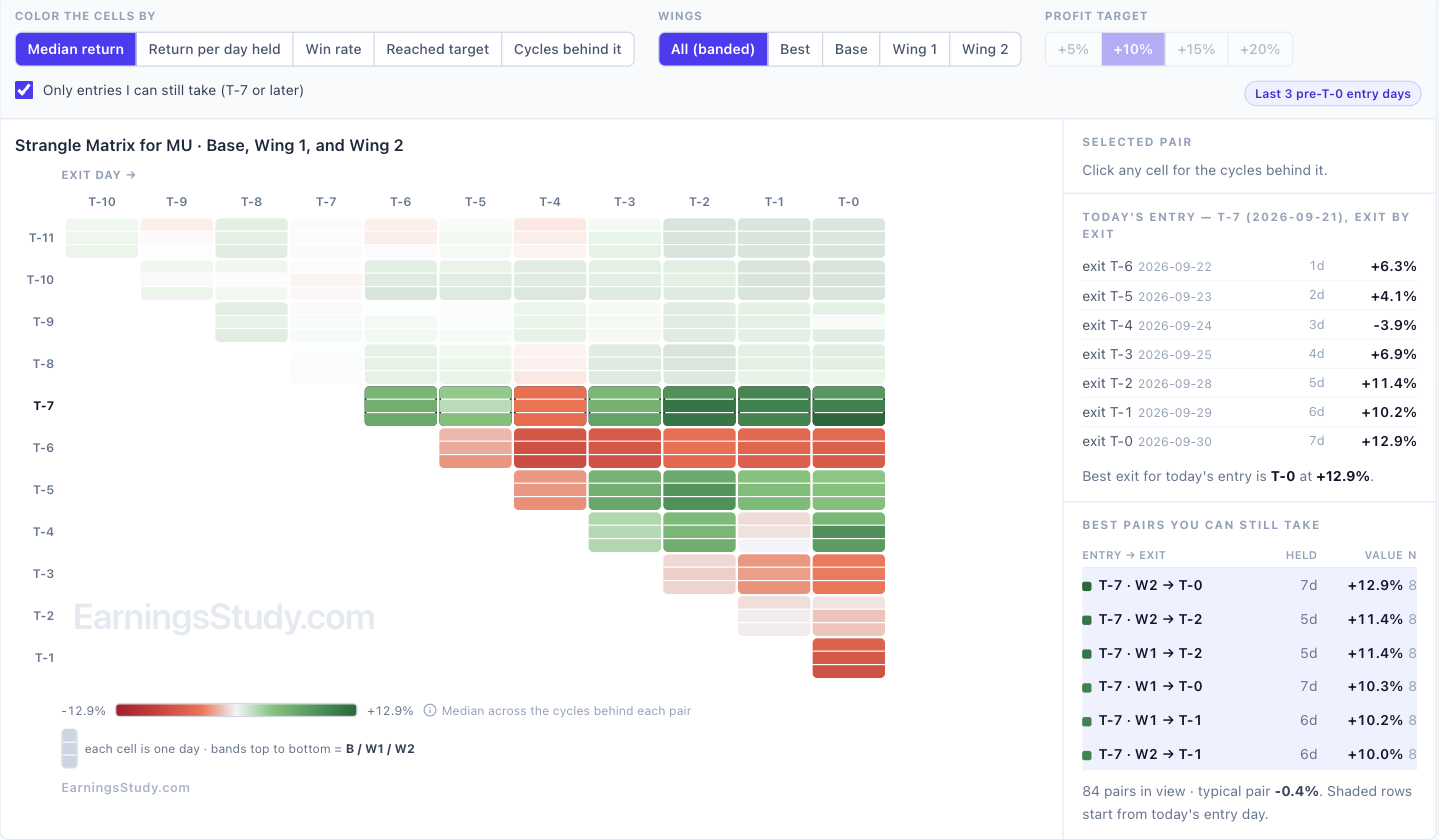
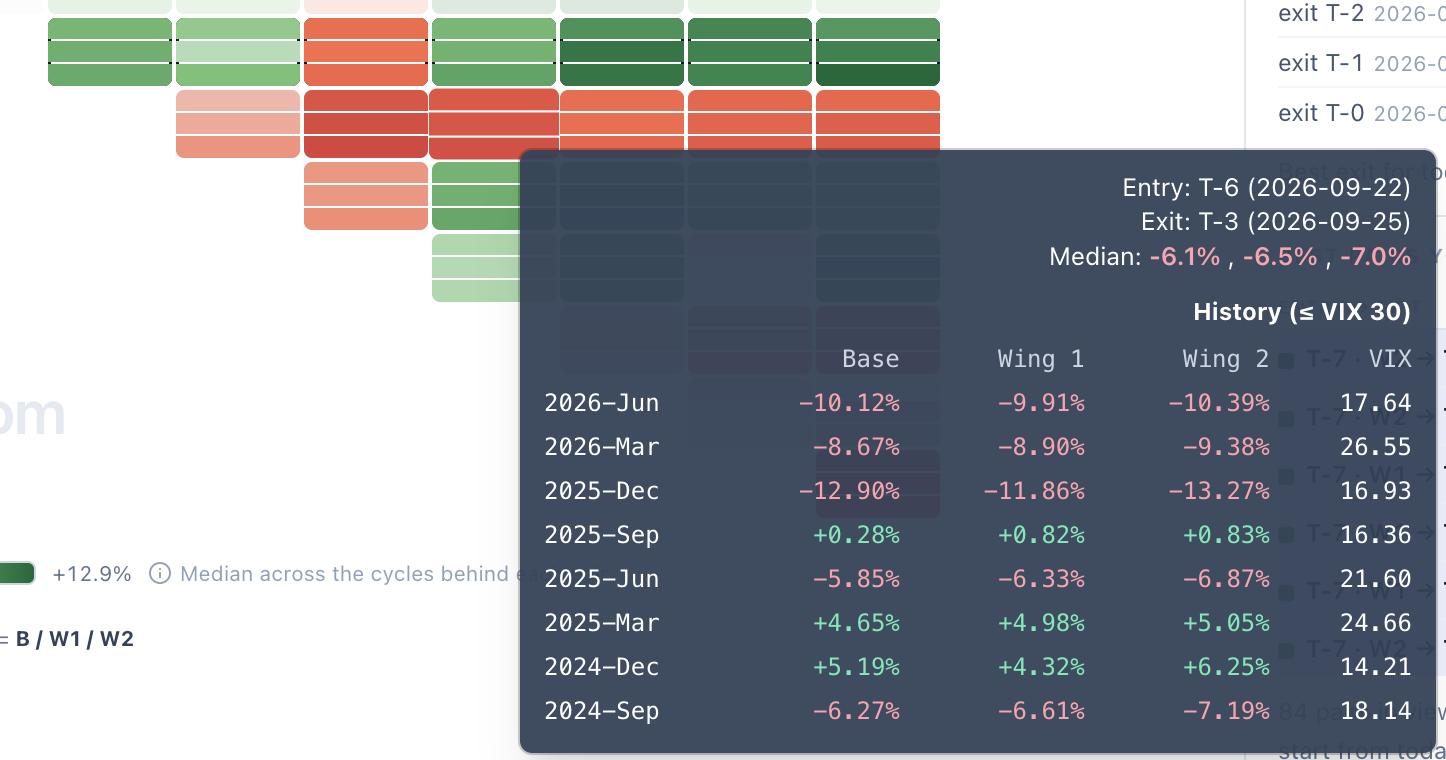
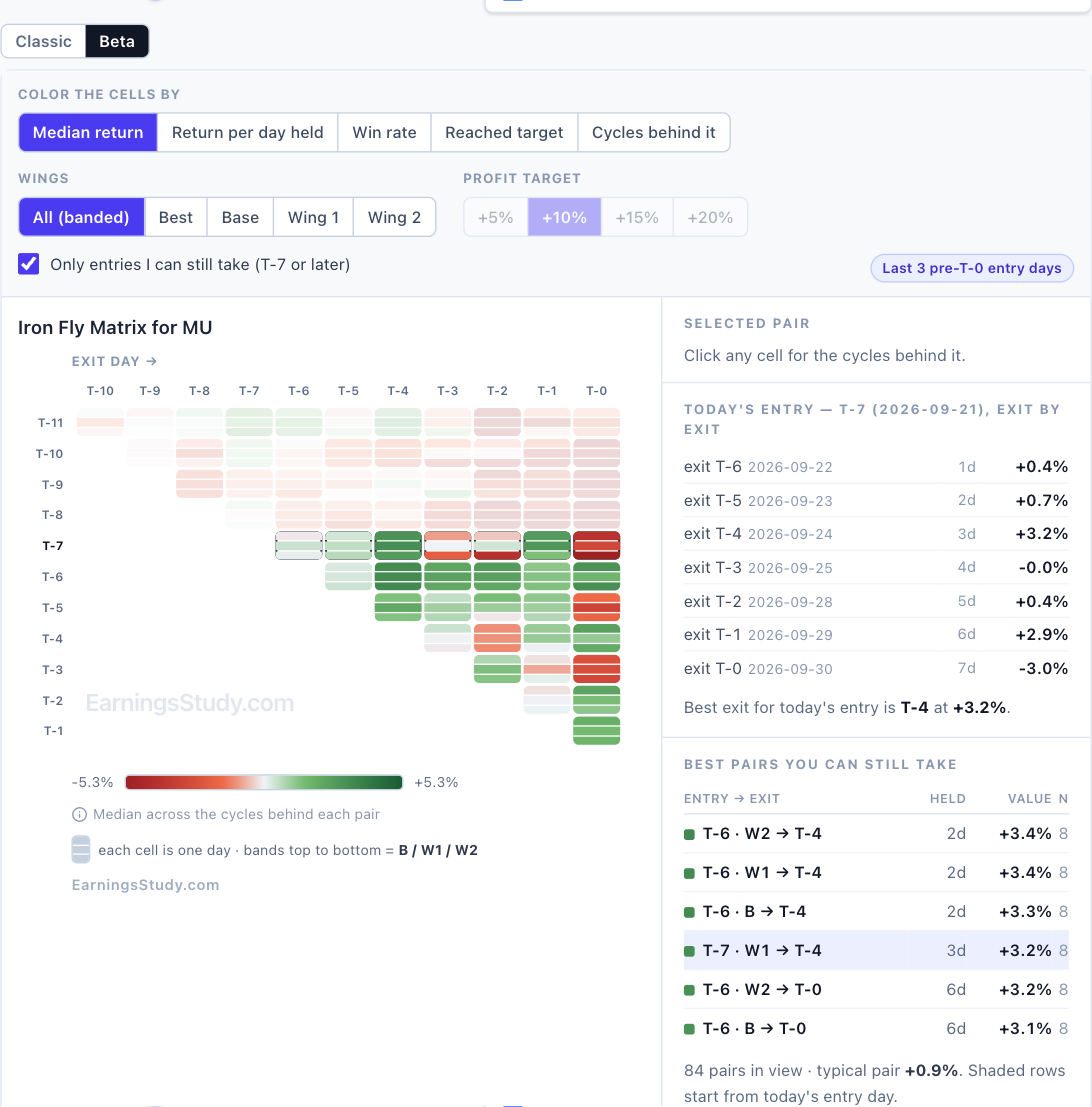
One grid, five questions — the new return matrix (Beta) The return matrix has always answered one question: what does the median cycle pay for every entry/exit pair? That is a good question. It is not the only one worth asking, and the same grid can answer the others without changing shape. The Beta matrix lets you change what the color means. Same entry × exit triangle, same history behind it, five different questions. It is live on every pre-earnings strategy page: Calendar, Straddle, Strangle, Iron Fly, Double Diagonal, Long Options, Call Debit Spread, etc., Screenshot 1 — MU straddle, colored by median return. Today’s entry, T-7, is the boxed row. The five questions Color the cells by The question it answers Median return What does a typical cycle pay? This is the Classic view. Return per day held Which pairs pay fastest? Median return divided by days held, so a two-day hold and a seven-day hold are compared on equal terms. Win rate How often did the pair finish positive at all? Reached target How many cycles reached +5%, +10%, +15% or +20% by that exit day? Cycles behind it How much history is each number actually built on? Reached target is the one I would look at first. Screenshot 2 — Same grid, now counting cycles that reached +10% by each exit day. On MU, a T-7 straddle reached +10% in 4 of 8 cycles by T-2 — and holding on to T-0 added no new ones. Those last two days bought more exposure, not more hits. The median view cannot tell you that; this one says it in a glance. The rows you can actually trade Half the triangle is entry days that have already passed. Only entries I can still take is on by default and fades them, so the ranking on the right lists only trades you can still put on today. It also makes the grid easier to read honestly. Look at the T-6 row in screenshot 1: one day later than today’s T-7 entry, the same straddle is red across the board. Every number opens up A median over eight cycles hides a lot. Hover any cell and you get every cycle behind it with the VIX that ruled it — gains in green, losses in red. Click it and the side panel pins the cycle list, with the actual calendar dates of your entry and exit. Screenshot 3 — Hover a cell: every cycle, its return and its VIX. Screenshot 4 — Click a cell: the side panel pins it, with real entry and exit dates. That is the honest read on MU’s best pair. T-7 → T-0 has a +11.9% median, but the individual cycles ran from −34.8% to +54.5%, and five of the eight were winners. A real edge with wide dispersion — size accordingly. Straddle vs Strangle, head to head Two matrices side by side ask you to subtract two colour scales in your head — and they were never on the same scale. In Beta, Compare with Strangle draws one grid instead: each cell is Straddle minus Strangle, teal where the straddle wins and amber where the strangle does. Click a cell for the cycle-by-cycle scorecard. Screenshot 5 — MU, T-4 → T-0: the strangle leads by 4.6 points (+8.8% against +4.2%) and won 6 of 8 cycles. The scorecard is the part two separate grids can never show. A small median edge that came from one lucky cycle looks identical to one that held up in six of eight — until you count them. It works the other way round from the Strangle page, and the wing selector lets you compare against a specific wing or the best one. Three wings, one row Strangle, Iron Fly and Double Diagonal each have three wings, which used to mean three rows per entry day and a matrix three times taller than the rest. Beta folds them into one row: each cell is split into three bands — Base, Wing 1 and Wing 2 from top to bottom. A third of the height, all three wings visible at once. Pick a single wing, or Best, and the numbers come back into the cells. Screenshot 6 — MU strangle: one row per entry day, one band per wing. Hover a banded cell and the three wings line up cycle by cycle: Screenshot 7 — MU strangle, T-6 → T-3: every wing lost in the same five cycles. When all three wings agree like that, the wing is not the problem — the timing is. Screenshot 8 — The same banded view on Iron Fly. Double Diagonal work the same way. How to turn it on Open any pre-earnings strategy page and load a symbol. Above the History Matrix, click Beta. Classic is one click away, and your choice is remembered. The VIX filter, earnings cycles and “3 days before current day” settings all carry over. It is labelled Beta because I want your feedback before it replaces anything. Tell me which view you end up using — and which question you wish the grid could answer that it cannot yet.
 3 points
 -
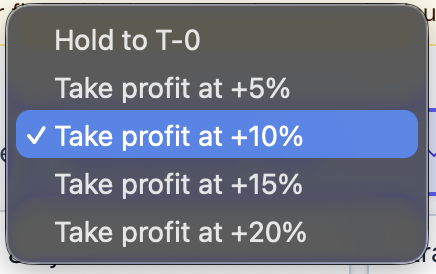
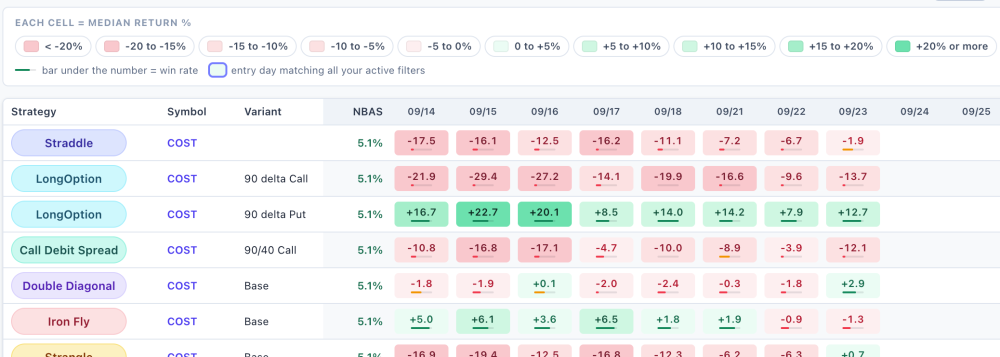
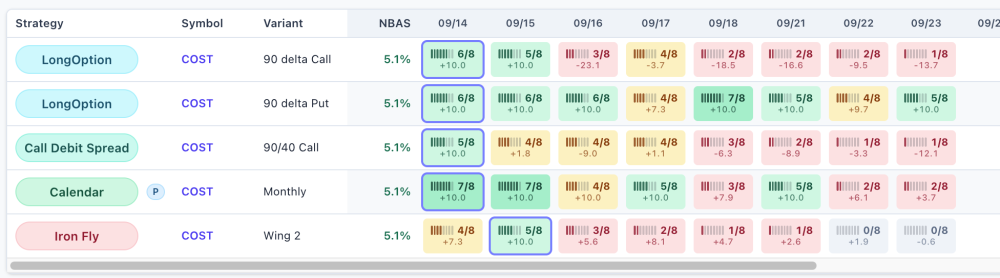
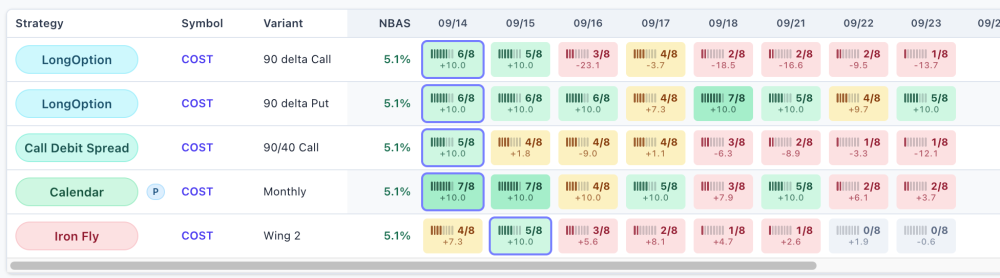
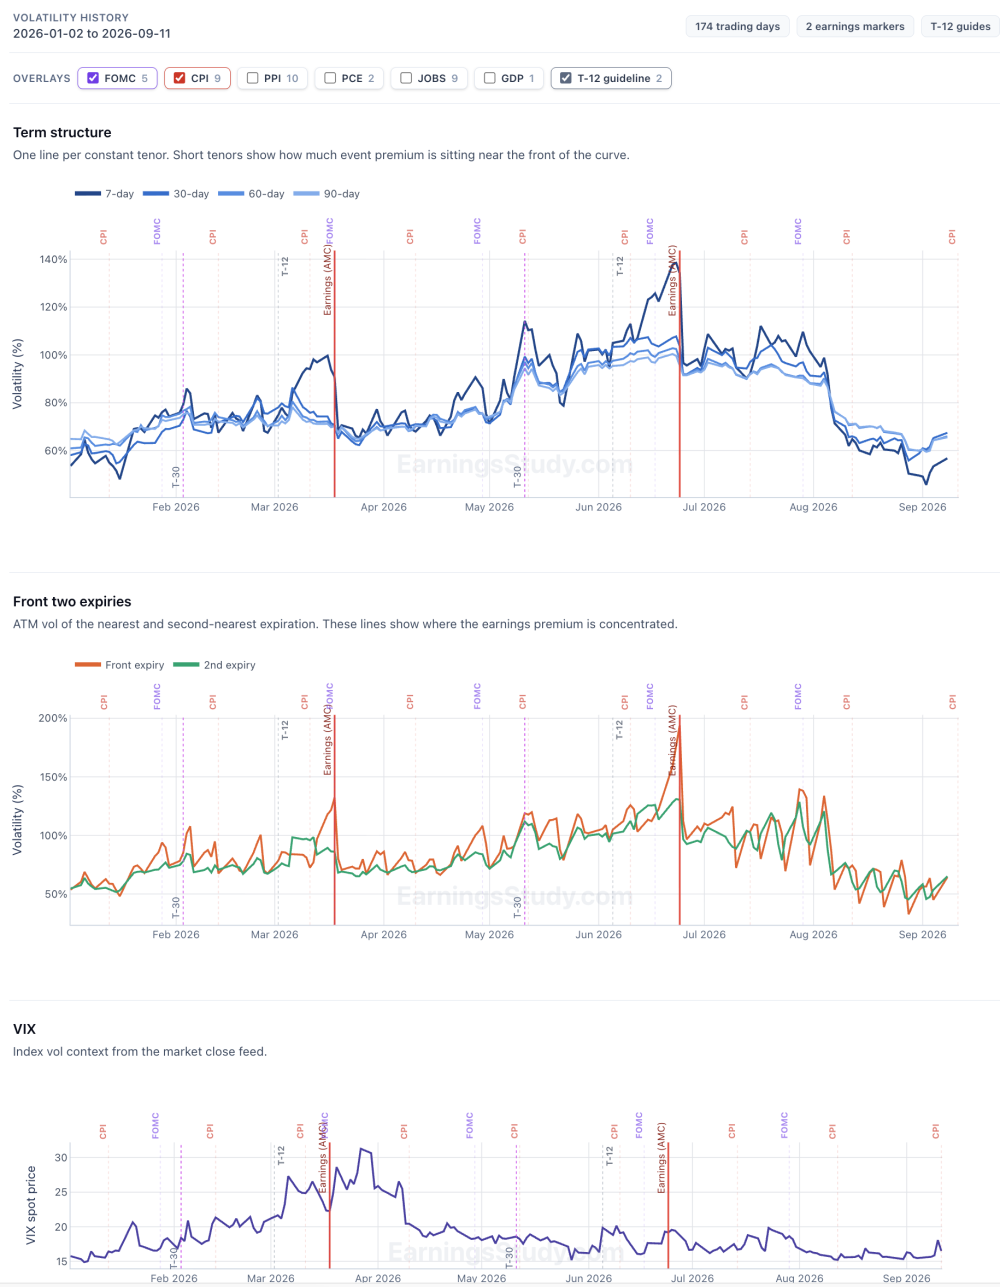
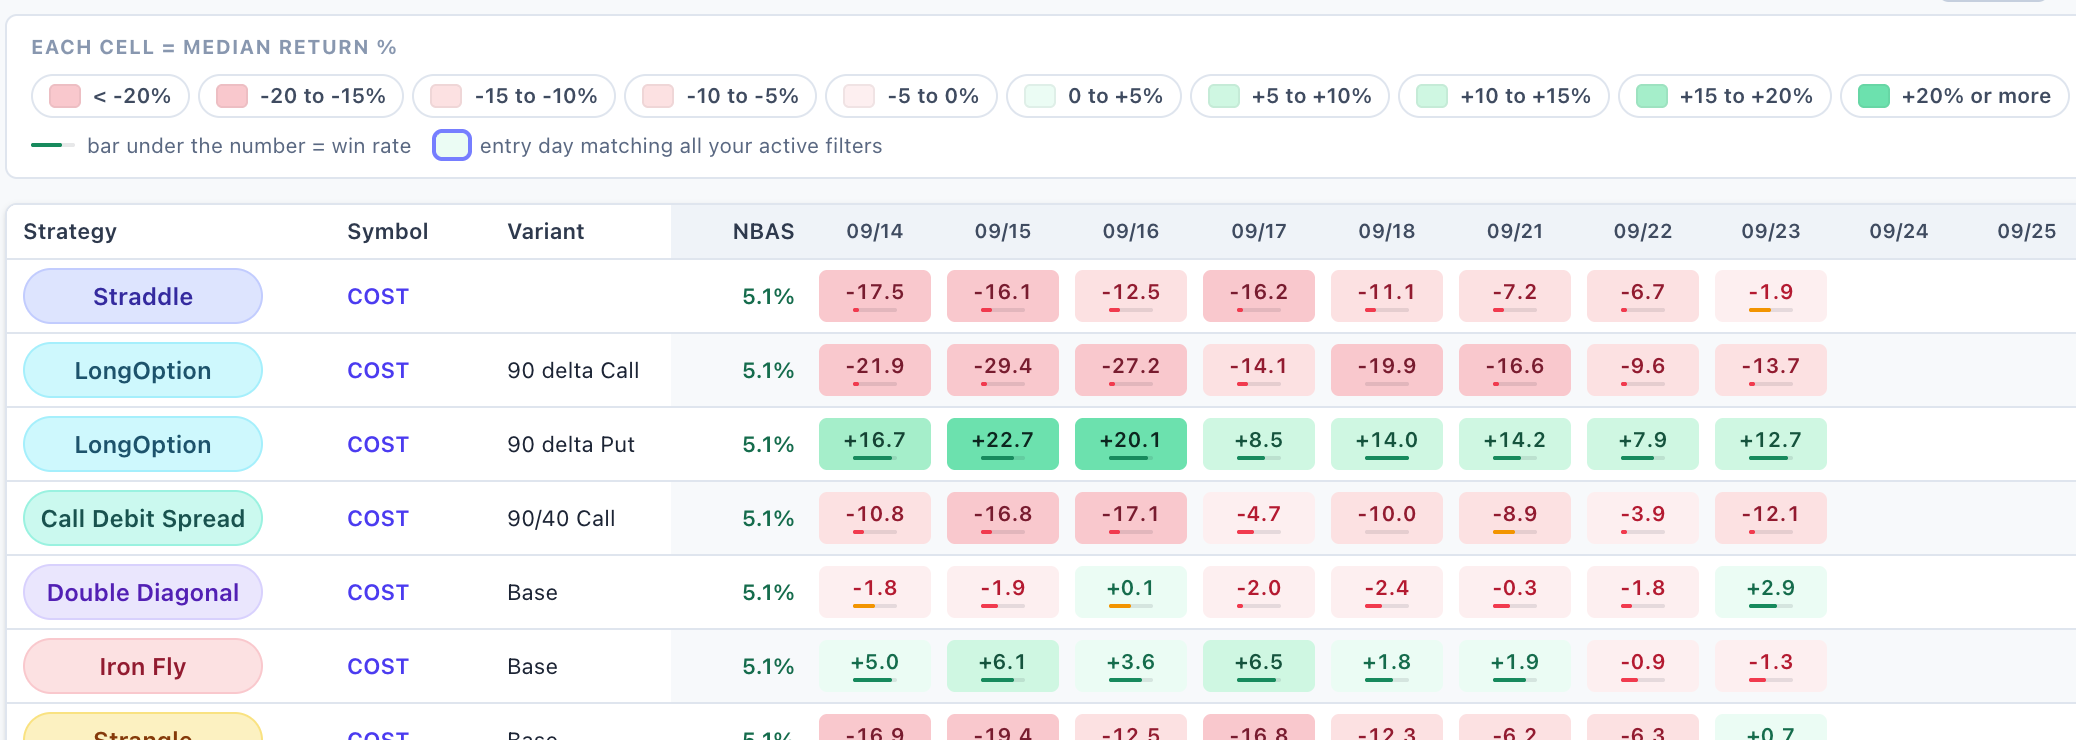
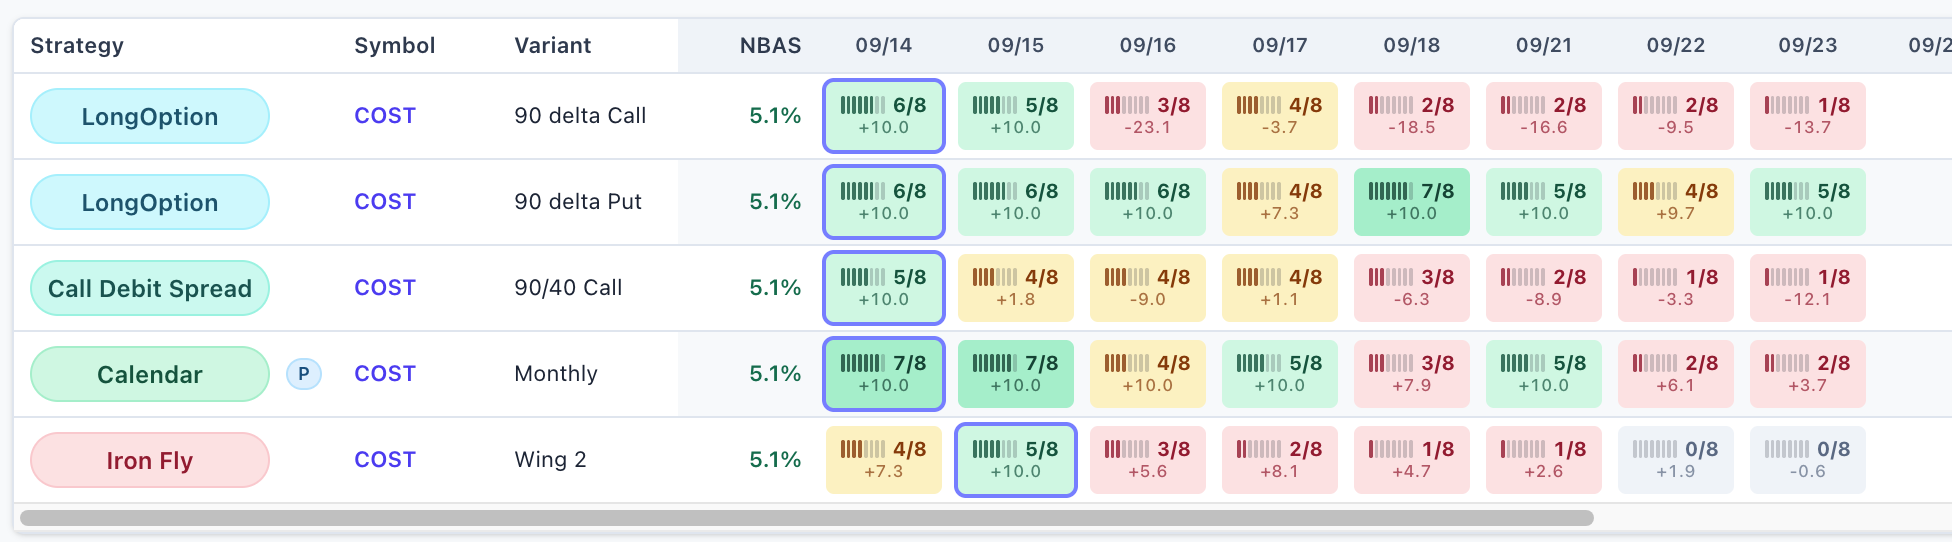
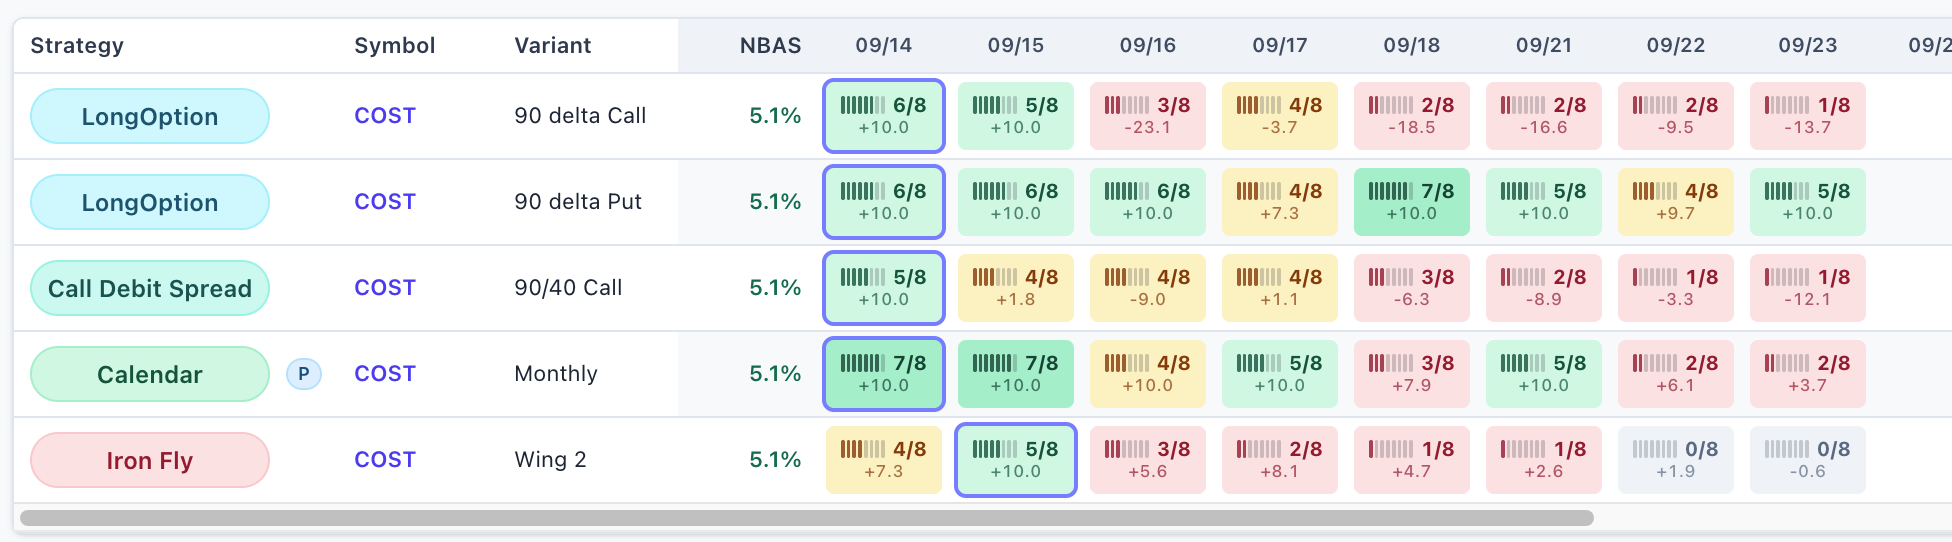
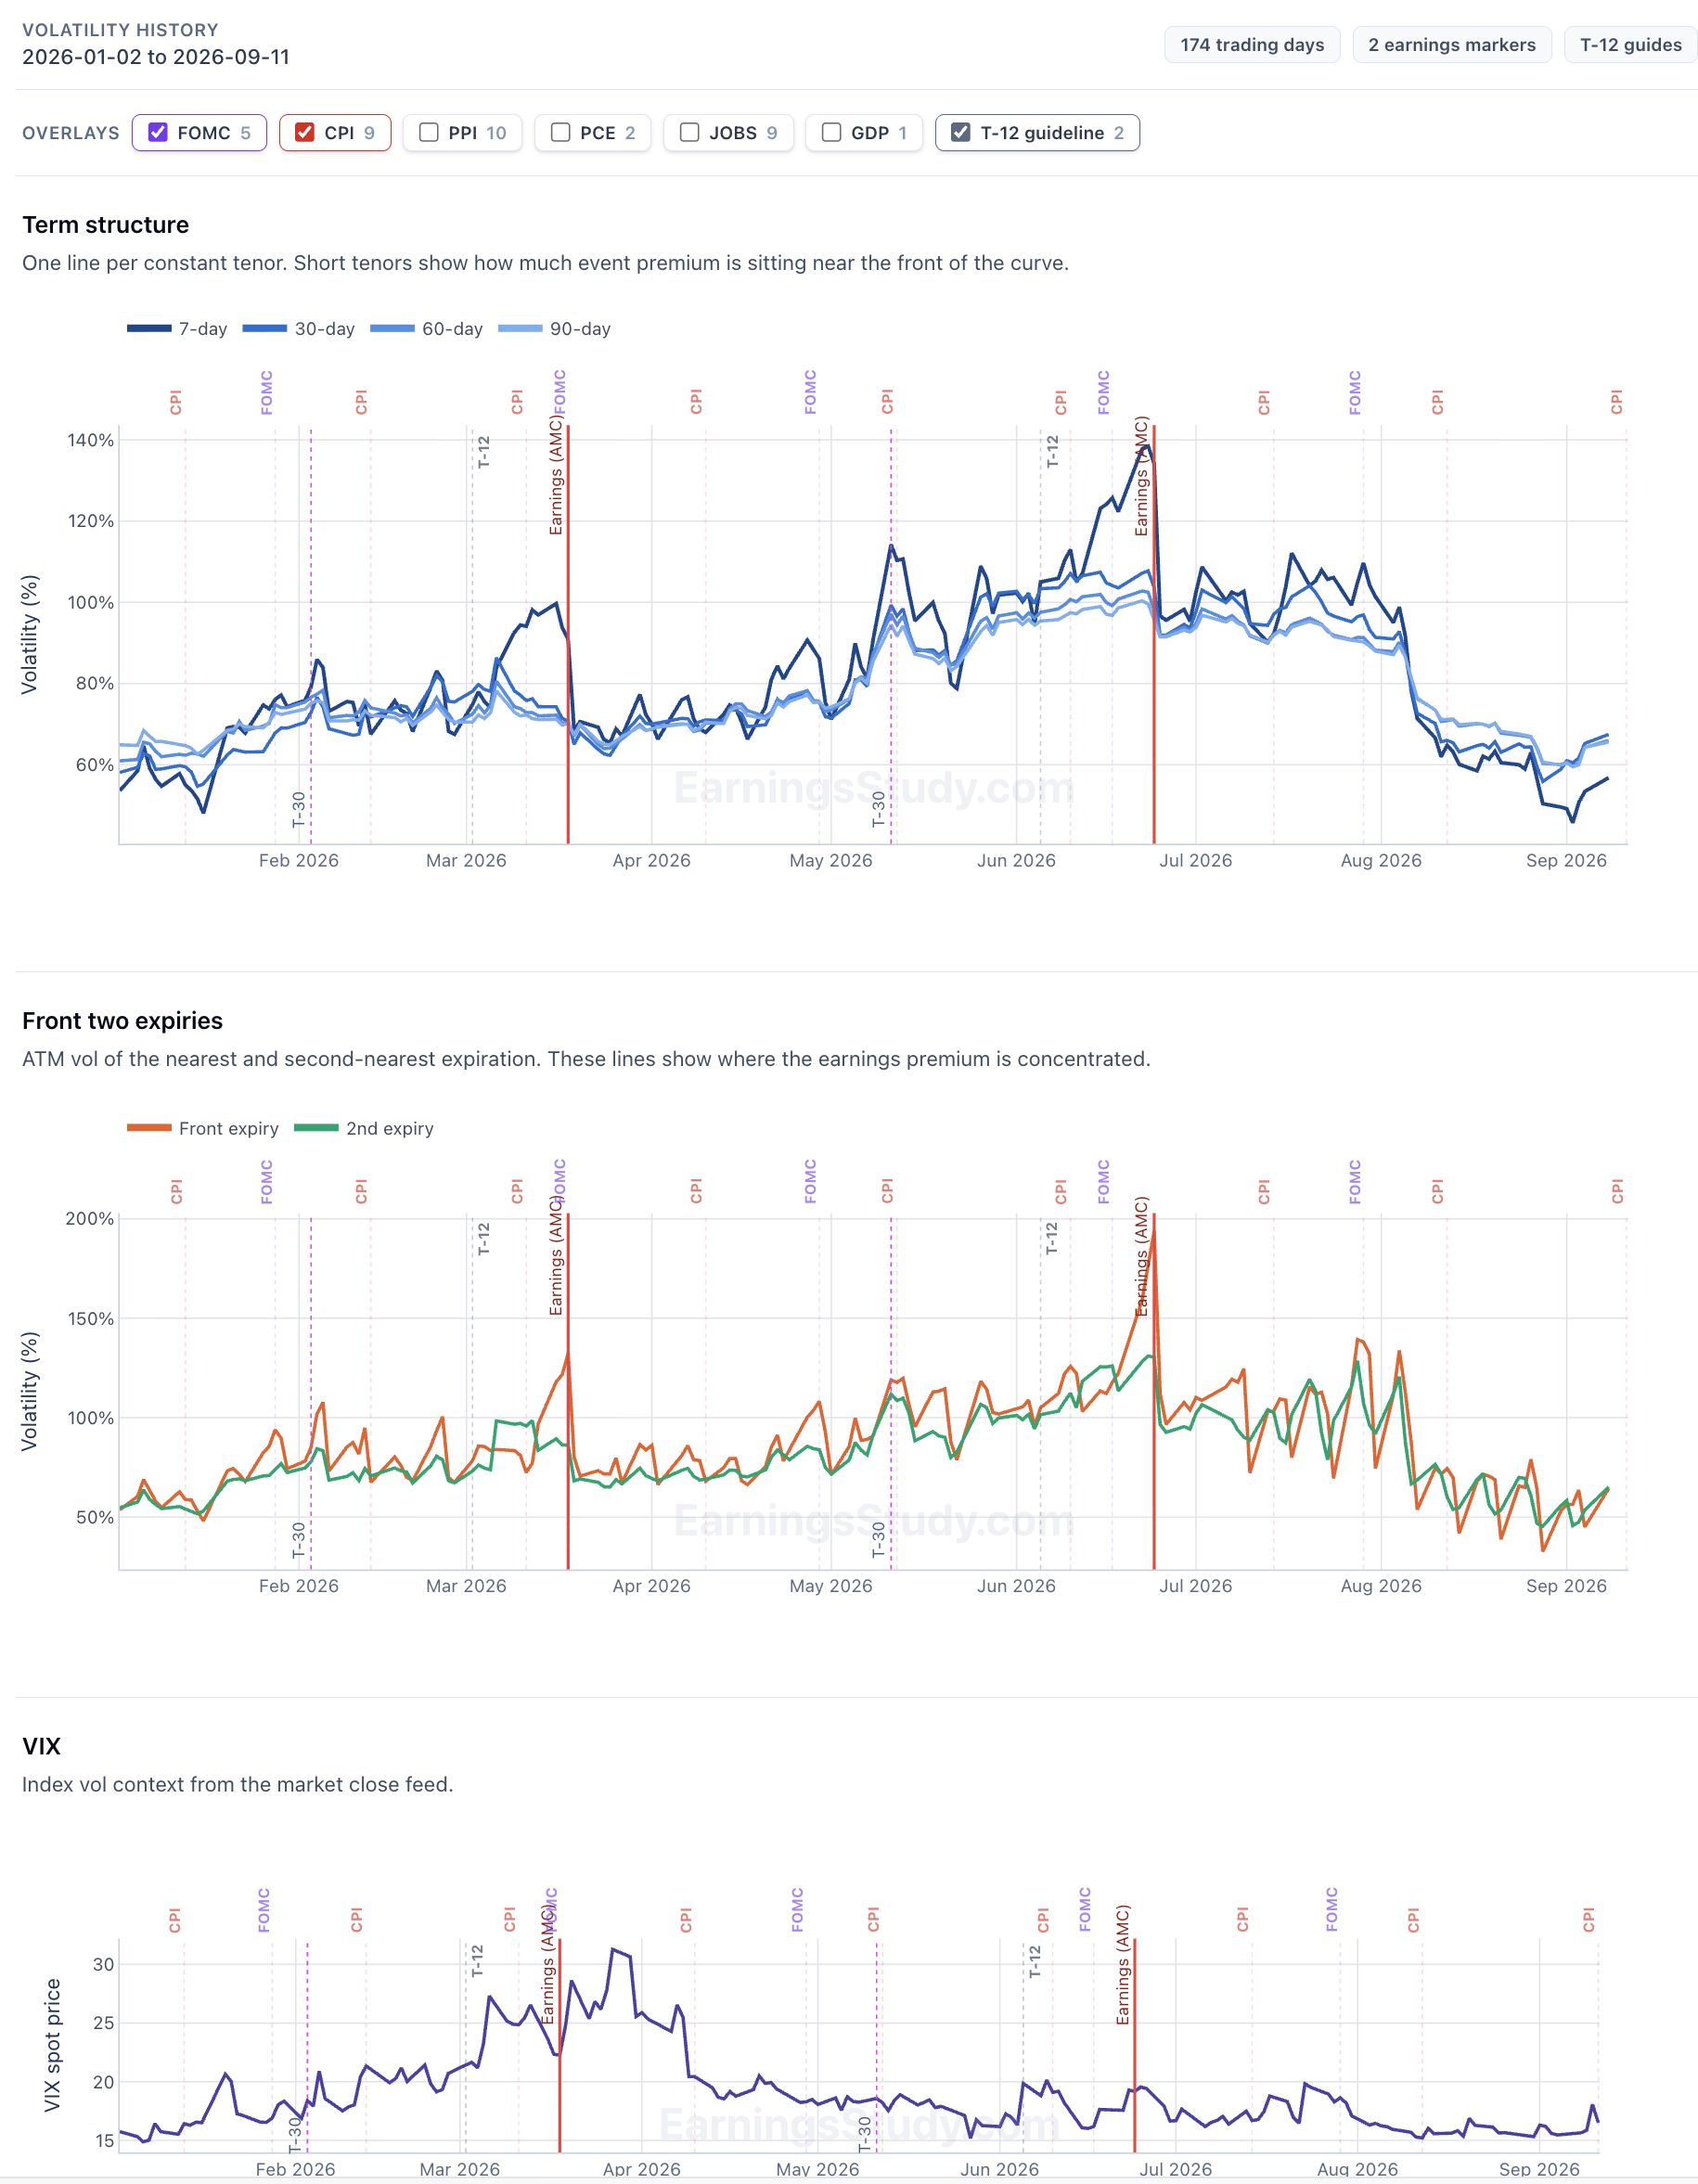
What's new: exit rules on the Daily Screener, and a look at the volatility term structure Two features shipped this week. They came out of the same complaint, which was mostly my own: the screener was very good at telling me when to get in and said almost nothing about when to get out, or about what volatility was doing while I waited. 1. The Daily Screener now understands exit rules Until now the screener answered exactly one question: if I enter on this date and hold to T-0, what did that return across the last N earnings cycles? That's a real question. It's also a strangely rigid one. It assumes you sit through the entire pre-earnings window no matter what the position does — that a trade up 30% at T-7 and a trade up half a percent at T-7 are the same trade, because you're holding both to the same day. Anyone who actually runs these knows that isn't how it goes. You take the money when it's there. So there's now an Exit rule control, and it's the first thing in the filter row. Hold to T-0 is the screener you already know. Take profit at +10% re-scores the whole board against a different plan: leave the moment the position is up 10%, and only hold to T-0 in the cycles where it never gets there. Every number on the page then answers the new question instead of the old one. That's the whole feature. What a cell tells you now With a target selected, each cell leads with how many past cycles reached it — one small block per cycle, filled where it hit — and the median return of that rule underneath. The block strip matters more than it looks, because it carries the sample size as well as the hit count, and the number of qualifying cycles isn't the same for every symbol. A newer listing might only have two or three on file. 2 of 2 and 8 of 8 are both perfect scores; only one of them is evidence, and now you can tell which without opening anything. Grey cells are their own answer: no cycle ever reached the target, so every cycle fell back to holding and the figure shown is just the hold-to-T-0 return. Not a target result at all. The example that convinced me This is COST, real board, last N cycles. Held to T-0, the 90-delta long call is a bloodbath across the first three entry days: −21.9%, −29.4%, −27.2%. On the old screener you'd skip it without a second thought, and you'd be right to. Switch the exit rule to +10% and the same three entry days read 6 of 8, 5 of 8, 3 of 8. The trade gets there. It just doesn't stay there. Held to the end it hands everything back and then some; taken at +10% it worked in six of the last eight cycles from that entry day. Click any cell for the receipts (Full details shows up on the right pane) [Subscribe to see more details] 2. Volatility term structure, through the pre-earnings window The second feature answers a different complaint: IV is up — is that my earnings, or is that the macro calendar? The volatility chart now plots the term structure across the run-up: the 7, 30, 60 and 90-day tenors together, plus the front and second expiry IV, from T-30 through to earnings. Seeing the tenors on one axis is the point. A front expiry pulling away from the back of the curve is the earnings premium building, and you can watch it happen day by day instead of inferring it from a single number. Flat separation means the premium isn't there yet. Macro events are marked on the same timeline — FOMC, CPI, PPI, PCE, jobs, GDP — which is what stops you misreading the chart. IV rising into your entry doesn't automatically mean the earnings premium is inflating; sometimes there's a CPI print sitting inside your holding window doing it instead. Those are two different trades and they deserve two different decisions. Where to find all this The profit-target view is now the default Daily Screener. Nothing is hidden — set the exit rule to Hold to T-0 and you have exactly the board you had last week, and the Classical View button next to the filters takes you back to the old layout entirely. There's also a Help button on the screener now that opens a full walkthrough in the side panel: how to read a cell, what the colors mean, and the win-rate-versus-hit-rate distinction above. Worth five minutes before you rely on the numbers. How I use it now Spread filter to the tightest bucket first — liquidity before edge, as always. Exit rule to +10%, Hit rate % to 60% or more. Scan for strong cells in the early columns. An entry day well before earnings gives the target room to get there. Open the cell and read the cycle list before committing to anything. If the hit rate rests on two cycles, I haven't found anything yet. As always: if there's a number you wish the screener showed, send me a message. That's how both of these got built. SO members on the ALL bundle: full core access to EarningsStudy is free through the partnership — just sign in at earningsstudy.com with your SO email. Everything above is historical and educational analysis, not a trade recommendation or financial advice. Options trading involves substantial risk. Historical figures are derived from end-of-day data and will differ from intraday markets and from your actual fills.

 3 points
 -
3 points
-
@Yowster thank you very much for this summary ... it was a tough year and my SO account ended up slighlty in the red (-0.31% before comms, -1.2% with comms).... but I am not deterred going into 2026 as this strategy has a risk:reward profile that I can better manage .... I have been working on improving my knowledge of the put calendar trade strategy so that I can be more proactive with my trades instead of waiting for alerts in the forum ... I will keep in mind the observation that RV's with slightly higher than previous cycles may make good trades ... thanks again to all SO members and looking forward to a prosperous 20263 points
-
Well, I wouldn't necessarily say that. The model portfolio is $10k, but I use a $20k portfolio so all my trades are double size. Since Yowster starting managing the strategy in July 2024, I've had total profits of ~$14,300 after paying ~$2735 in commissions. I just switched to using Tradier for this strategy in May, so most of the commissions are from IB. I'm pretty happy with it overall. Maybe I should have not overemphasized the commission difference in my prior post because if you can't use a cheaper brokerage, the results have still been pretty good with IB3 points
-
I use IB for a lot of trading, but these TLT trades, in my opinion, are too expensive there so I use Tradier for them. However, I made these trades at IB before I switched to using Tradier so I can give you real numbers on the commission differences. Over several hundred contracts of TLT butterflies at both brokers, my average commission per contract at IB was (EDIT: $0.5041....not the $1.138 I posted originally) and my average at Tradier is (EDIT: $0.11925...not the $0.214 I mistakenly posted originally. Tradier does charge a $10/month for Tradier Pro, which is spread across many other contracts for me. But even if you only traded these TLT trades at Tradier and you only did 15 butterflies per month, it would cost you around (EDIT: $14.31 commission...not the 25.68 I originally posted) + $10 monthly fee = $24.31. Whereas at IB, the same trade would be roughly (EDIT: $60.49...not the $136.56 I originally posted). Those are total costs to open + close just as a comparison of the difference3 points
-
Not sure if it helps to community but Schwab and ThinkOrSwim seems to be experiencing outages of completely not letting users login nor do transactions once logged in (website seems to allow login). Seems to be consistent with DownDetector dot com reports...2 points
-
😂 Dave has broken nothing. Dave has found things — which is worse, because then I have to fix them. Three in one week. At this rate I'm putting him on the payroll or blocking his account, I haven't decided! Now I'm back, come on Dave, still waiting for your questions ...2 points
-
Thank you @Kim — and welcome to everyone who registered this week. A few of you asked what's actually inside. Fair question — the screenshots only ever show a corner of it. Here's the full picture, same platform for both paths: free with the All-services bundle for as long as you keep it, or $39.99/month at the introductory rate, grandfathered at whatever price you join at. The scale of it first, because it's the part you can't see from a screenshot. This isn't one strategy with a win rate on top. The platform models 27 distinct strategy variants on every name: Calendars — put and call, each at monthly or 1–5 weeks: 10 variants Strangles — ATM, ATM+1, ATM+2 wings Iron Flies — base, wing 1, wing 2 Double Diagonals — base, wing 1, wing 2 Long options — 40Δ and 90Δ, calls and puts Straddles and call debit spreads Few more strategies to be opened for public soon Every variant gets its own full return matrix — entry day × exit day, median historical return per path, every underlying earnings cycle preserved. Across 2,000+ symbols with backtested history, that comes to over 191 million backtested entry-to-exit outcomes sitting behind the screens — recomputed as new cycles complete, refreshed every trading day. When a tile shows you "Win 88%", the cycles behind it are one click away, with the VIX each one happened under. No summary stat without its receipts. How you actually use it, day to day: The Summary page — type a symbol, get the whole picture on one screen: next earnings date, current setup, where today's relative volatility sits against that name's own history, and the suggested structure. It's the "should I even look closer?" page. The Daily Screener — every name opening an entry window, across all variants at once, filterable by median return, win rate, strategy, weeklies, and spread. Liquidity (NBAS) is one gate among several, not the headline — probability and consistency do the ranking; the spread column just keeps the backtest honest about fills. The return matrix — the deep dive. Compare entering T-12 vs T-5, exiting before the print vs holding through it. Click any cell for the cycle-by-cycle history. Holding through the print — the matrices don't stop at T-0. The T-0 → T+1 paths show what historically happened when a position was held through the release — for every variant, every name. Whether holding through earnings has historically paid or punished on your specific setup isn't a debate; it's a column. Post-earnings outcome analysis — after each print, see how the setups you were watching actually resolved, so the review loop is built in. Peer earnings view — read HD's print against TGT and WMT before they report. Read-through weeks are half the season. Macro events calendar — FOMC, CPI, PPI [+GDP/PCE/JOBS if live] next to the earnings calendar, because some weeks the vol you're buying isn't earnings vol. And it's not just a calendar: the same backtest engine runs on macro events too — 130,000+ backtested outcomes on straddles and strangles entered around scheduled macro releases. Watchlists, favorites, and setup tracking — pin a setup, watch its pricing and expected move evolve daily through the print, review it after. Every tracked setup becomes a lesson. And it keeps moving. Check the What's New page: 8 additional features shipped in the last 4 weeks (we are not even 2 months after go-live) — the spread filter, peer earnings date overlaying on RV charts, macro events overlaying on charts...— nearly all of them because someone here asked. Lately the pace has been one to two releases a week, and the roadmap is mostly this thread's questions, ranked. If something's missing or confusing, DM @Kim or @krisbee — that's how the product gets built. Everything in the platform is historical/educational analysis, not trade recommendations or financial advice. Options trading involves substantial risk.2 points
-
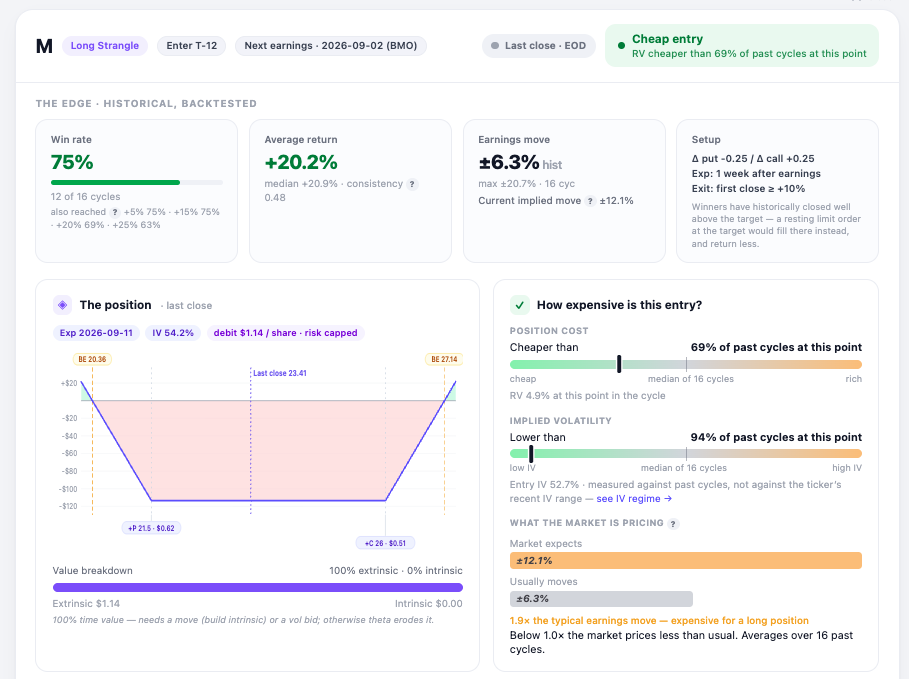
What a pre-earnings card looks like now Several people asked what the scanner actually shows once you open a row, so here is one from Friday — Macy's, long strangle, entry window opening at T-12. Two things I reworked this week. The entry readings now sit on a fixed scale. Cheap on the left, rich on the right, needle where this setup falls against its own history at the same point in past cycles. Position cost is a little below the median of 16 cycles; implied vol is near the bottom of the range. Before, the bar filled from the left in both cases and you had to read the label to know which direction it meant. Below that, what the market is pricing against what the stock usually does: ±12.1% implied versus a ±6.3% average earnings move. Roughly twice the usual — which matters, because this position is bought, not sold. The line worth pointing at, though, is on the setup tile. The exit rule is "first close at or above +10%", and a close is not the threshold — it is wherever the market happened to finish that day. Across the backtest history the median winner books well above the target. So a resting limit order at +10% would fill at +10% and return less than the numbers on the card. Worth knowing before you place the order. Free to look at: https://optionbench.com Not investment advice — the tool describes what setups have done historically, your broker's chain is where you check whether it fills.
 2 points
 -
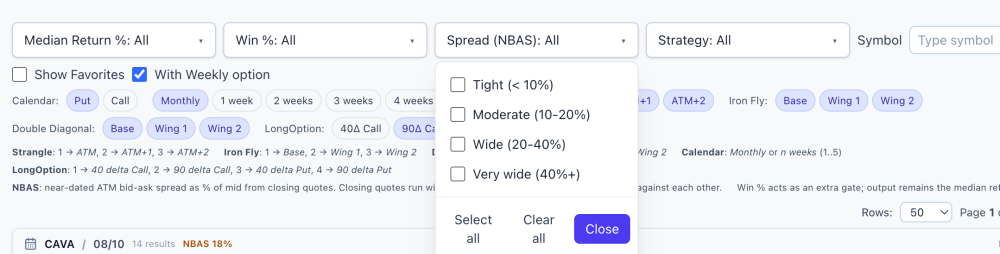
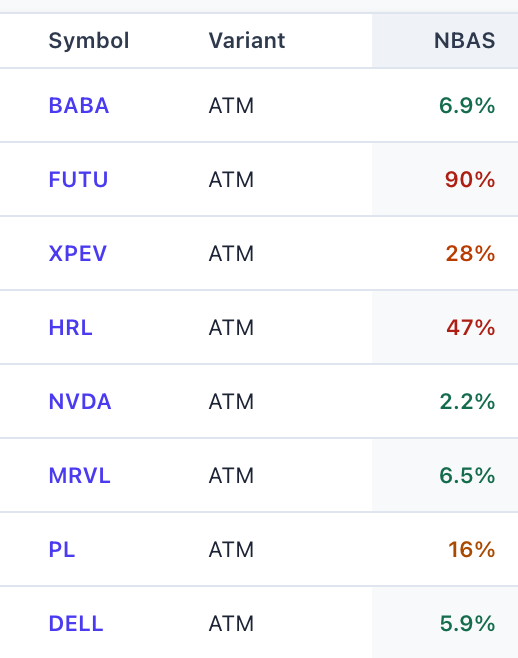
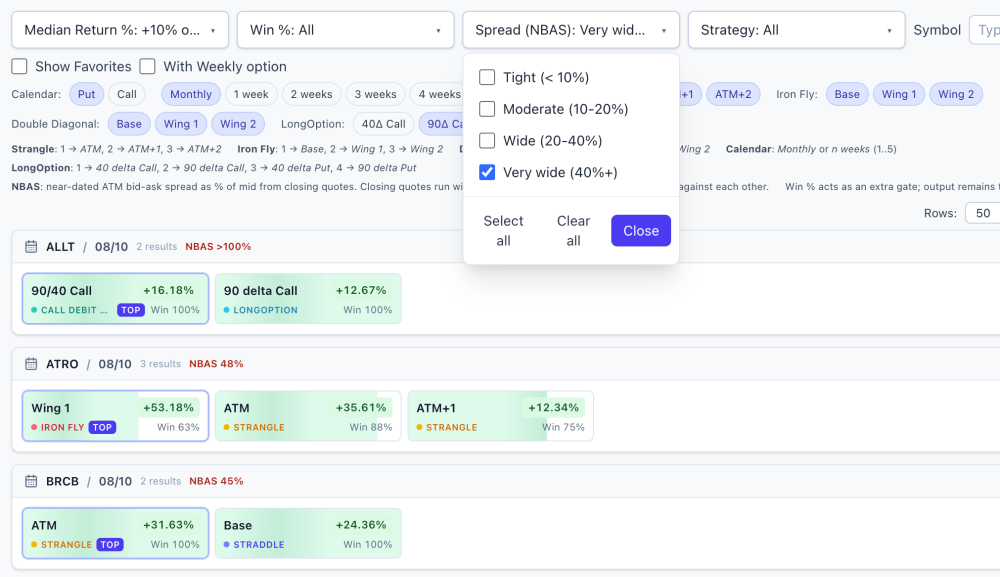
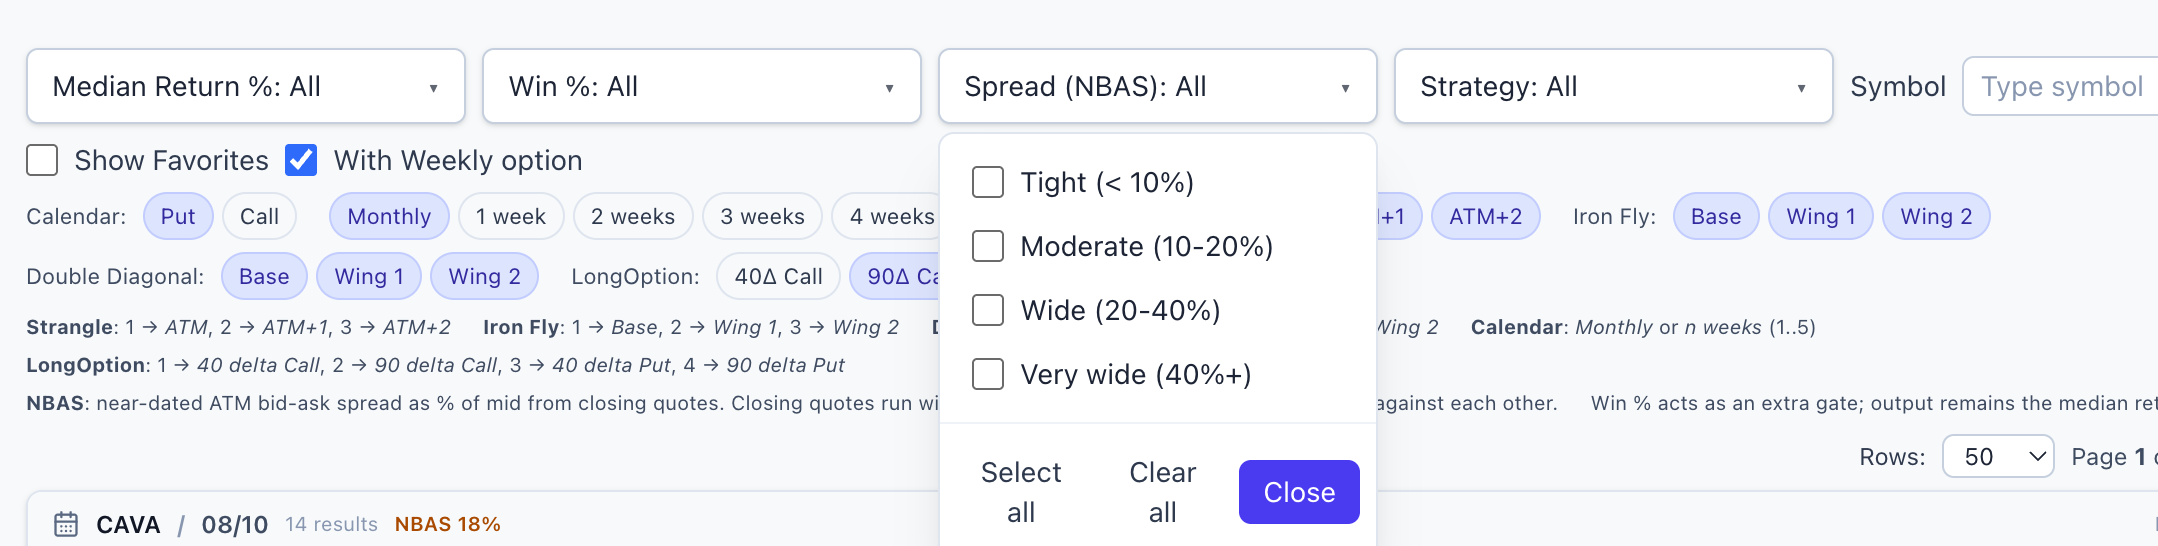
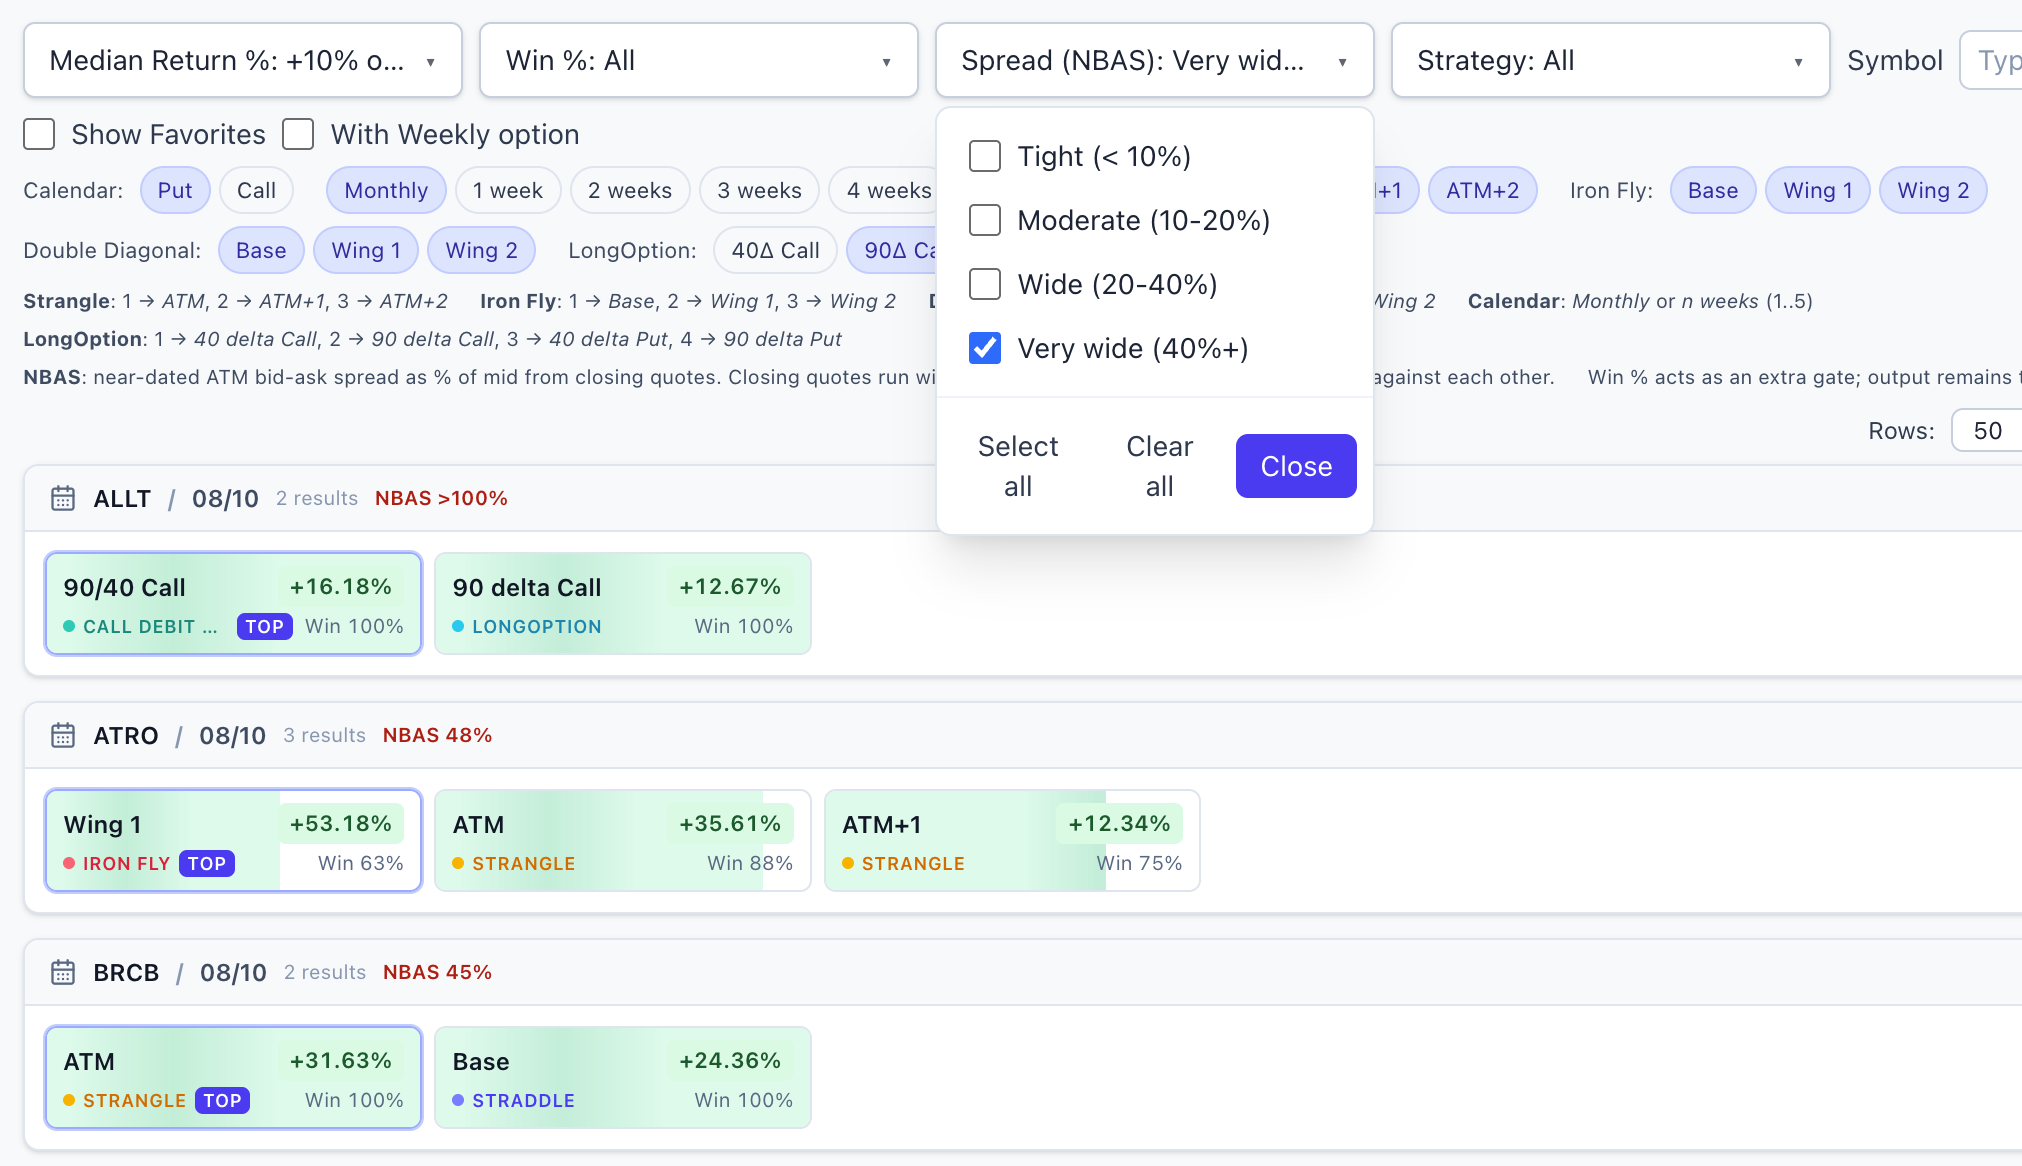
New on the Daily Screener: a liquidity check on every setup @FrankTheTank recently asked me a question that's harder to answer than it sounds: "How many of these setups could I actually get filled on?" It's the right question. A screener can show you a beautiful historical edge — high win rate, strong median return — on a name whose options trade so wide that the edge exists only on paper. The backtest gets a clean theoretical price; you get the spread. Wide bid-ask markets are how a good-looking backtest quietly becomes a bad live trade, and most tools simply don't warn you. So now the screener does. Every symbol on the Daily Screener carries an NBAS value — a normalized measure of how wide its options markets are, derived from the same market data the historical numbers are built on. Lower = tighter markets = the numbers on your screen are closer to something you can actually have. You don't need to know anything about how it's computed to use it: it's color-coded right in the table — green is tight, amber and orange are questionable, red is wide, and a "—" means the name had no measurable liquid options at all, which is its own answer. How to use it Next to the Return and Win % filters there's a new Spread (NBAS) dropdown. Select the tightest bucket and the board shrinks to names where the market is liquid enough that the historical numbers deserve your attention. When a spread filter is active, unknown-liquidity names are excluded too — if liquidity can't be measured, that's a caution flag, not a free pass. The honest part Building this taught me something I wasn't fully expecting, and I'd rather tell you than have you discover it the hard way: once you screen for liquidity honestly, a lot of the board falls away. Far more names than you'd guess carry markets too wide to trade well — including some with genuinely impressive historical stats. That's not a flaw in the backtests; it's the difference between an edge that existed in the data and an edge you can collect. This column exists to keep those two things from being confused. Two caveats so nobody over-reads the number: It's a relative ranking, not a fill forecast. The measurement comes from end-of-day data, and closing markets run wider than what you'll typically see intraday on liquid names. Use it to compare names against each other and against the backtest's own pricing basis — not as a prediction of your fill cost tomorrow morning. A tight spread is a prerequisite, not a signal. Green doesn't make a setup good — it just means the market will let you have it near a fair price. It filters out false edges; it doesn't create real ones. Before shipping, the values were cross-checked against independent live quotes on several names and lined up well. The number measures what it claims to measure. That screenshot is the whole reason this feature exists: a setup with strong historical stats that you should almost certainly never touch, because the market for it barely exists. Before this column, that row looked identical to a real opportunity. My updated morning routine Open the Daily Screener → set the Spread filter to the tightest bucket → then start reading win rates and medians. Liquidity first, edge second. An edge you can't collect isn't an edge, so there's no point evaluating it. This feature shipped because someone here asked for it — which is how most of the platform gets built. Curious about the methodology details? They're documented inside the app for members. And if there's a number you wish the screener showed, or a question you keep answering by hand, say so here or DM me. The fastest way to get a feature is to complain about its absence. Thanks to @FrankTheTank @Bhavan1986 for sparking the idea & and to my teammates @Kim @Yowster @TrustyJules for helping shape the app! How to access it Already using EarningsStudy? The Daily Screener is now in your sidebar — just sign in and open it. Not signed up yet? Register at https://earningsstudy.com/ with the same email you use on SteadyOptions, and you'll have it alongside the rest of the core platform. This is exactly the kind of thing we set out to do with this partnership: take the tools that were once behind an extra tier and put them in the hands of the whole community. More to come. — The SteadyOptions Team SO members on the ALL bundle: full core access to EarningsStudy is free through the partnership. Everything above is historical/educational analysis, not a trade recommendation or financial advice. Options trading involves substantial risk. Liquidity measurements are from end-of-day data and will differ from intraday markets.
 2 points
 -
Anchor Trades First half of 2026 Summary: Anchor model portfolio was up 12.5% in first half of 2026 vs. 9.6% return of S&P 500. Since inception in 2019 Anchor model portfolio is up 345.3% vs. 199.2% return of S&P 500. Since the end of 2022 when both Anchor and S&P 500 were down, Anchor is up 150.3% vs. 95.2% return of S&P 500. Members who canceled in 2022 based on one negative year, all I can say is: Anchor continues crashing the S&P 500 year after year. Thank you again @cwelsh for an amazing management of the strategy! And congrats to our members!
 2 points
 -
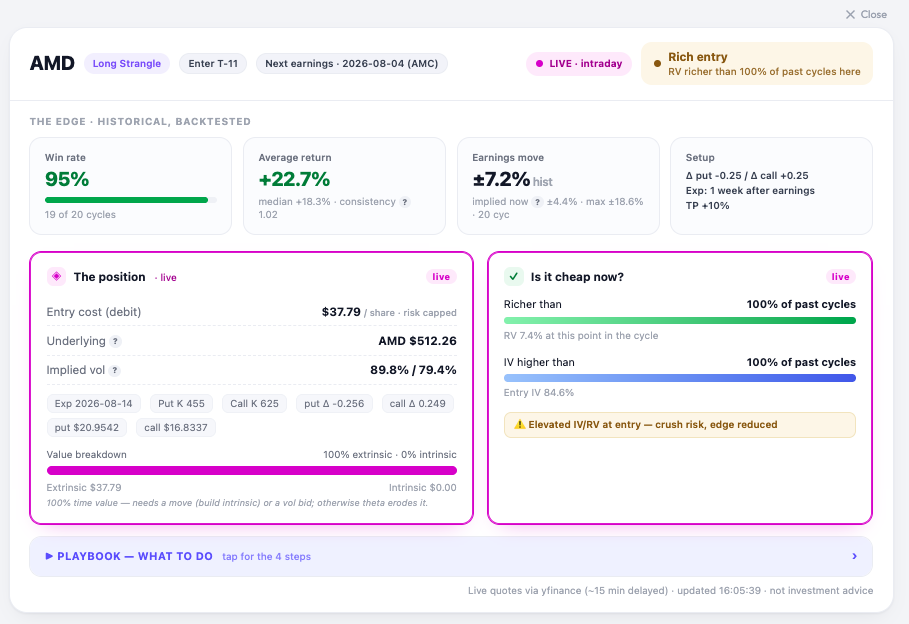
Update — at the open Markets opened, and here's AMD live: the strangle re-priced from $38.69 to $37.79, AMD gapped up to $512, and entry IV eased from ~87% to 84.6%. Marginally cheaper — but the verdict didn't budge: still "Rich entry," still richer than 100% of past cycles, still flagged for crush risk. On the charts, the live-value diamonds sit at the very top of every panel — value, relative value, and IV. Translation: the setup got a little bit cheaper, not cheap. It never dropped into its normal P25–P75 band, so the disciplined read is unchanged. Personnally I would pass, and let the backtest stay a backtest for this cycle. That's the tool doing its job: a 95% historical win rate is only worth having if you don't overpay to get in, from my POV. Romuald - OptionBench
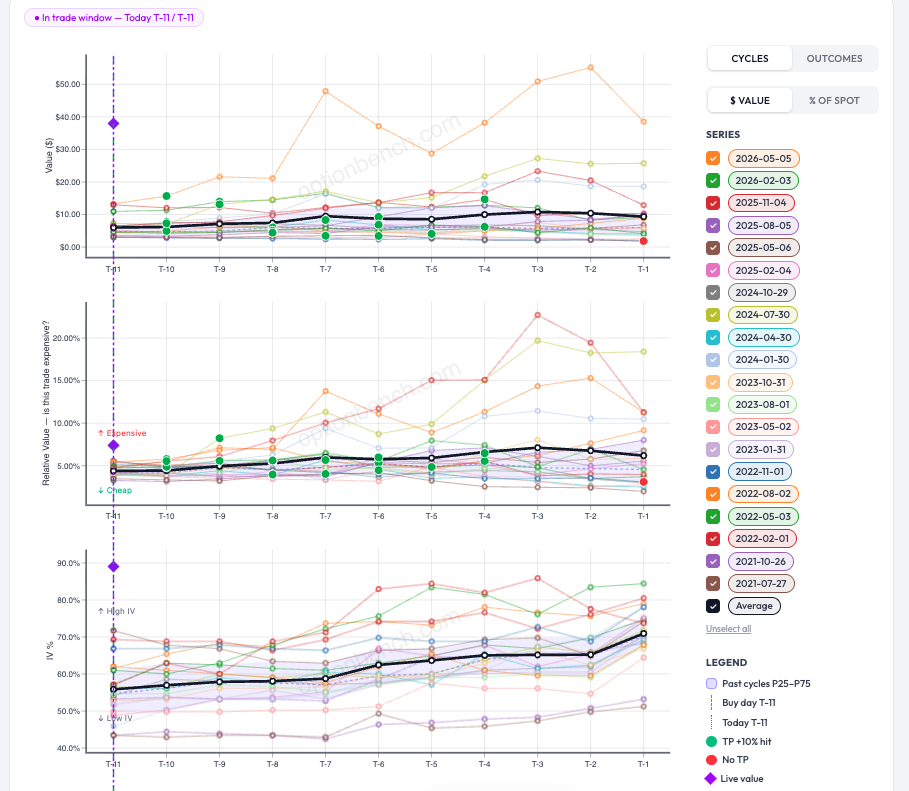 2 points
 -
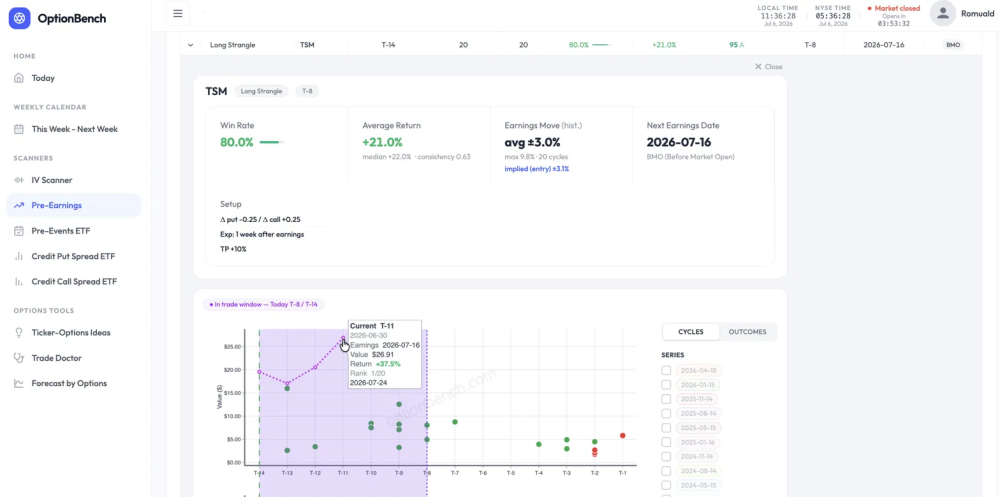
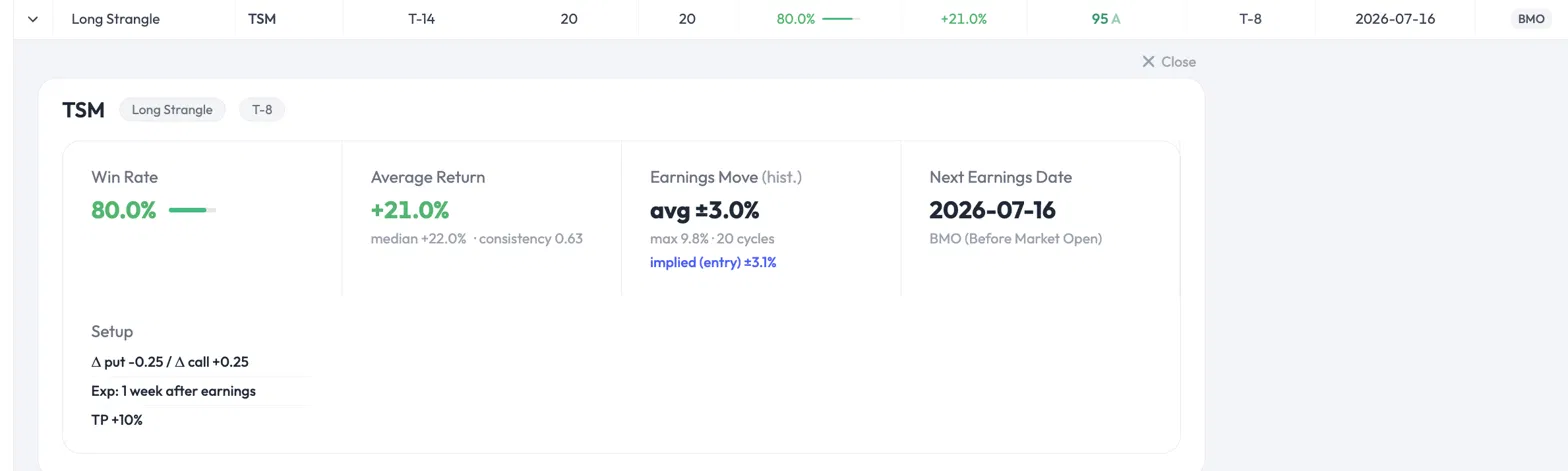
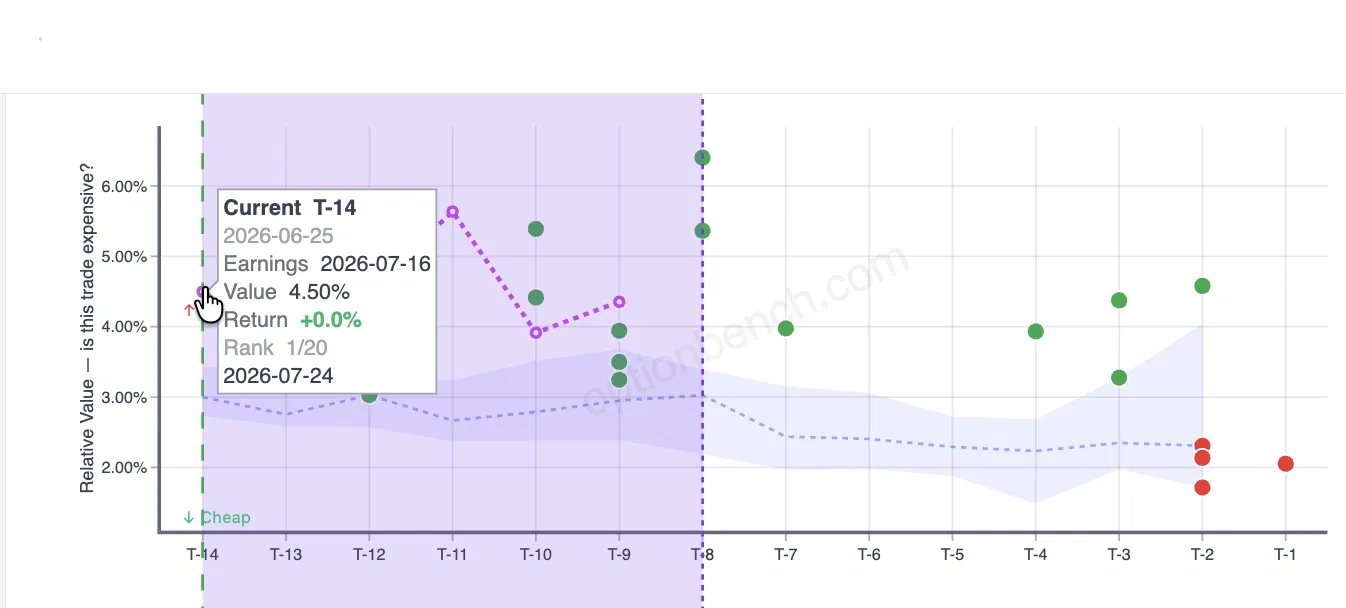
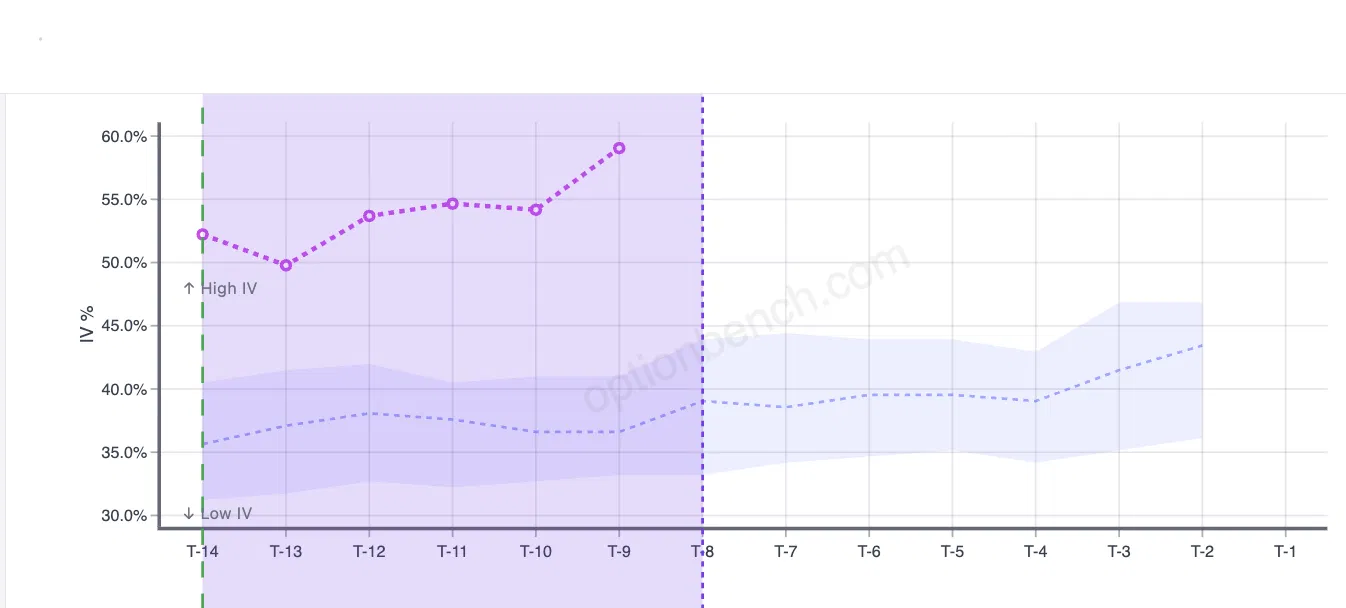
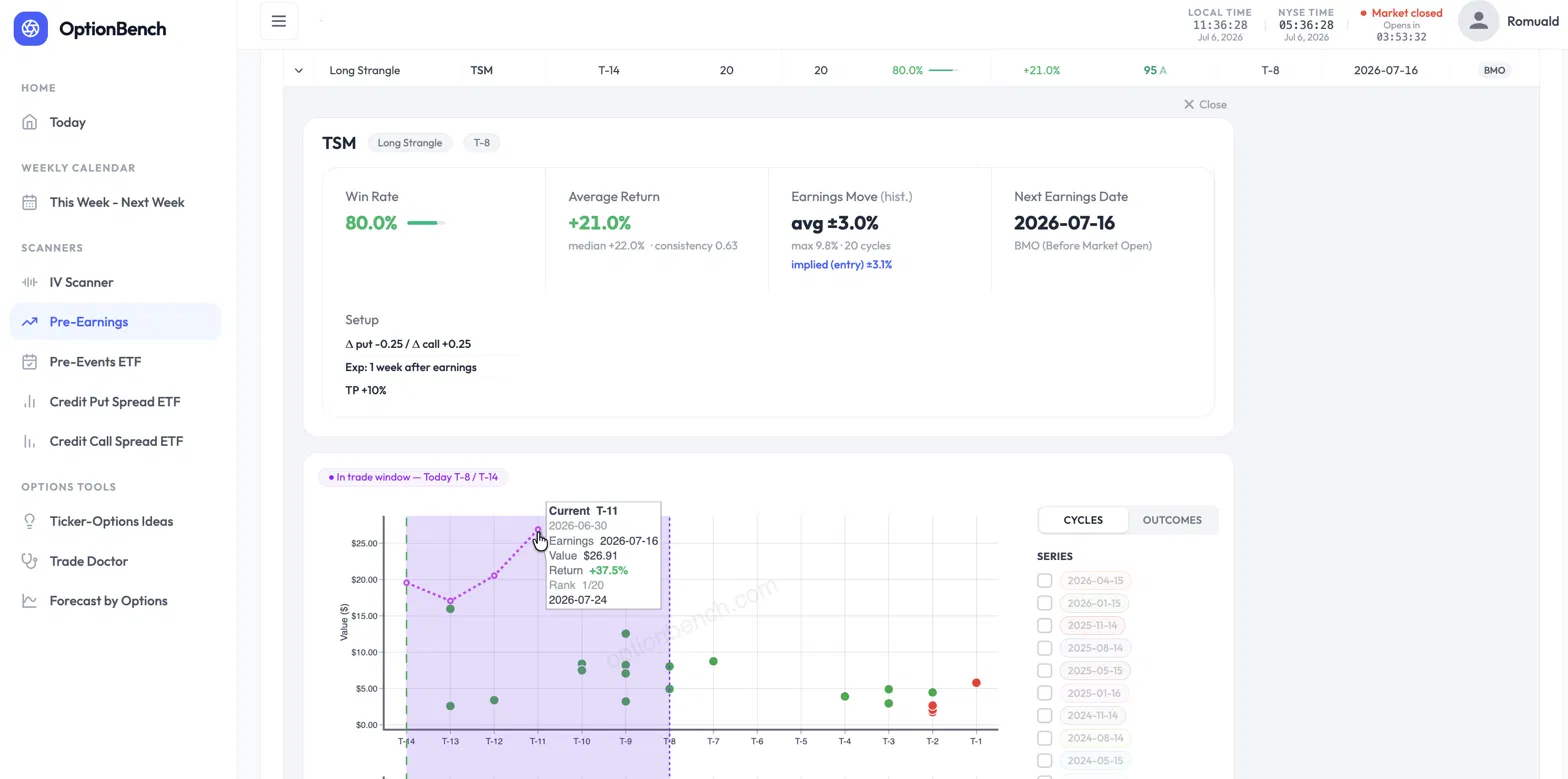
An 80% Win Rate on One of the Most Expensive Entries in the Ticker's History. Would You Take It? Here's a trade the OptionBench pre-earnings scanner flagged, and a question worth sitting with before you read the answer. [CAPTURE 1 — Win Rate 80% / Average Return +21% (median +22% · consistency 0.63) / Earnings Move avg ±3.0% implied ±3.1% / Next Earnings 2026-07-16] TSM reports earnings on July 16. The scanner flags a Long Strangle entered fourteen trading days out — on Thursday, June 25 — with Δ ≈ 0.25 on each side, expiring one week after earnings, taking profit at +10%. The headline numbers look strong: an 80% win rate over 20 past cycles, a +21% average return, a +22% median. Then you look closer, and two things should make you hesitate. First, the strangle is expensive. Its cost as a share of the underlying — the entry's relative value — sits at 4.5%, against a historical average of about 3.1% at this point in the cycle. Second, implied volatility is elevated: around 52% at entry, climbing toward 59%, well above the ~37% this name usually carries here. Every instinct trained on "buy low, sell high" says the same thing: it's expensive, IV is high, wait for it to come back down. And here's the part that should really give you pause — this entry isn't just above average. It ranks among the most expensive entries the scanner has on record for TSM at this point in the cycle, with implied volatility near the very top of its historical range. So: one of the most expensive entries on record, IV at its highs, and every reflex telling you to pass. Would you take the trade? The instinct that costs you the trade Most traders pass here, and their reasoning feels airtight: if it's the priciest it's ever been, mean reversion says it gets cheaper, so I'm overpaying. That reasoning conflates two different things — the price of the option and its expected value. They are not the same axis, and treating them as one is the single most common way traders talk themselves out of good pre-earnings trades. Let me show you why, with this exact trade, using numbers you can pull from the scanner yourself. "Expensive" is not the same as "overpriced" The first question a rigorous trader should ask isn't "is this expensive?" It's "is the market pricing the move correctly?" [CAPTURE 2 — Relative Value « is this trade expensive? », tooltip T-14 : 2026-06-25, Value 4.50%] The scanner answers this directly. Two figures sit side by side in the banner: Implied move at entry: ±3.1% — the move the strangle prices in, averaged across the 20 past cycles at this entry point. Realized earnings move: ±3.0% — the actual average move TSM has made on earnings, same 20 cycles. These are essentially equal. The market is not systematically underpricing TSM's earnings move, and it isn't wildly overpricing it either. The strangle is priced fairly relative to what the stock actually does. So if the option is fairly priced on the move, where does an 80% win rate come from? If the market gets the move right, the edge can't be coming from a mispriced move. It isn't. And that's the whole point. Where the edge actually lives The edge in this trade is not a bet that TSM moves more than the options imply. It's the capture of IV expansion into the event. [CAPTURE 3 — IV % : IV rising from ~52% (T-14) to ~59% (T-9), above historical band ~37%] You enter at T-14. The plan is a good-till-cancelled order to take profit at +10%, exiting before earnings and the volatility crush. And if the +10% never triggers? You still exit before the print — the position is closed at T-2 (for a before-market report) or T-1 (for an after-market one), no exceptions. You never carry the trade through earnings. That's the key risk control: this strategy has no exposure to the earnings gap itself, win or lose. In the window you hold the position, the option premium tends to inflate as the market crowds into the event. You're not holding through the print and hoping for a big move. You're buying anticipation and selling it a few days later, richer. [CAPTURE 4 — Value $, tooltip T-11 (2026-06-30) : Value $26.91, Return +37.5%, Rank 1/20] On the current cycle, that's exactly what played out. Entered at T-14 near $19.57, the strangle was marked at +37.5% by the close of T-11 (June 30) — and earnings hadn't even happened yet. Now, you wouldn't have pocketed +37.5%: your +10% GTC would have filled well before that, somewhere in the intraday tape as the position ran up. The realized gain is +10%, the take-profit. But that +37.5% end-of-day mark is the evidence that the target was hit comfortably, and early. The move you'd have been "waiting to see" is irrelevant to this trade, because you're out before it happens. This reframes "expensive" and "high IV" completely. They aren't warning signs to avoid. They're the fuel. A cheap, low-IV strangle would have far less premium to expand. You want the anticipation. You're selling it, not buying into it. (One honest note for the careful reader, because it matters: the "realized move" measures the one-day earnings gap, while the "implied move" is priced by an option that lives a full week past the event. They're not a perfect apples-to-apples comparison — the option captures the gap plus residual post-earnings vol. If anything, that makes the "fairly priced" read conservative. I'd rather flag it than have someone catch it and assume I was hiding it.) What should have driven the decision Not the price. Not the IV level. The conditional statistics — the numbers the scanner exists to surface: Win rate: 80%, conditional on entering at T-14, over 20 cycles — meaning 80% of those cycles hit the +10% take-profit before the event. (It's a TP-hit rate, not a vaguer "was it green" rate; worth being precise, since it's the number the setup is actually built around.) Average return +21%, and — this is the one that kills the "it's an outlier" objection — median return +22%. The median sitting at or above the mean tells you the average isn't propped up by one lucky cycle. The typical outcome is a strong winner. This is a regular edge, not a lottery ticket. That distinction is everything. An 80% win rate with a median of +22% is a fundamentally different animal from an 80% win rate where the average is dragged up by a single monster cycle while everything else limps. The scanner shows you which one you're looking at, and here it's the good kind. The honesty that makes this defensible I'm not going to pretend this is a free lunch, because it isn't, and the scanner won't let me pretend. There's a consistency ratio of 0.63 on this trade — mean return divided by the standard deviation of per-cycle returns. It measures how regular the edge is, and 0.63 is moderate. The edge is real and it repeats, but there's genuine dispersion: the 20% of cycles that lose, lose meaningfully. This is a trade to size with control, not to back up the truck on. That's not a caveat buried at the bottom. It's the point. A tool that only ever tells you a trade is great is a marketing tool. A tool that hands you an 80% win rate and a 0.63 consistency ratio in the same breath is giving you what you need to size the position honestly. And one more line I won't blur: the current cycle is a single live data point, and a single data point proves nothing. That the take-profit was hit early this time is encouraging, not evidence. The case for entering doesn't rest on it. It rests on the 20-cycle conditional distribution: 80% of cycles hitting the +10% target, a +22% median across all of them. The live cycle is an illustration of that statistic playing out, not the proof of it. If you take one thing from this piece, take that sentence. The takeaway Don't confuse the price of an option with its expected value. They live on different axes. An option can be among the most expensive it has ever been — near the top of its own historical range, IV at its highs — and still be the right trade, because the price of the option and the odds of the trade are two separate questions. "Expensive" answers the first. The 80% win rate, the +22% median, and the 0.63 consistency ratio answer the second. That second set is what should drive the decision. The whole reason a tool like this earns its place is that it puts both answers on the same screen — so you're not passing on a good trade because an instinct trained on the wrong axis told you it looked expensive. Numbers in this piece are pulled directly from the OptionBench pre-earnings scanner (TSM, Long Strangle, T-14 entry on June 25, 2026, 20-cycle sample). Every figure — implied vs. realized move, median return, consistency ratio, entry relative value — is visible in the tool. Verify them yourself; that's the point. Beta-testing is ending by the end of July but you can still give your feedback and ask for signing in on the OptionBench Beta Web Site.
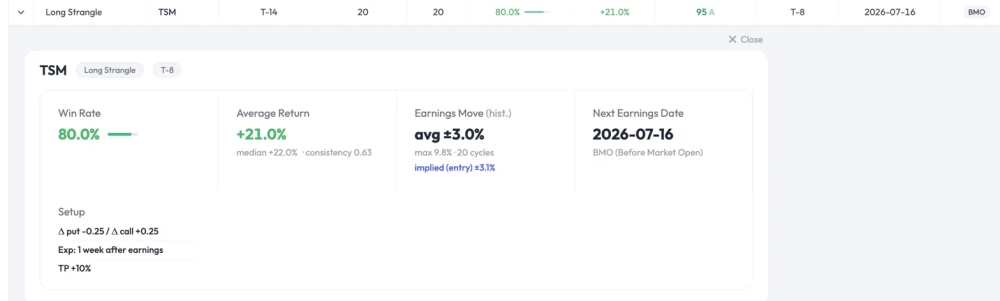
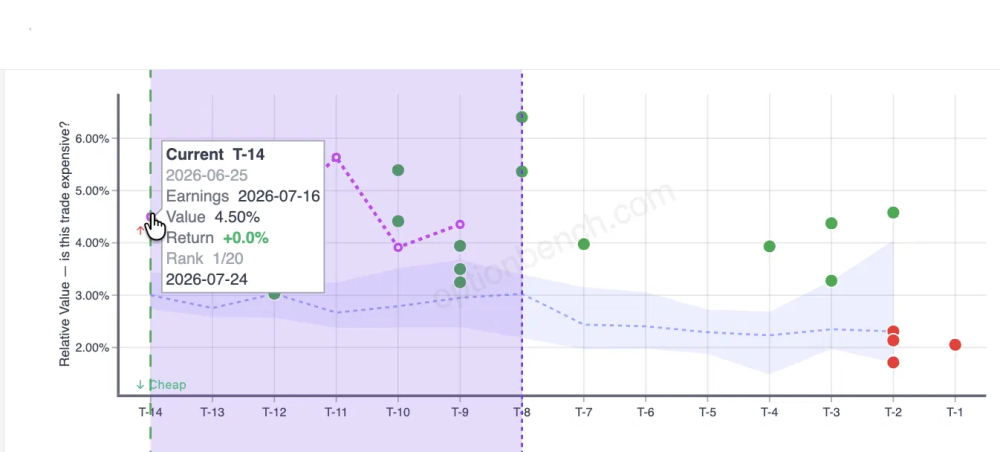
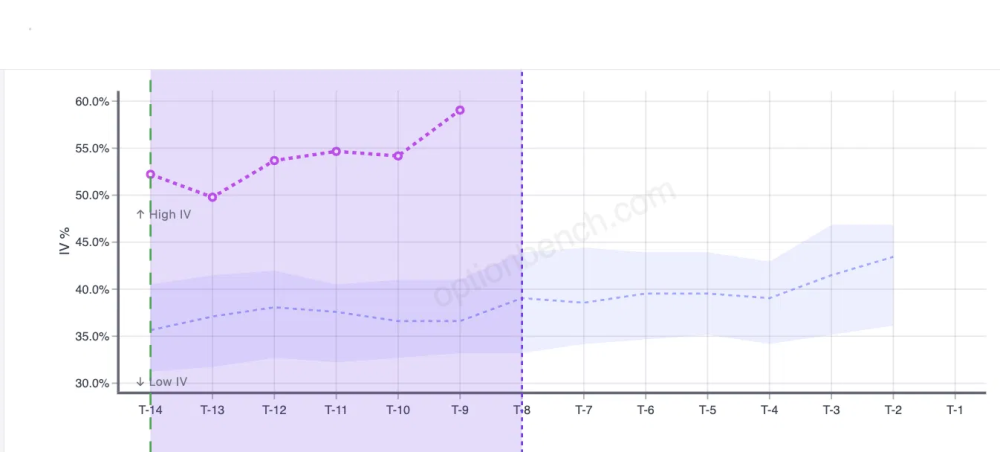
 2 points
 -
Yes, they are. The SEC announced the change on April 16, and allowed brokerages 18 months to implement it .This link from Schwab explains the change. In short: "...Under the new rules, traders will no longer be required to maintain a minimum account balance of $25,000 to engage in frequent margin day trading. Instead, eligible margin accounts of more than $2,000 will gain access to intraday margin buying power set by individual brokerages based on current positions and maintenance margin requirements. Currently, under the old rules, four or more day trades in five business days triggers a "pattern day trader" designation and the $25,000 requirement. Under the new framework, the pattern day trader designation will be eliminated, and day trades will no longer be counted...."2 points
-
I think it is specific to META, because there was some confusion in the code that it was trying to retrieve the stock price of FB instead of META sometimes and sometimes it was getting it from META. I think the RV calendar of META should be better now. I've added an override for GE, but just to be clear, it is the responsibility of each trader to confirm the earning date / time by looking at the official investor relations website. That is the only source of truth.2 points
-
We are pleased to expand our services offerings with a new strategy called SteadyYields. Here are the service parameters: Tailored for medium term active traders Model portfolio size - $10,000 Underlying -TLT Average holding period - 2-4 weeks 25-30 trades per year Profit target - 30-40%+ annually There is a long-term correlation between oil prices and constant maturity yields for the 10-year Treasury. SteadyYields is a trading strategy that takes advantage of this correlation. The strategy uses mix of strategies about 30-45 days from expiration. The spreads are designed to take advantage of the direction oil has provided, whether that be long, short or neutral. Details can be found on the members forums discussions. In addition, there are trades based on Monte Carlo simulations (employed to estimate the probability of exceeding a specific value) using very liquid, optionable ETFs such as GLD, QQQ, XLE etc. We recommend executing TLT trades with a low or no commission broker (like Tradier or FirstTrade). TLT is extremely liquid, scaling up will not be a problem.2 points
-
Recent GLD, IWM and AMZN trades traded 1 spread per $25k model portfolio (average size was around $2-2.5k per spread, close to 10% of the model portfolio). So with $1M account, you would do 40 spreads. I would say very doable for those stocks. Of course some stocks are lower prices and slightly less liquid, so for the model portfolio they traded 3-5 spreads, so you would need 120-200 spreads. Still doable, but you might experience a bit more slippage. Still, if you trade a $10 spread, even paying few cents more is not a big deal percentage wise. So the bottom line is: very easy and scalable for $100-300k accounts, a bit more difficult but still doable for $500k-$1M accounts.2 points
-
SteadyYields 2025 Summary: SteadyYields is our best performing service in 2025, producing 74.6% return. As always, we aim to under promise and over deliver. The strategies use highly liquid instruments like TLT, GLD, QQQ, XLE etc. They are fully scalable, low maintenance and easy to follow. Considering that we usually risk only 50-60% of the model portfolio at any given time, and the return includes one large loss, I consider the performance beyond remarkable. Many thanks to by our contributor @Romuald for designing the algo and our contributor @Yowster for managing the strategy. The service is only $150/month or $1,200/year and based on the performance, the price is expected to increase in 2026. This should be a $500/month service. If you started 2025 with $100,000, your portfolio would be up $74,600 by now. Not a bad return on $1,200 investment.2 points
-
I had to restrain my laughter so I won't wake up my wife!!!!! (punch line:"googled it" !! Sarang2 points
-
It turns out that my issue was based on a misunderstanding. I am not permitted to trade TLT for the reasons given above but I am permitted to trade TLT options. Thankfully I can still follow the SteadyYields trades.2 points
-
I trade using IB (I am in France) and I never met this kind of issue. From my experience, it turned out that they always replied to me when I add a problem, even if it was with a certain delay by mail. You can also directly call them and ask.2 points
-
This is an excellent question, and I completely understand the concern, considering the history.. We manage risk in the following ways: First is position sizing. We typically don't utilize more than 50-60% of the model portfolio. The main trade (based on the algo developed by @Romuald) is around 30% ($3k) and there are 1-3 extra trades based on Monte Carlo simulation tool. Second is managing the negative gamma. The trades are typically opened 5-7 weeks to expiration and closed 2-3 weeks to expiration, to reduce the negative gamma. That said, sometime even the best intentions go wrong. Last week we closed the long term bullish TLT trade that was opened months ago and went against us right from the beginning. We held it to give the thesis to develop, but unfortunately it didn't happen, and the trade was closed for $2,700 loss. Along with two other trades, we will record ~18% in October. This is probably as bad as it gets, but considering the fact that we make around 5-7% a month on average, we consider it an acceptable drawdown. We will be still up 56% in 2025 in 10 months, far exceeding our profit target of 30-40%. Hope this answers the question.2 points
-
No, you're right. Sorry for the mistake. I'll update my post so noone is misled in the future. I did a quick formula on the last 5 butterfly trades at IB and last 3 at Tradier and failed to double the contracts at IB to account for open + close, so my numbers for IB are off. The funny thing is I looked at the last IB trade to verify it looked right and on that particular trade, the cost/contract was about $1.10, so I assumed the overall number was correct. Thanks for pointing that out. So I went back and looked at all TLT butterflies I've traded since 2024 and the actual cost/contract at IB was $0.5041. The actual cost/contract at Tradier was $0.11925. The other numbers I posted on total commissions paid and net after-commission profit is correct, though - that includes all SteadyYields trades and not just TLT. (As a side note, I had a few months where I traded more than 10k option contracts at IB, so I believe that made commissions lower than normal just on those months)2 points
-
@Yowster @greenspan76 here are my YTD trades in SY for TLT ... I use IB as there really is not another brokerage to use in Canada at least for options ..... so yes the comms are high but still making good returns
 2 points
 -
@greenspan76 your comment about your experiences with IB commissions on the TLT trades made me look at my commissions for every 15-lot TLT fly this year. As you know IB commissions vary, but my range across all of those trades was a low of ~$0.35 and a high of ~$1.05 per contract (with only two trades of paying $1.00+). The average across all those trades was ~$0.60 per contract, so much lower than what you have observed. At that $0.60 rate the total commission to both open and close the trade was $4.80 for each fly (4 legs on open and close) - and with each fly typically costing ~$200 that commission is 2.4%. Ideally, I'd like under 1% impact per trade, but these are 4 leg trades so while not ideal the commission impact is bearable. Of course if you can lower fees and the same fills with another broker then that is better. The question is why your IB commissions are so much higher than mine, I have nothing special or out of the ordinary tied to my IB account.2 points
-
The losses were with the previous manager who did a terrible job. Yowster has been managing it since the other guy was ousted, and there has been good returns. Read the postings on the Forum or follow Kim's email updates on Steady Yields. Sarang2 points
-
1. IBKR is a very low commission broker. I have used them for several years with both Steady Yields, and also better yet with Steady Collars strategies. Their commission structure as well as low Margin interest rates allow you to keep most of the profits for yourself. 2. You can read about it in the Forum Steady Yields Sarang2 points
-
Yes it includes the heatmap.1 point
-
Looks like a great tool but I dont have time to assess before June.1 point











This leaderboard is set to New York/GMT-04:00